
UST Moves 1978-1982: The Inflation and Stagflation Years
We look back at 1978-1982 UST shifts as inflation soared and a new sheriff came to town.


We review the migration of the UST curve from a period of relative cyclical strength in 1978 into the darkening inflationary period of 1979 and then on to the stagflation and double-dip recession of 1980-1982
The transition from 1978 into 1979 shows the relatively flat UST curve (front end notched, inverted beyond 1Y UST) of 1978 moving into a full inversion and upward shift during the much weaker economic backdrop of 1979.
The market faced the threat of stagflation and saw the appointment of Paul Volcker in August 1979.
It is hard to briefly summarize a period that saw a swing in the front-end inversion of the 3M to 5Y UST of -325 bps in Dec 1980 to a positive 3M to 5Y UST slope of +518 bps in Aug 1982, but it is fair to take that as evidence of dramatic moves in monetary policy and fundamental shifts of industry trends and the broader economy.
This commentary continues the review of the UST curve shapeshifting and migration across the cyclical turns. The pieces in this series are meant in part as a memory jogger for some but also as a history/summary for those looking back across time for context in past cycles. We are going to include the series in a planned “Primers and Histories” channel on Macro4Micro.
One goal we have is to offer more primers for “new folks” but also as a time saver for those who want to facilitate a review of past cyclical war stories as they consider the overlap of past monetary and economic cycles with the action today. Each cycle was unique and distinct, but they provide input for the thought process.
The most troubling aspect of the 1978-1982 visual is how high an inversion can shift upward in such a short time frame. We got a taste of that in 2022-2023 but at much lower rates.
Key considerations across such cyclical turns and monetary actions include:
How fast can inversions unwind into flattening on either Fed easing and a UST rally or from a steepening and UST sell-off? What are the key drivers?
How often have we seen upward or downward shifts out of an inversion and why?
Is the Fed more reactive “after the fact” or do they move aggressively (or too early) in the process to meet their dual mandate?
When has banking system health concerns and financial strain interfered with the dual mandate of price stability and employment?
When the strategy takes a course that interferes with part of the mandate (usually sacrificing employment), what examples were there of things going very badly for the markets or the economy?
How often have we seen the dual mandate priorities clash and become a zero-sum game?
How does the Fed reverse actions that may give rise to market excess or bubbles and what constraints are there in such cases?
These sorts of questions come up across cyclical turning points (or cycles within cycles) such as the 1988-1989 swing into a period of serious financial system strain (S&Ls, brokers, etc.). We also see a mix of factors at work in the 1990 downturn and then into a 1991-1992 bout of bank system stress. The asset bubbles and emerging market stress of 1998-2002 saw the TMT implosion leading to a soft landing but Greenspan’s massive easing. The 2006-2007 swings in the curve came on the way into the credit crisis, and most certainly we see tough decisions being made in 2022-2023 with the worst inflation cycle since the early 1980s.
The early Volcker years (1978-1982) as the ultimate challenge of the Fed mandate…
We see so many references to the early Volcker years and the treacherous bridge from Carter to Reagan that we had to start with this time horizon. The famous inflation war led by Fed Chair Paul Volcker is still one for the record books with some trips to 20% fed funds rates.
We saw a protracted double dip recession that strained the economy and more than a few sets of nerves in the White House and Cabinet as well as Congress. In a different era, Volcker would have been played by John Wayne (who was much shorter than Volcker and smoked cigarettes instead of cigars). Volcker resurfaced after the 2008 credit crisis with the same style as he pushed for the Volcker Rule.
We lead with the 1978-1982 period as a useful frame of reference even if much of the economy and financial system in the Volcker years was radically different than today. The fine details were different, but the broader checklist of inflation fears, rapid secular change, uncertain cyclical outcomes, strained politics, and ugly, violent geopolitics have a lot in common with today.
Some of the cyclical turns we will look at in this UST series really hammer home how fast the curve can move with the policy actions sometimes reflecting the personalities of the players. Volcker had the subtlety of a Viking raider, Greenspan was an Ayn Rand follower with a lot of conviction about everything he said, and Bernanke was a wonky nerd professor.
Volcker was about bringing the target problem to heel without concerns for finesse or politics. Greenspan would turn his assumptions into facts if not gospel (we will flag some of those when we get to his years). Bernanke was a cross between Alfred E. Newman (What, me worry?) and a brilliant econ technocrat. He had the misfortune of facing the housing bubble and structured credit debacle and seeing how little information the Fed actually had on counterparty risk exposure, the inadequate measurement and reporting of such risks, and how precipitous bank interconnectedness risk had grown in the age of derivatives. We will get to that with the 2006-2007 cyclical turn period in a later piece.
One common feature under Greenspan and Bernanke was that they underestimated the willingness of the fee hungry to trump prudent due diligence. The nature of the wholehearted embrace of caveat emptor was underestimated in more than one underwriting cycle.
Inflation and taste of macro pain 1979-1982
The chart below frames the timeline for CPI and PCE inflation across the period that has served as the regular frame of reference when talking about the 2022-2023 inflation wave. The comparison of 2022 to 1980-1981 is fair in the literal “highest since” comparison, but the US inflation cycle from 1979 into 1980-1981 and ensuing monetary response was in a different world. The inflation peak in this cycle was single digits at 9.1% for CPI and 7.0% for PCE. The numbers in the chart above are off the scale.
We also plot the long-term median for CPI and PCE for the period of 1972 to current days. Those are obviously much lower.

The most famous stretch of stagflation came after what many would see as the cyclical calendar year peak of 1978. The year 1978 had been a 5% handle growth GDP year but one where cracks were forming in some major industries. Those cracks opened much wider in the following years. The combination of another energy crisis in 1979 (the fall of the Shah followed by the Iran Crisis), and a weakening economy started to rear up from the consumer lines to fixed asset investment.
The year saw a negative PCE quarter in 2Q79. The stretch of the 2H79 period was eroding quickly in fixed asset investment and the consumer sector. Gross Private Domestic Investment (GPDI) was negative in 3 of 4 quarters in 1979 but contracted by almost -30% in 2Q80 and -24% in 3Q80. Most of 1979 had double-digit handles on CPI from the 10% to 13% range. Unlike our current experience, we see declining inflation in 2023. Back in 1980 and 1981, life was getting worse than 1979. That was soon to be the stagflation period.
We should note that the official peak of the cycle was Jan 1980 per NBER, but 1979 was a constant debate around whether the recession had started. The cyclical peak per NBER came after the end of 1979 in Jan 1980 with that cycle lasting until July 1980 (see Business Cycles: The Recession Dating Game 10-10-22) in what became the first leg of a double-dip recession. The second leg of the recession started in July 1981 through Nov 1982, which tied with the 16-month recession from 4Q73 to 1Q75.
The sustained high inflation rates across those years show how ugly it can get relative to what we saw in 2022 and are seeing now. We had seen double digit annual inflation rates in 1974 (11.1%), 1979 (11.3%), 1980 (13.5%), and 1981 (10.3%). That obviously hurts, but those recession years also set the stage for the post-1982 bull market bounce off the bottom.
The market saw the 1983 annual CPI of only 3.2% to start off the expansion years. The bull market for bonds and stocks came along with a doubling of nominal GDP during the 1980s. In terms of looking back at CPI across these years, there are plenty of databases breaking out information (notably in the BEA data products), but the Federal Reserve Bank of Minneapolis has some very user friendly compilations of annual CPI and related data.
Bring on the monetary responses…
As we have covered in other commentaries, Volcker’s main thrust was about managing growth in monetary aggregates (M1, M2, M3), and many were relieved to find some utility from all those textbook hours in economics class. It was a different time relative to what followed in the post-Volcker years as fed funds targeting and a slow but steady move toward Fed transparency unfolded over decades.
Fed funds swung widely under the money supply focus with 1980 seeing a Hi-Lo swing of 9.9 points followed by 6.7 points in 1981 and 6 points in 1982. Now that is volatility. For most periods during the peak of the inflation war (not all periods given the money supply focus) and then later for years into the expansion, fed funds was well in excess of inflation (see Fed Funds vs. PCE Price Index: What is Normal? 10-31-22, Fed Funds-CPI Differentials: Reversion Time? 10-11-22).
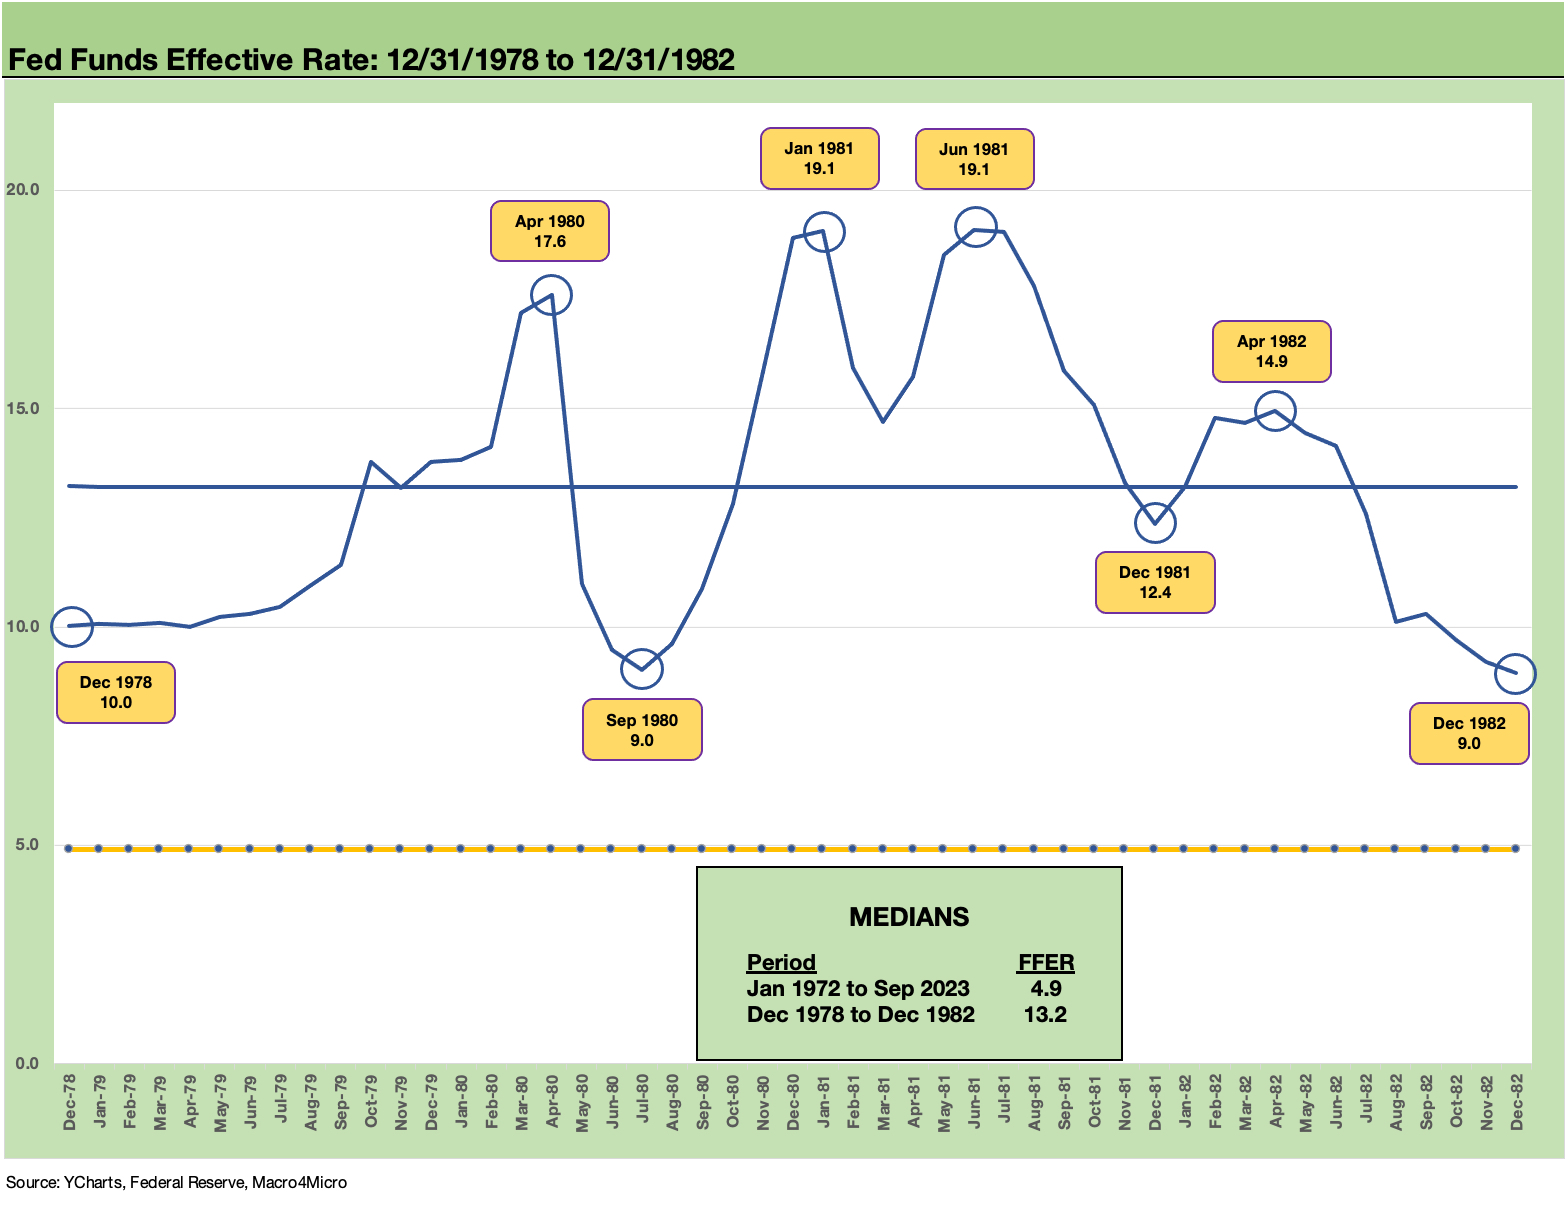
Above we plot the fed funds response based on the rolling average daily fed funds data provided by the Fed. We highlight that the daily averages plotted above smooth out some months and leave out some of the pops to the 20% fed funds level.
The Prime Rate (not gone but often forgotten) was used in those days as the pricing reference for “prime plus” loans. The Prime Rate crossed the 20% line in Dec 1980 on the way to a record peak of 21.5% in late Dec 1980. That translated into a lot of 23% to 25% borrowing lines. That prime rate had averaged 8.6% from 1975 to 1979, so the shock for borrowers is self-evident.
As a reminder, LIBOR was not the main benchmark until the mid-1980s. Prime is around 300+ bps more than LIBOR, and it flatlined at +325 bps during ZIRP and began to move higher again after the end of ZIRP.
For a few more frames of reference on the “bad old days,” fed funds averaged 13.4% in 1980, 16.4% in 1981, and 12.3% in 1982 (Sources for this paragraph: Federal Reserve Bank of Kansas City). The 3M UST averaged 11.4% in 1980 vs. the 20Y UST of 11.4%. For 1981, 3M UST averaged 14.0% and UST 20Y 13.7%. The highs for the Moody’s Corporate Aaa benchmark posted at 15.5% in 1981.
These numbers make your eyes bleed, but it is worth offering some context when framing the absolute levels of peak inflation and peak interest rates in the current cycle. Those bond yields exceed the long term nominal returns on equity.
The UST shifts across the period…
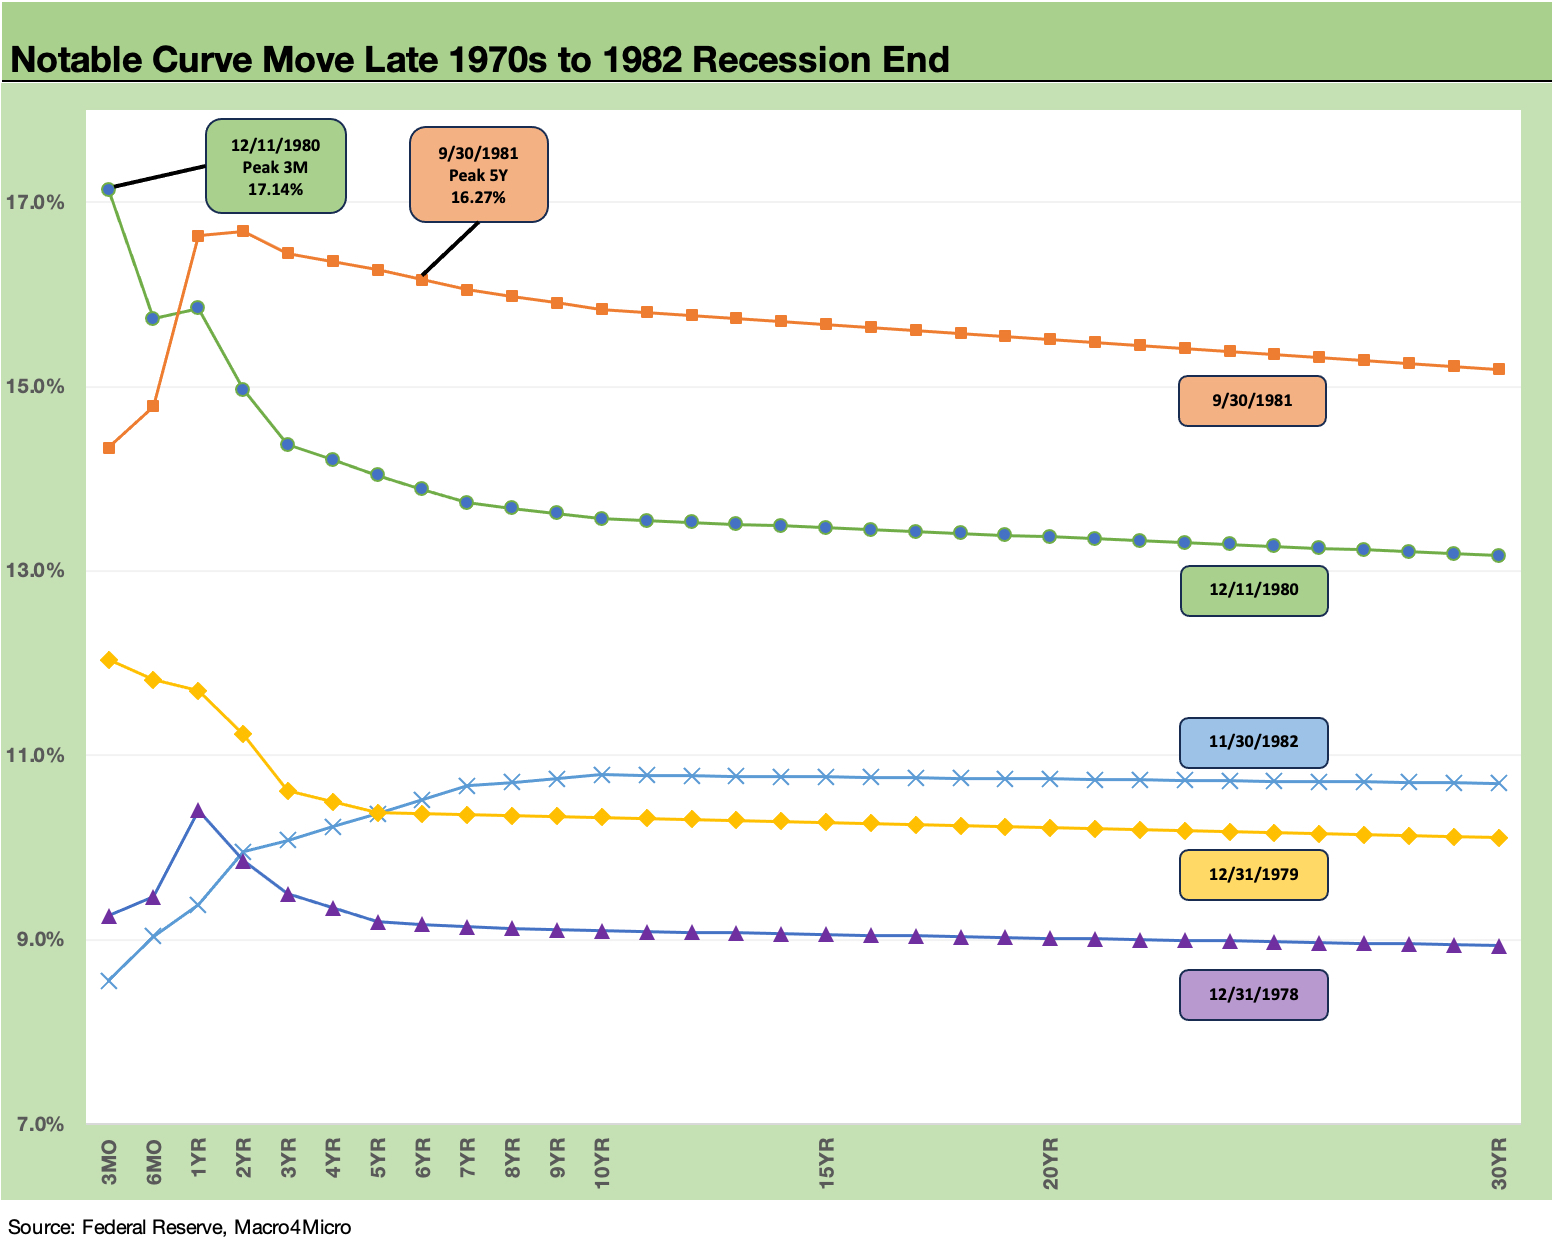
The chart at the top of this piece captures the 4-year ride. The upward shift and bear inversion into 1979 then saw a heavy dose of duration pain with materially higher UST rates into 1980 with an even steeper inversion. The peak 3M UST had been reached in Dec 1980 at over 17%.
After the 1980 bouts of volatile GDP quarters and economic contraction with the inflation spike, the market saw another brutal upward UST shift in 1981 with similar volatile quarters (negative and positive). Another dose of duration pain in 1981 saw 5Y UST peak at over 16%. The market saw a fresh 20% fed funds level in the spring.
Over the course of 1982, the deep contraction (-1.8% annual GDP including -6.1% in 1Q82) tied with 4Q73 to 1Q75 for the longest downturn post-war recession at 16 months (July 1981 to Nov 1982). Bond returns saw the benefits of the downward shift as CPI declined from +8.3% in Jan 1982 to +3.8% in Dec 1982. 1982 ended with an upward sloping yield curve but with most of the yield curve posting double-digit levels.
Borrowing costs were still a headwind for the economy, but those rates did not derail the arrival of a bull market in stocks and bonds on the immediate horizon. There were some storm clouds on the horizon for OPEC and the oil markets that were showing signals in late 1982, but that is a different story that would eventually flow into lower inflation of 1% handles on CPI by 1986 (regardless of monetary aggregates).
Some tales from the double-dip crypt…
The period captured in the charts herein came at a time of geopolitical turmoil (US hostages in Iran) and an Afghan-Soviet War that was underway. The period was one of economic turmoil for multiple reasons well beyond inflation since the structure of US industry was in a state of flux, numerous major industries were going through deregulation adjustments (freight and logistics, airlines, financial services among others), and waves of imports were coming in across many products from lower cost (or more efficient) countries.
The second oil shock of 1979 radically changed consumer preference in such cornerstone industries as the automotive sector. Chrysler had been bailed out by the Carter Administration in 1979, and Japanese imports and product mix shifts had the US auto sector in crisis. The transplants had not arrived yet, and the first Honda Accord was built in Ohio the same month that the recession ended (Nov 1982).
Much change was still ahead even away from monetary policy. Those were unusual times that included gut wrenching changes that had been underway across the 1970s in everything from the manufacturing sector to the global currency framework and what it all meant for the dollar’s value and trade. High interest rates tend to distort currencies and undermine trade competitiveness (the 1985 Plaza Accord is for another day).
The takeaway from the 1978-1982 adventure is inverted curves can move higher quickly and brutally and aggressive, sustained responses are required. Inversions can move much higher with the wrong set of conditions.
It takes fearless leaders of stature and credibility to do what Volcker did. They are not looking to be liked. The new Washington could not stomach such a person in current times if he had a backbone and a big brain. Hyper partisan operatives are likely to be the new normal in future appointments. That is especially the case after the adventures of Trump when he was openly looking to terminate Powell (he could not legally do that). We also saw candidates for the Fed being blocked based on their view on various “culture” topics.
In our next piece we move onto the turn from the credit cycle peak of 1988 into the chaotic transition period of 1989.