The Employment Cost Index June 2024
The June quarter ECI and productivity kept the moving parts mixed in a hectic week of macro metrics that give the FOMC more ammo for easing.
That is, unless there are more sellers than buyers...
The Employment Cost Index (ECI) is always an important set of numbers in framing labor pricing power and considering how that might flow into employers trying to pass on more of the costs to consumers.
The compensation stats were slightly better sequentially for the inflation story but do not offer an abundance of reassurance on labor costs when framed against 3Q23 and 4Q23.
Separately, ISM Manufacturing and Construction added some more inputs that support the easing school with construction spending weaker after a very heady run in construction activity from all the fiscal support (infrastructure, EVs, CHIPS, etc.).
The stimuli got a harsh response from equities and HY with stocks having one of their worst days of the year and HY bond 10 wider on the day and +27 bps for the trailing week.
Inflation and the Fed remains the main event, and the quarterly ECI as plotted above was not as helpful as some might have hoped. The +4.1% YoY growth in compensation costs for all civilian workers came alongside a rolling 3-month reading at +0.9%. For quarterly readings, the +0.9% is trending favorably from the March quarter with its +1.2% level but it is only in line with 4Q23’s 0.9%.
The Sept 2023 and June 2023 quarters each posted an ECI of +1.0%, so the overall ECI input into the FOMC recipe book might go into the slightly favorable list of ingredients. That may have a touch of rose-colored glasses for UST bulls, but it is easier if we tap into the good productivity news that was also released this week.
Among notable compensation trends, we see State and Local Government Workers at +1.2% for the June 2024 quarter, a slight downtick from March 2024 and 3Q23 but above 4Q23 and 2Q23. Using just wages and salaries (vs. total compensation), the total civilian workers number of +0.9% is at a low looking back to the peak 2022 inflation period with the private sector in 2Q24 at 0.8%.
Among other notable highlights in the ECI was the union vs. non-union differential. Private sector compensation saw union costs increase by +6.0% YoY vs. +3.6% for non-union. Private sector unionization rates are very low at a 6.0% union membership rate, so the higher union compensation does not move the aggregate needle by much. The public sector union membership rate in 2023 was much higher at 32.5%.
Some multiplier-effect sectors slowing down…
The more helpful data for the FOMC easing hopes included signs of some weakness in construction spending and manufacturing. We saw more of the usual array of weak ISM data that came in even softer than expected at 46.8. ISM has “contracted… for the 20th time in the last 21 months” per ISM.
Construction has been a major part of the Biden economic story as covered in prior commentaries (see Construction Spending: Stalling Sequentially at High Run Rates 6-4-24, Construction Spending: Timing is Everything 12-1-23, Construction: Project Economics Drive Nonresidential10-2-23). The top may finally be here.
For construction, we saw -0.3% decline sequentially in total private construction and posted a - 0.4% decline from May to June in public construction. While that sequential trend gave the ease advocates another item to hold onto, the reality is that construction has been hot YoY with total construction at +6.2% YoY for June, private sector at +5.9%, and public construction at +7.3%.
Residential construction in the private sector was down sequentially at -0.3% with -1.2% for single family. Single family was +9.9% YoY and total private sector residential at +7.3% after dropping in a YoY decline in private sector multifamily of -7.4%. We have routinely covered the housing sector action in our new home sales and home starts updates (see New Homes Sales June 2024: Half Time? Waiting for Mortgage Trends 7-24-24, Housing Starts June 2024: Still All About the Deliveries 7-17-24), so the softening in the rate of construction is not a new topic with mortgage rates a critical factor and supply-demand fundamentals favorable on demographics and intrinsic need.
A plateau in overall construction activity is a reasonable expectation given the backdrop of interest rates and the pace of growth to this point. Even sequential declines still show an impressive volume of activity that has brought material increases in construction payrolls (see Payroll June 2024: The Race Gets Confusing 7-5-24). We will get that update tomorrow.
The links between labor compensation trends and unemployment rates are detailed above. As we covered in our JOLTS commentary this week, there is a sustained high level of demand for workers as evident in the 8.2 million job openings report. That level of openings is above the highest reached in the Trump years even if well down from the 12.2 million March 2022 peak openings (see JOLTS June 2024: Countdown to FOMC, Ticking Clock to Mass Deportation? 7-30-24).
Friday’s payroll numbers will be illuminating for all the usual reasons on the tally of employed, unemployed, and structurally underemployed as well as the size and direction of the labor force across the methodologies. There will be the usual array of disinformation in the political world of who is getting the various jobs (escapees from foreign asylums, etc.) and the usual attempt to politicize a clear economic trend of record payroll additions under Biden. Most of the nonsense has been discredited factually, but facts are often not a priority for some audiences. At some point, the weakness in jobs will start to show up in more force, and then the FOMC will need to move expeditiously.
How policy makers and the market broadly will factor massive tariff plans into their forward-looking inflation risk (or stagflation risk) is a lot of art and a little science. There is no shortage of “BS” and some highly subjective handicapping.
A dash of productivity always helps….
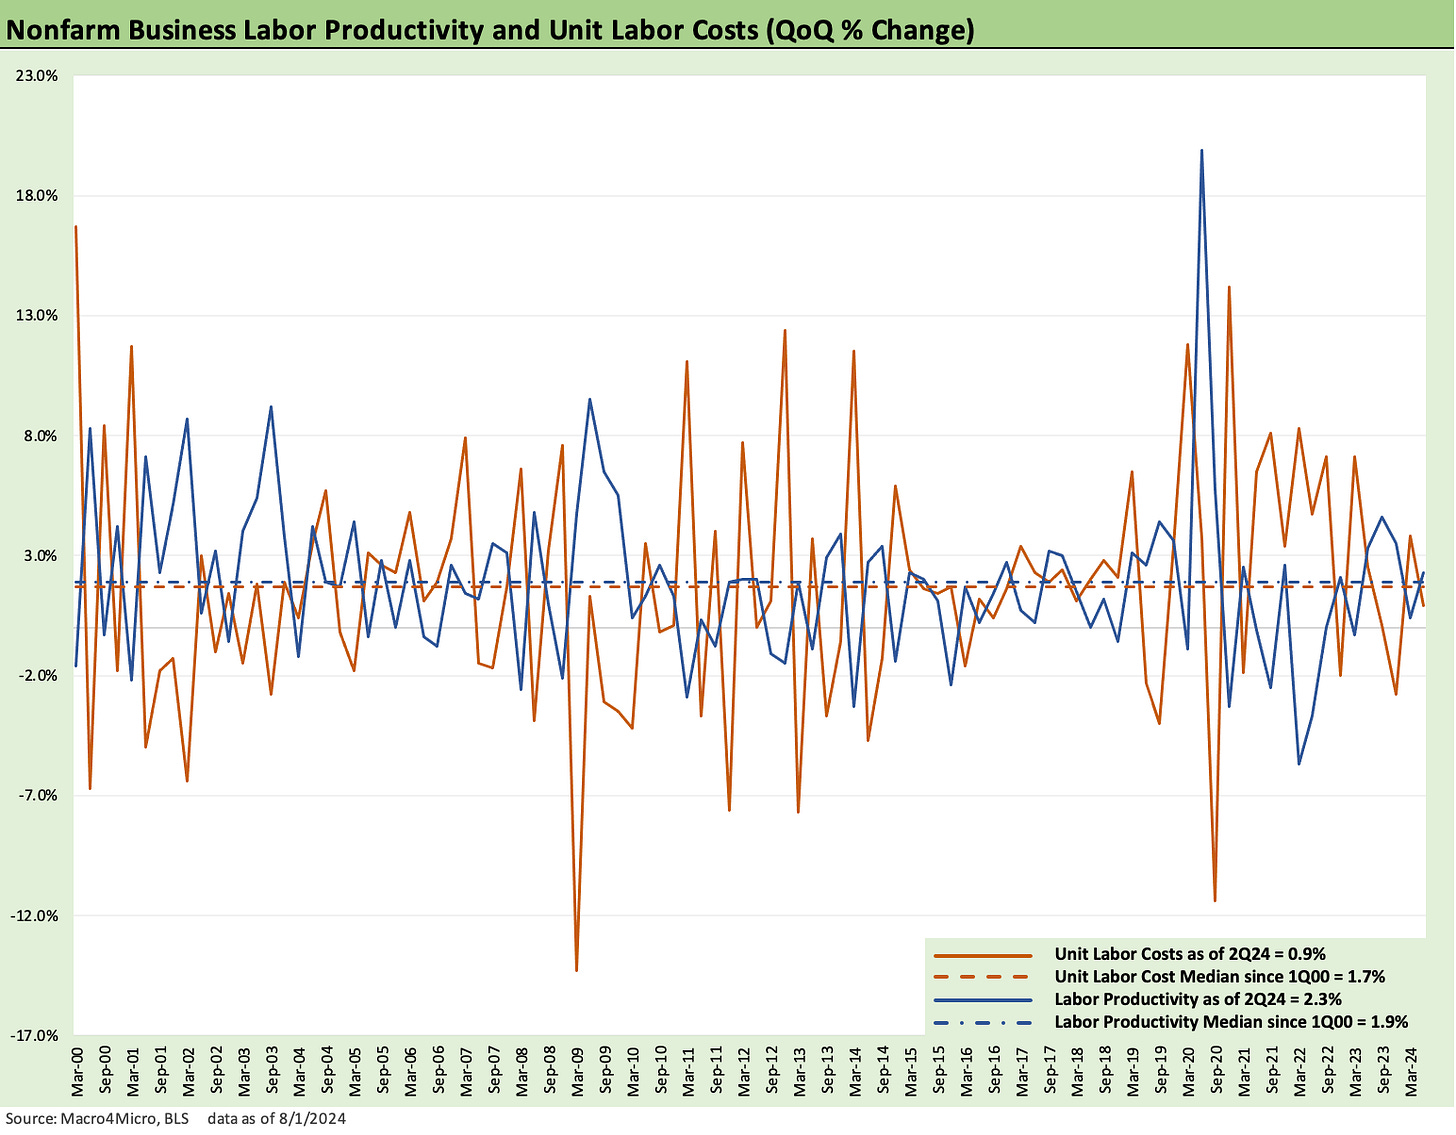
The next two charts update the BLS data on labor productivity and unit labor costs. The economist circuit loves this type of data, but we suspect most people are more inclined to set their sundial by the very tangible ECI data that shows labor costs staying high relative to the last cycle as framed in the earlier ECI chart.
Having enough anxiety around jobs and comfort with wages to get to -50 bps lower in Fed funds with such an inverted UST curve is easier than reaching a conclusion that labor costs are easing materially when there are 8.2 million job openings.
As we saw back after the 4Q23 ECI report (see Employment Cost Index Dec 2023: Compensation Mixed Picture 1-31-24), the productivity numbers took some of the edge off what at the time was a +4.2% YoY increase in labor costs (see Productivity: Takes the Edge off the 4% handle YoY ECI 2-1-24). The melding of labor costs with output per hour is old-time econ analysis, and the 2Q24 numbers show unit labor costs offering some good news.
The BLS cited an increase in labor productivity of +2.3% in 2Q24 and an increase of +2.7% vs. 2Q23. Since 4Q19, labor productivity has increased at an annual rate of 1.6% per the BLS. The prior cycle from Dec 2007 to 4Q19 was +1.5% and the long term from 1947 is +2.1%.
Employment Cost Index links:
Employment Cost Index March 2024: Sticky is as Sticky Does 4-30-24
Employment Cost Index Dec 2023: Compensation Mixed Picture 1-31-24
Employment Cost Index Sept 2023: Expect the Expected 10-31-23
Employment Cost Index: Rings of the Redwood 7-28-23
Employment Cost Index: Slow Motion 4-28-23
Employment Cost Index: Labor vs. Capital …Tide Turning or Swirling? 2-1-23


