
Payroll July 2024: Ready, Set, Don’t Panic 8-2-24
Payroll shortfall gets a big reaction, but the theme for now is more about slower adds than trimming the ranks.


Use only when necessary...not yet.
The fears of recession come and go across cycles along with record highs in stock markets (Bush, Obama, Trump, and Biden all had them), corrections (all four had them), and some bear markets thrown in (notably Bush, Obama, and Trump).
The convergence of valuation excesses that were getting a lot of headlines recently, anxiety over FOMC policy and UST curve shapeshifting, deafening political noise, worries around the policy turmoil that could unfold in 2025 (tariffs, more election denial, taxes, debt ceiling risk), and geopolitics (Iran is currently raging and has a lot of missiles) all offer easy excuses to sell.
Today’s payroll shortfall came in at a level that still had triple digit (114K) total payroll adds that were higher than the April low (108K), so the market dynamics and trigger pulling impulses extend well beyond a few macro setbacks this past week.
We look across the occupational deltas, and the muted hiring in July will still need rollbacks in retail and hospitality and leisure to generate more worries since that means the consumer has gone on a serious diet in occupations where the headcounts are very high.

The above chart updates the running monthly payroll adds since the tightening cycle began in March 2022. We see the 114K adds this month, which was lower than all the months except the +108K in April 2024. As some of the political axe grinders have pitched a story line of doom (see Employment: Real Numbers vs. Fictitious Dystopian Hellscapes 3-9-24), those are pretty good numbers for the first major inflation fighting monetary cycle in over 4 decades. The relative performance stands up well as we look back across the decades (see Employment Across the Presidents 8-15-23).
We highlight the median adds to payroll since Jan 2009 was +210K, so the jobs numbers are obviously well below that level. The growth since March 2022 was remarkably successful in the face of rising rates, and that is all part of the bigger story line around where those additions weighed in (see occupational recap at the bottom of this commentary).
The inexorable rise to record payroll counts even with unemployment rates rising does not set the table for a rational, protracted sell-off on a jobs number north of 100K in adds. There have been sharp markets sell-offs in periods such as 2018 as late summer and early fall equity peaks tanked into year-end (see Histories: Asset Return Journey from 2016 to 2023 1-22-24). We will look at those comps in a separate commentary. The increasing sense that stock markets have risen too quickly has picked up in the headlines of late as has the fact that there is an obstacle course of risks ahead.
A few top-down questions…
From the narrow perspective of the payroll release, we can ask a few questions as we look across the line items including some of the more logical ones on the short list:
Were the low absolute levels of payroll additions about lower adds or a series of sharp declines? (Answer: lower adds)
Was there a concentration of payroll declines in key industries? (Answer: No. “Information” was mild but notable.)
Were the recent drivers of rising payroll by industry reversed? (e.g. construction, warehousing/transportation, the usual health care and social assistance, etc.) (Answer: No)
Did the consumer-oriented services business show weakness? (Answer: No. But Retail and Leisure and Hospitality will be lines to watch with their high headcounts).
Among the perennial leaders, we see the Healthcare bucket still higher by 55K but modestly below the rolling average over the past year. Transportation and Warehousing is still rising. Social assistance is still climbing. We look at the full breakdown across occupations further below. Overall, the lower hiring did not show signs of material retrenchment. Goods was higher by 25K, Construction was +25K, and Manufacturing was flat sequentially and flat YoY.
The private sector services line was +72K with Trade, transport, and utilities +22K. Retail was up very slightly. Transportation and Warehouses was +14K. Professional and business services as an occupational line was essentially flat sequentially but still up slightly YoY as a major category grouping. Leisure and hospitality was still higher by +23K. One area of weakness in the pack was the broader Information category at -20K spread across TMT.
Government was off by -2.5K but is up by almost 550K YoY. State and Local government payroll were each up slightly MoM, but YoY we see State up by +151K YoY and Local up by +326K. Local is the biggest employer in the group at 14.9 million at almost 64% of Government payroll and State payrolls at 23% of total government. Federal total is 13% of total Government. As we have covered in other commentaries, something must be going right at the state and local level economies to show that sort of YoY tally (see State Unemployment: A Sum-of-the-Parts BS Detector 6-30-24).

The above chart plots the unemployment rate vs. total payroll adds from Jan 2009 to July 2024. We remove the COVID distortions in the interest of useful visuals and put those COVID totals in the box.
The median unemployment rate across the timeline is 5.3%, and the current 4.3% is moving higher quickly from the lows. We note the highs and lows across the timeline on the chart. The 10.0% unemployment rate of Oct 2009 was a memory of prior cycles from 1982 (detailed in another chart below).
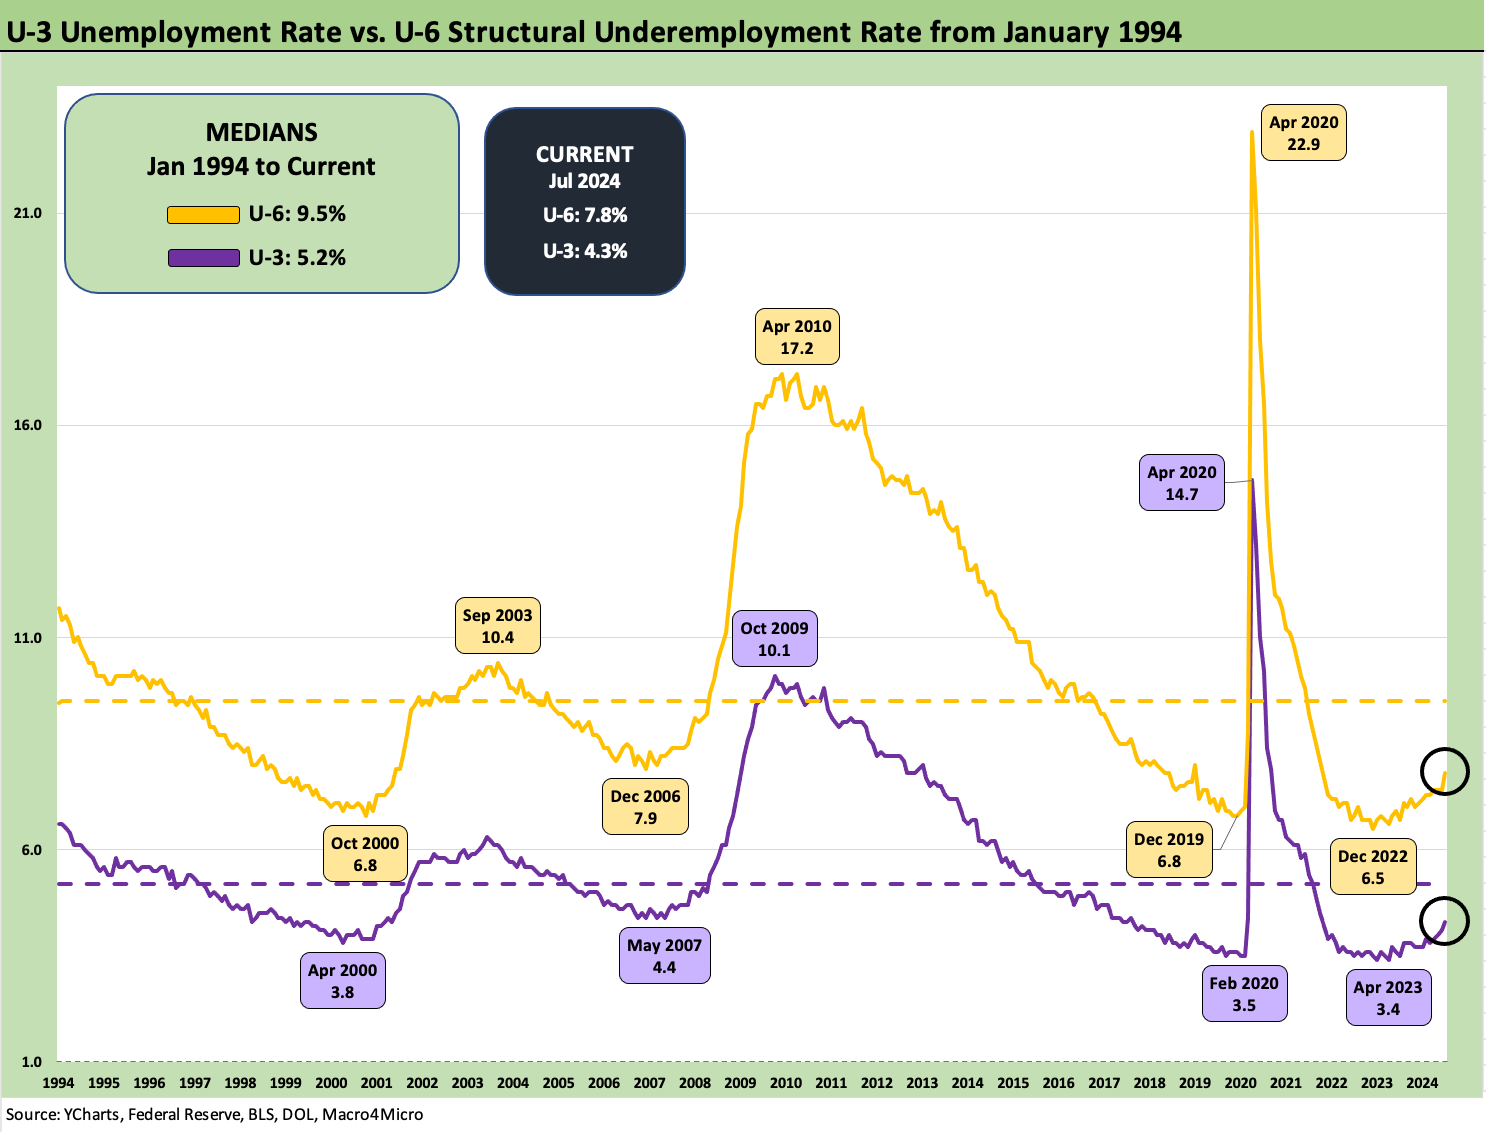
The above chart plots the standard unemployment rate (U-3) vs. the underemployment rate, the U-6. The chart details the low and high points since 1994. As a reminder, the U-6 metric is defined with the numerator as “total unemployed + persons marginally attached to the labor force + total employed part time for economic reasons.” The denominator is “civilian labor force + workers marginally attached to the labor force.”
The U-6 rose sharply this month from 7.4% to 7.8% (SAAR) and is up materially from 6.7% (SAAR) in July 2023 a year ago. That is a big move and gets back to the recurring topic of the quality of the jobs in the ranks that may start becoming fewer if this trend continues.
In longer term context, the median for the U-6 since Jan 1994 is 9.5% while the U-3 median is 5.2%. From that vantage point, life is still pretty good in employment, but that is a stretch for a silver lining given the marked deterioration currently underway from the low U-3 and U-6 of this recent cycle.

The above chart updates the U-6 vs. U-3 differential for a “have vs. have not” metric on employment quality. The current differential of 3.5% is inside the median from Jan 1994 of 4.1%. The 7% handles of March 2009 (recession, stock market lows, auto meltdown, GE panic) and Sept 2011 (sovereign stress, systemic flashbacks, etc.) offer a view of what painful looks like outside a pandemic.
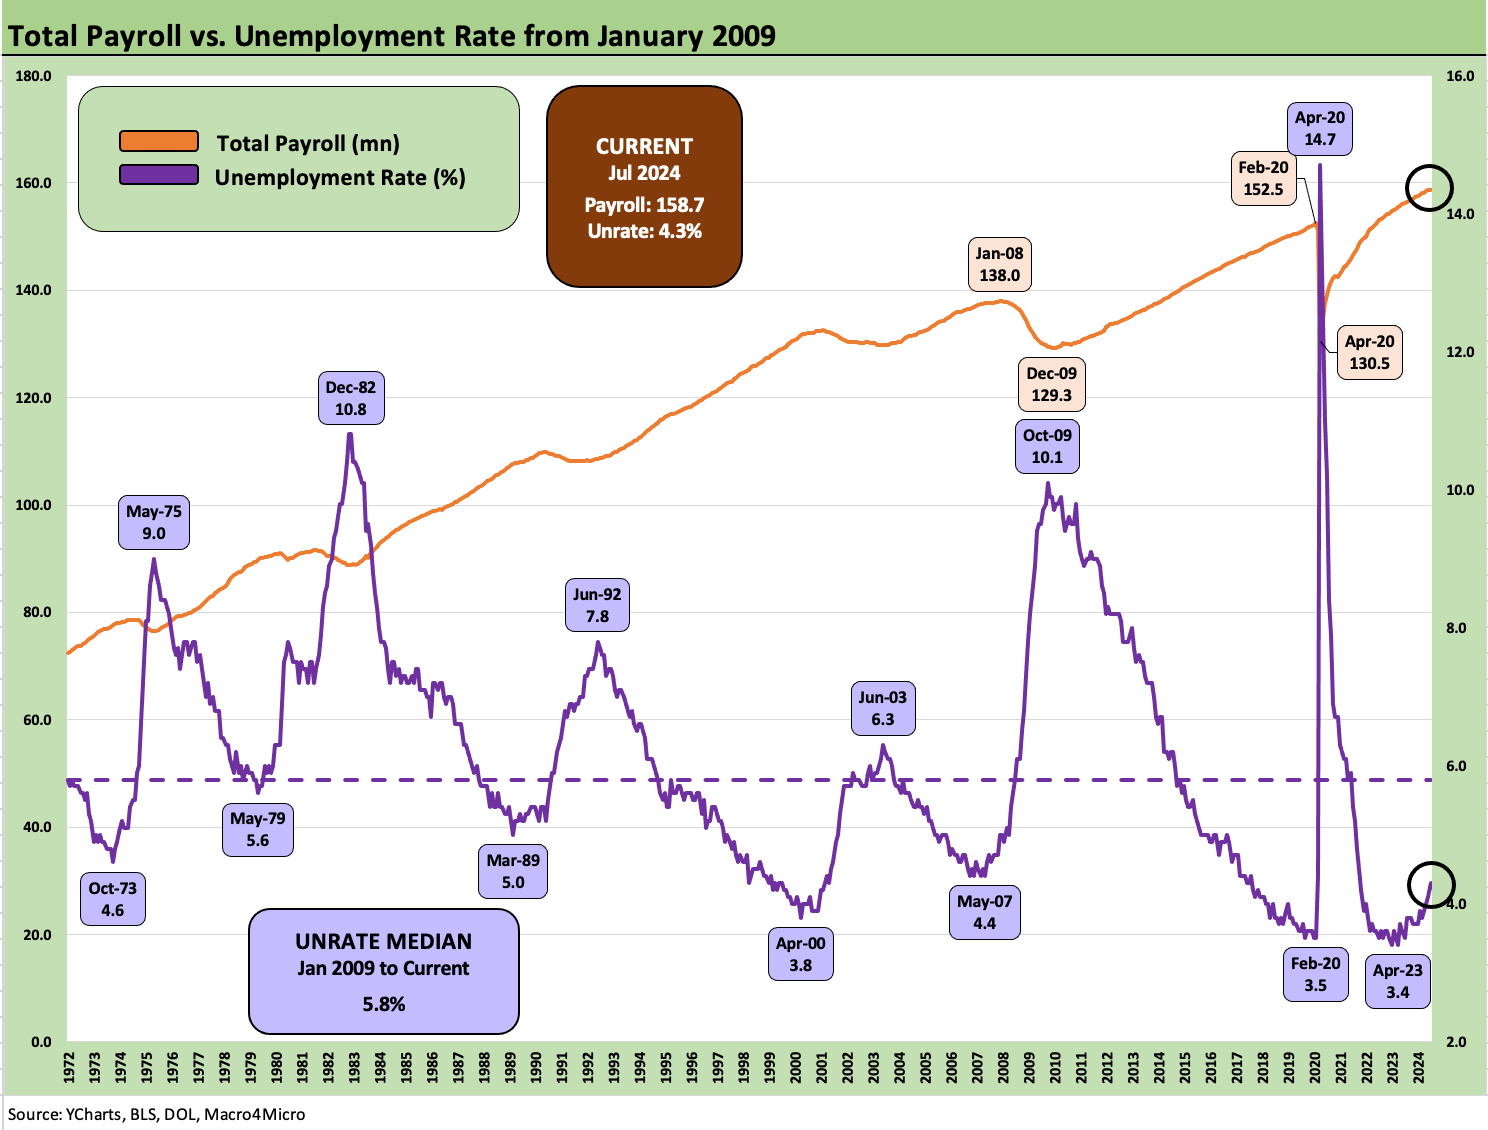
The above chart updates total payroll vs. unemployment rates as the balancing act of “bodies with paychecks” and the size of the labor force (used to derive U-3) shift around across time. During July, the number of unemployed rose by 352K while the labor force grew by 420K.
On a SAAR basis, the 158.7 mn employed (Establishment data) is a high. On a not seasonally adjusted basis, June 2024 was the high.
The unemployment rate grew by +0.2% to 4.3% from 4.1% as more than a few articles have been written about the Sahm Rule predicting recession. The rule is that a recession indicator is triggered if the moving 3-month average of unemployment rises by +0.5% vs. the trailing year low.
Like inverted yield curves, we view those types of “rules” as observations of past symptoms but are not the causes. The path to that rise in unemployment is where the causes lurk and remain the main event. A “cause” would be retrenchment in PCE and consumer spending, materially scaled back capex, or severe erosion of asset quality. Those are the types of things that high tariffs, a return to upward inflation, or credit contraction could cause. The tariffs and inflation and supplier chain risks just happen to be a very real policy risk in 2025. Trump’s tariff plan certainly qualifies.

The above chart updates total payroll vs. job openings as reported in the JOLTS release (see JOLTS June 2024: Countdown to FOMC, Ticking Clock to Mass Deportation? 7-30-24). We highlight some of the events and major trends in the boxes within the chart, but the payroll growth has been impressive in line with demographics and a growing economy.
The fact that the economy is larger and more diversified than it has ever been is one of those general statements that eases the nerves when looking back at past vs. prologue scenarios. The part where the governance of the country and the states has not been this screwed up since the Civil War is the other side of the discussion.
Geopolitics is also a decidedly negative risk that is very hard to trade near term until the level of aggression on trade becomes clear. Europe and the Pacific are scenario nightmares if one wants to be bearish while the Middle East and Russia-Ukraine are violent and intractable on a good day.

The above chart offers one more angle with CPI plotted against the unemployment rate. Inflation and unemployment brought the use of the term Misery Index back in the 1970s and early 1980s so the two tended to be linked together by the “older crowd” (see Misery Index: The Tracks of My Fears 10-6-22). In a longer term context, both CPI and Unemployment are below median with unemployment rates having more space between current levels and the median.
Into the weeds: Occupational Jobs Mix and Payroll Deltas

The above chart provides a top-level breakout of the Jobs mix and the changes embedded in the +114K headline number covered above. Pick a column (MoM, YTD, LTM) and we still see overwhelmingly a mix of positive numbers. The main takeaway is that the major categories of Goods, Services, and Government all turned in low positive growth and with relatively low rollbacks of headcount across the line items.
This month looks similar to April of this year that saw +108K headline job adds. For April, the major food groups were also positive across the board. The bounce back after April saw +216K in May and +179K in June with a three-month average coming to +170K.
The cart and horse debate around what the Fed will do in the fall and how that will flow into forward planning is one big piece. We would argue that the home stretch of the election fight will not contribute to a feeling of hiring euphoria and broad optimism. There is a very big “bid-offer” between the parties on policy priorities, and the partisan consumer sentiment indicators highlight that no matter what happens, half the country will be pissed off. There are also enough deranged characters in Washington to make the latest version of the crusades even more destructive (debt ceiling brinkmanship N+1?).

The above chart offers a snapshot of the deltas for July for the major industry groups in the release. The composition of the month does not deviate far from recent trends. Healthcare and Social Assistance continue to lead the majority of gains with the Top 5 rounded out by Construction, Leisure & Hospitality, Government, and Transportation & Warehousing. The major negative for the month is Information that has been on a slow decline since peaking in November 2022.
Construction continues to impress in recent months. As we’ve covered ad nauseum, the durability of construction adds amid a higher rate environment is a positive signal around project economics and the multiplier effects in the broader economy that construction activity drives.
Despite good news on the jobs front, the past two months of construction spending data shows some cooling down after a very strong year. The market this week is in a mild panic with some calling for rapid policy rate cuts from the Fed. It may well start up a fresh round of 50 bps cuts chatter.

We provide the above chart as a reminder of where things have gone across the post-COVID recovery and into the inflation war with the highest rate of Fed hikes in decades. The recovery across the board is diverse with some clear winners on secular and demographic shifts.

The Services payroll is always where the majority of jobs comes and this month the size of the Top 3 masks some pretty mixed results in the lines. The mix for line items is 6 positive and 7 negative and the Top 3 posting +101K job adds across Healthcare and Social assistance, Leisure and Hospitality, and Transportation and Warehousing.
The tech layoffs showing up in the Information line have already been playing out as a drag on the numbers this year. Intel announcing a large round of layoffs means an expectation that this segment of the Services picture will keep trending negative the next few months.

The Manufacturing picture this month nets out to pretty much flat at +1K overall. The above chart details the durables line items with the nondurables broken out below. Overall, the variances this month are minor, but we do see another month of contraction in areas like Machinery and Furniture that have been on a downward trend in the past year.
The overall manufacturing payrolls have contracted YTD as the positive gains in Transport equipment (+24K) and Nondurable goods (+12K) have not offset the long tail of secular declines that show up in the rest of the manufacturing lines.

The nondurables side of the ledger is similar to the durables with low gross variances across the board. This covers just over 3.5% of the private payroll count and continues to shrink as a large swath of the lines here show secular declines across industries that have continued post-COVID.

The above chart covers the details of the Construction payrolls that we cited earlier. The headline positive growth here is broad across all the categories listed above. The Nonres construction lines have been running the hottest this year, and that trend continued this month with +13K more jobs attributed to Nonres.
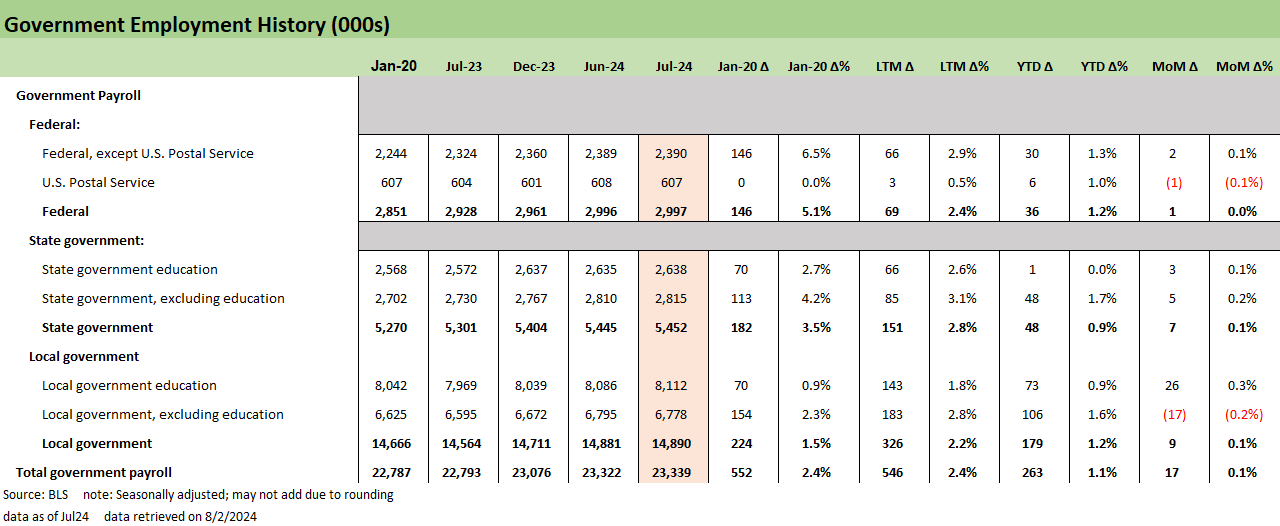
Lastly, we detail the breakout of Government lines that show very strong LTM growth across Federal, State, and Local levels. The +546K LTM compares to +552K in the post-COVID period as it took a long time to get back to flat after the initial COVID layoffs. This month sees more action at the Local level where strong education hiring offset layoffs in the overall picture.
Contributors:
Glenn Reynolds, CFA glenn@macro4micro.com
Kevin Chun, CFA kevin@macro4micro.com
See also:
JOLTS June 2024: Countdown to FOMC, Ticking Clock to Mass Deportation? 7-30-24
State Unemployment: A Sum-of-the-Parts BS Detector 6-30-24
Employment: Real Numbers vs. Fictitious Dystopian Hellscapes 3-9-24
Employment Across the Presidents 8-15-23