
GDP 2Q24: Banking a Strong Quarter for Election Season
We frame a range of 2Q24 GDP lines as personal consumption and fixed investment come in strong, accompanied by a favorable PCE price index print.


The Biden administration just got handed a solid 2Q24 growth rate in a key week with a mix of numbers Kamala can throw at Trump and JD and say, “Show me the weak spots” and then “frame our numbers against yours.”
The combination of decent PCE growth together with strong gross private domestic investment (GPDI) makes for a formidable tag team as Biden (now Kamala) make their economic case as year 4 winds down to the election.
The PCE price index for 2Q24 weighed in at +2.6% vs. +3.4% in 1Q24 while Disposable Personal Income was +3.6% in 2Q24 (+1.0% Real DPI) vs. +4.8% in 1Q24 (+1.3% Real DPI).
The last 4 years come with facts (whether GDP growth, inflation, jobs, consumer metrics, fixed investment rates, etc.) that need to be filtered with relatively (not very) complex conceptual explanations (or debates).
The reality has been that the two candidates to date either lie (factual falsehoods), evade, screw up (Biden debate), generalize too much, or simply answer different questions. Maybe that will change in the home stretch.
You can run but not hide from the facts, so this is a good chance for Kamala and whoever her running mate is to see if they can get Trump to send out a search party for some facts or get JD Vance to show us all his VC-honed math skills of “what is higher and what is lower.”

We routinely update the GDP numbers and revisions each quarter, and the relative lack of focus on the specifics of the line items in the political discourse has been frustrating for those who like facts.
We heard again recently from Trump at the GOP convention what his view is of his own economic performance:
“The best economy in the history of our country, in the history of the world. We had the greatest economy in the history of the world. We had never done anything like it. We were beating every country, including China, by leaps and bounds. Nobody had seen anything like it.”
That statement borders on comical when put in the context of the economic booms of Ronald Reagan and Bill Clinton. They also called the 1960s the Go-Go Sixties for a reason. We do congratulate Trump on beating the 1970s (as did every other leader since the Great Depression). Some also might question whether China’s growth rate of the past few decades should be included in the “history of the world,” and it was damn impressive. The Trump numbers do not even stack up well against Biden in a new millennium when economic growth was slow and crises abundant.
Eventually people are supposed to wonder what facts (or make-believe numbers - if they are numbers at all) are rattling around in Trump’s head. We need to use facts in economic comparisons (even if the GOP ignores facts in vote totals).
With so many challenges ahead and so much risk in the world, how do a President and his policy architects test the efficacy of their policy actions if they lie, deceive, and ignore the realities? It is hard to solve economic challenges without reasoned and empirically evaluated policies when a leader takes up residence in a small room in the corner of his mind and locks the door behind him.
Below we detail some of the latest numbers in the GDP accounts for 2Q24, and then look back across the Trump and Biden quarters. The relative performance will be the cases the candidates need to make to the distinct minority of the voting public that care about truth, facts, and seeing the country run the way they probably run their own private household budgets (rather than on their visceral impulses free of numbers).
2Q24 GDP by the numbers…

The advance estimates for 2Q24 came in strong as detailed in the chart at the top with the headline growth rate of +2.8% for GDP, supported by the +2.3% on the critical PCE line. Within PCE, we see Goods at +2.3% in a strong rebound from 1Q24 with Durables (not shown) at +4.7%.
The investment action stayed strong with Gross Private Domestic Investment at +8.4%, which is the second best since the onset of the tightening cycle. Nonresidential at +5.2% growth was heavily driven by a major rebound in Equipment with Structures lagging on growth after its boom period. Unsurprisingly, Intellectual Property Products stayed true and steady in growth mode.
Residential has tailed off as mortgage rates have stalled growth in homebuilding as we routinely cover in our housing sector and single name work (see New Homes Sales June 2024: Half Time? Waiting for Mortgage Trends 7-24-24, Housing Starts June 2024: Still All About the Deliveries 7-17-24).
We cover a range of historical comparisons below, but we would highlight Government consumption and investment (not shown above) are going strong with Federal at +3.9% and the much larger State and Local growth rate at +2.6%. State and Local in total is 1.7x Federal and almost quadruple the “Federal Nondefense” line, so all those state and local leaders complaining about the state of the economy for political purposes are running two sets of books (see State Unemployment: A Sum-of-the-Parts BS Detector 6-30-24). Their economies are strong, and they are increasing spending and payrolls are growing. Many will not admit this trend unless it is to a state and local audience.
Tale of the Tape: Trump vs. Biden
As we note at the top, “he can run but he can’t hide” was something Joe Louis said about a speedy, fleet-of-foot light heavyweight named Billy Conn who was going to outbox the “Brown Bomber” in one of the classic fights of all time. Joe Louis was well behind on points before he caught up with Conn and knocked him out in the 13th round (My hometown hero, Rocky Marciano, later caught up with an aging Louis, but Joe Louis did not run from the facts of life – unlike Trump).
The question now is whether Kamala Harris will make the facts catch up with Trump and his self-anointed detail heavyweight cornerman JD Vance. Candidates often run from facts or answer different questions. That is especially the case in debates with incompetent or biased moderators.
The questions are easy enough to at least start a legitimate discussion of economic performance:
Who posted superior GDP growth overall?
Who saw the consumer spend more?
Who saw higher corporate investment?
Who saw higher structures investment?
Who saw higher investment in equipment?
Who saw higher investment in intellectual property products?
How did total government spending and consumption frame up?
How about defense spending? Any special factors there? (such as wars?!)
With many state and local spending programs requiring balanced budgets, who saw higher spending at the state and local level? How did state and local decision makers spend more if the economy was not good and they needed to balance the budget?
Does that mean those state and local entities are generating higher revenues to raise that spending/consumption and they actually have decent (or very strong) local economies? Does that mean the state and local leaders lie for partisan purposes when they bemoan the state of the economy? (See State Unemployment: A Sum-of-the-Parts BS Detector 6-30-24).

The above chart updates quarterly GDP histories for Trump and Biden and the single term for each. We use the latest BEA data updates (something Project 2025 wants to purge and realign with “like-minded” staff (see Payroll June 2024: The Race Gets Confusing 7-5-24).
We plot each quarter and detail a median. The median for Biden wins. If we exclude the two quarters of massive COVID swings (2Q20 and 3Q20), Biden had higher highs and Trump had lower lows. If we also exclude 1Q20, Biden had lower lows. The 1Q17 to 4Q24 periods only look decent when held up against Bush’s two terms and Obama’s two terms. They badly lag Reagan and Clinton. Biden wins this comparison vs. Trump.

The above chart tracks growth across the quarters in Personal Consumption Expenditures, which comprised almost 68% of GDP in 2Q24. The sequential increase in PCE was better news than we had been seeing in recent macro data. Once again, Biden wins this head-to-head comparison.

The investment lines are where Biden starts to pull away even more in the comparison. In late 2018 and early 2019, Trump was seeing weakness in investment that led to the FOMC easing 3 times to prop his economy up. That is something we looked at in other pieces. The tariff threat was one frequently cited as the investment headwind. Someone should press JD Vance (alleged investment guru) on that topic. Trump refuses to even recognize the FOMC statements that handed him 3 cuts. He also pretends that 2018 was not an awful year in the markets (see Histories: Asset Return Journey from 2016 to 2023 1-21-24).
Biden wins this comparison hands down vs. Trump.

The above chart gets into some of the weeds under the GPDI line with a look at total Nonresidential (we look at some pieces of the Nonresidential GDP line below). We see Biden winning in this head-to-head matchup also. We have routinely covered some of the areas in our quarterly updates (see links at the bottom).
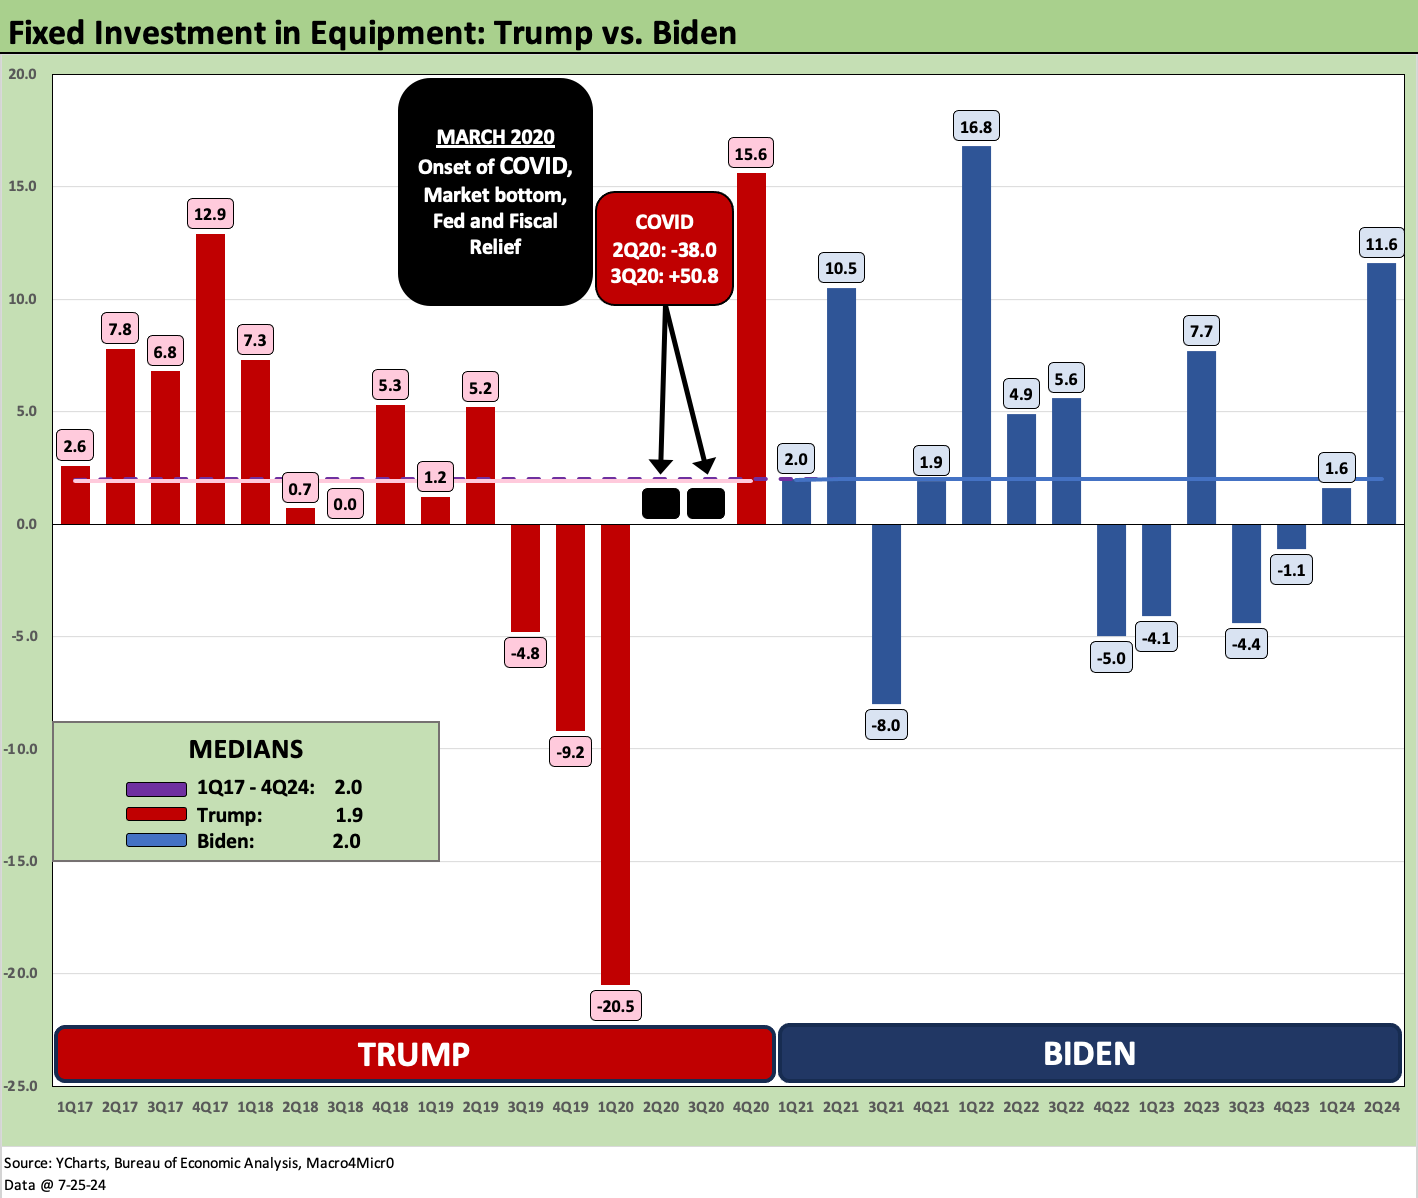
The above chart compares the Equipment line. This one might surprise many since the “record tax cut” (in real terms and vs. GDP it was not in fact a record) was all about fueling capex in equipment. It might have worked better if he did not freak out the corporate sector with his tariffs and trade battles. In this one, Trump loses slightly at the median. He was supposed to easily win this one on the tax incentives. Tariffs undermined a good equipment stimulus program.

The Structures competition in the Nonresidential bucket goes in the “no contest” category with weak Trump numbers and Biden riding the wave of legislation to an easy win. Infrastructure, IRA, CHIPS and other initiatives have pros and cons, but there are a lot of dollars and a lot of jobs (notably construction) that were driven by these economic policies across the Biden term.

As we get into the Government spending lines, it is important to keep in mind how this is dominated by State and Local spending even if Defense is a very important Federal line. The Federal Nondefense slice of GDP that leads to so much rage and battling in Washington is a relatively small part of GDP in context.
For all of the attacks on Biden and his spending, a glance at the red bars above might be in order at a time when government revenues could have been a lot higher with different fiscal strategies. Both Trump and Biden terms were wrapped around the median of the entire period.
In the next chart we look at just the total Federal line.

The Federal line shows quite a bit of outsized action by both Trump and Biden. To listen to the rhetoric, you would think the dollars expended to grow demand in the face of a supplier chain crisis was only done by Biden. The red bars say otherwise in 2020.
The mix of inflationary lag effects on outlays, the FOMC policies, the rates that allowed massive amounts of low coupon-lock ins, and a flurry of home starts in the face of record low rates comprise a much more complicated story line than the talking heads would lead you believe. There was a long line of people and policies in 2020-2021 driving inflation.
Trump piled on to reward his party’s allies and Democrats were the last to jump on top of the pile for their core constituencies. Demand side turbocharging and inflation could have been worse with the reckless Build Back Better excess (insanity?) in the late stages of the ZIRP years. Biden, Trump, and the Fed all did their part. The critics never quite state what the alternative were to that outcome in terms of weak economic trends, employment and human suffering.

The above chart frames the defense lines across Trump and Biden. The pattern above moves from Mideast wars to exits from Afghanistan and then back to escalation of activity with Russia and Ukraine.
Defense demands during the Trump years were growing much faster than during the Biden years as detailed in the medians box. It is hard to see how this line does not go higher in a very dangerous world, and the question (and battle) will be how it gets paid for.
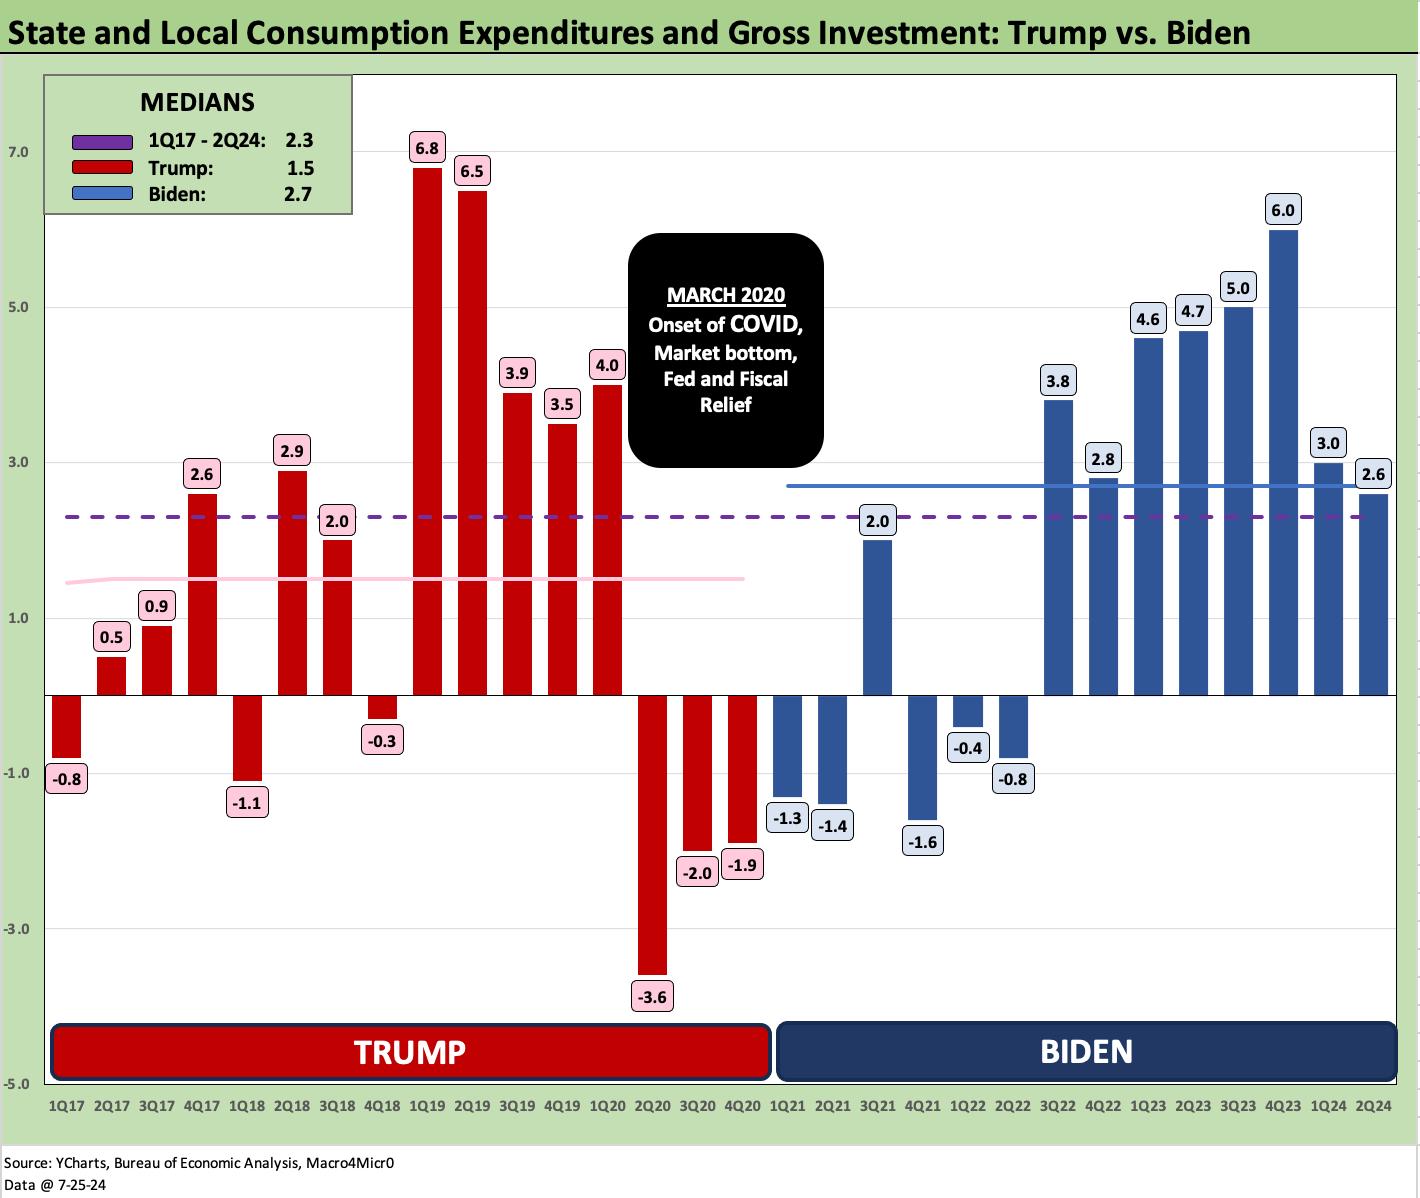
We wrap with the State and Local GDP growth numbers and see higher outlays under Biden. This is where the statement about the economy nationally contrasts with investment trends at the state and local level. Dishonesty in politics is “not a shocker” but the growth at the state and local levels tells a story of favorable economic trends. That dovetails with very low unemployment in the states (see State Unemployment: A Sum-of-the-Parts BS Detector 6-30-24).
See also:
State Unemployment: A Sum-of-the-Parts BS Detector 6-30-24
1Q24 GDP: Final Cut Moving Parts 6-27-24
Construction Spending: Stalling Sequentially at High Run Rates 6-4-24
1Q24 GDP: Second Estimate, Moving Parts 5-30-24
1Q24 GDP: Looking into the Investment Layers 4-25-24
1Q24: Too Much Drama 4-25-24
4Q23 GDP: Final Cut, Moving Parts 3-28-24
4Q23 GDP: Second Estimate, Moving Parts 2-28-24
GDP and Fixed Investment: Into the Weeds 1-25-24
4Q23 GDP: Strong Run, Next Question is Stamina 1-25-24
Tale of the Tape: Trump vs. Biden 12-4-23
Construction Spending: Timing is Everything 12-1-23
3Q23 GDP: Fab Five 11-29-23
Fixed Investment in GDP: The Capex Journey 10-30-23
GDP 3Q23: Old News or Reset? 10-26-23
Construction: Project Economics Drive Nonresidential 10-2-23
GDP 2Q23: The Magic 2% Handle 7-27-23
1Q23 GDP: Facts Matter 6-29-23