
Footnotes & Flashbacks: Credit Markets 8-12-24
We look at the latest credit market dynamics after some wild price action saw a partial spread retracement following the Friday-Monday VIX chaos.


Can you show me the recession card?
The spread levels and quick stabilization of the markets remind us that a rational transmission mechanism to eroding credit metrics, a broader economic contraction, or even a sustained bout of risk aversion takes more than a quick VIX spike, a weak payroll number, and the persistently weak ISM manufacturing numbers.
HY spreads remain compressed in multicycle context despite the modest repricing while IG spreads are comfortably below the long-term median.
Absolute yield levels in both IG and HY are below long term medians based on a yield curve that remains extremely low by standards of non-ZIRP periods and markets seen before the credit crisis (see Footnotes & Flashbacks: State of Yields 8-11-24).
This week brings an updated CPI print and fresh round of Retail Sales that are justifiably seen as useful focal points while Industrial Production will offer up another data point in an economic multiplier effect sector.

The above chart highlights the swings in the monthly total return performance by the full range of credit tiers and vs. the UST market. In a market with compressed spreads, it is usually the UST curve that can drive some swings in total returns while bouts of adverse risk pricing can take the B and CCC tier to the woodshed as we see in this most recent month.
An interesting aspect of the CCC tier is how it can swing quickly from first to last when markets get nervous during spread waves. The same is true going the other direction when the market calms down. While the CCC annual performance topic is outside this piece, the CCC tier had a long history of almost always being first or last in excess returns on an annual basis across the last few decades. That gets back to the question of time horizons, issuer election and default avoidance. That is a topic for another day.
The wild finish to 2023 saw both bullish views on risk as well as a major UST curve rally. In late cycle markets, those forces are usually in opposition such as what we just experienced this month. The FOMC decisions looming have both inflation and contraction risk in mind. Investors in the lower end of the credit spectrum want inflation to be the main pivot point and not the type of speculative battering we just saw on a simple payroll number in triple digits that was not even the lowest in 2024 (see Payroll July 2024: Ready, Set, Don’t Panic 8-2-24).
Credit investors (especially HY investors) naturally invest with a longer term time horizon than month-to-month and usually longer horizons than year-to-year. Asset allocation often takes into account 3 to 5 year time horizons. Coupon income is a major factor in the portfolio criteria and the power of reinvestment and compounding has always been an important factor in longer term total returns for HY. It is a matter of record that the best time to expand allocations to HY is when chaos reigns, secondary liquidity is thin, and when opportunities price in more than default and recovery risk. This is not that market. We always viewed HY as a core asset allocation positioned between equities and high quality bonds.
With the pull-to-par in refinancing of HY bonds with low coupons from the ZIRP era, credit investors will be on standby for new market-clearing level coupons as HY issuers engage in prudent liability management and get the refi-and-extension process back in gear (see Coupon Climb: Phasing into Reality 12-12-23 ). Many corporate liability managers and their bankers do not want to play debt maturity chicken when cycles can turn fast. The pace of refinancing in the period ahead where FOMC policies might shift to lower rates has to be balanced against the risk of more economic turmoil and risk pricing threats in 2025 (think tariffs, trade wars, mass deportation labor fallout, etc.).
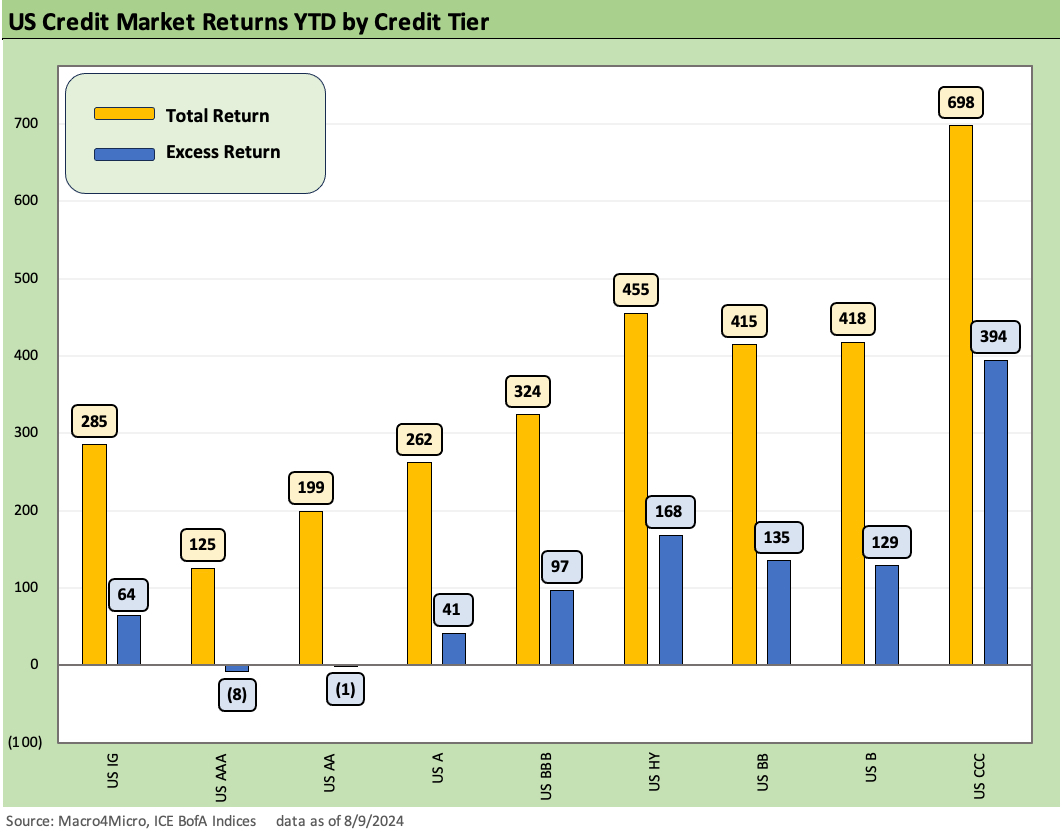
The above chart updates the running YTD total returns and excess returns across the credit tiers. We are now at a stage where duration is winning and credit risk is doing “well enough” based on the excess returns in HY. At least you get paid more for taking credit risk even if we would argue it is not enough. The challenge for HY excess returns is that the risk reward symmetry is still working against HY given the compressed spreads and cyclical clock ticking.
We see policy risks as negative heading into 2025 with some posing material threats (tariffs, retaliation and labor market disruption). The policy risk in tariffs rattled the market even after a major tax reduction bill in Dec 2017. The fallout in 2018 was that risk was eventually pummeled by 4Q18 (with a few 1,000 point drops to start 2018 in Feb) and the Fed eventually rode to the rescue in 2019 (see HY Pain: A 2018 Lookback to Ponder 8-3-24).

The above chart updates the running excess returns for IG vs. HY. We see what the two day smackdown delivered with the Monday close showing the IG YTD excess returns wiped out after the market turmoil of Friday and Monday. On Thursday (8-1-24), the IG YTD excess return was +94 bps YTD but took a dive to -4 bps after the close on Monday (8-5-24). For HY, the excess return YTD was +206 bps as of Thursday (8-1-24), but that plunged to +25 bps by Monday (8-5-24).
The excess return pain gets mitigated by favorable UST price action (in part or in whole) depending on the security, credit tiers, or portfolio duration exposure. That offers a reminder of what damage can be done by a stagflation trend in 2025 with the wrong set of policies for industry risks (e.g., high tariffs and retaliation risk among other economic threats).

The above chart updates the long-term trend line of IG spreads. The time series highlights the spread lows, highs, the long-term median, and various timeline medians. The recent move wider to +105 bps was minor in historical context and below all the timeline medians detailed in the box.
One exception was the bubble years after the 2001 recession that saw a 1H04 to 2H07 period keep average IG spreads overall at high +90s bps handles. The 1997-1998 period also saw average IG spreads come in at +90 bps handle average. Those years were frothy credit markets, and we are only slightly above those markets in spreads now for IG. In other words, the wild 2 days of Friday (8-2-24) and Monday (8-5-24) did not do much damage from a broader top down view.

The above chart does the usual long term timeline exercise for HY, and the current +349 bps as of Friday close is well inside the long term median of +466 bps as noted in the chart. The running median in the post-Feb 2020 period is +397 bps with the very compressed 2021 period included before the tightening cycle. Current HY spreads are just above the par plus HY market of Jan 2020 and the June 2014 lows.

The “HY minus IG OAS” spread differential of +244 bps has compressed again over the week after running to +266 bps on Friday (8-2-24) from +235 bps on Thursday (8-1-24). After the Monday turmoil, the HY-IG quality spread differential gapped out again to +281 bps before rebounding on the week to the above +244 bps. We would highlight even the highs of the Monday (8-5-24) close were comfortably inside the long-term median of +329 bps.

The above chart frames the “BB - BBB OAS” spread differential of +84 bps, which is well inside the long- term median of +136 bps and all the timeline breakouts we include in the chart.
The BB-BBB spread differential had gapped out to a wide of +112 bps at Monday close (8-5-24) from the +80 bps at Thursday close (8-1-24) before retracing most of the differential to Friday’s (8-9-24) +84 bps. The 7-26-24 mark in an earlier edition of our Credit Markets Footnotes shows this differential at +60 bps, so the decompression came quickly. We expect more decompression waves as the election nears and more weight is given to policy differentials and what they might mean for 2025 risk profiles. The cycle is not getting any younger for that matter.

The above chart updates the time series for the BB tier OAS as the largest of the HY tiers and a convergence point between the traditional BBB buyers and the HY investor who looks more to a B tier composite quality benchmark. The +212 bps is a modest journey from the +177 bps (Friday 7-26-24 spreads) that we detailed in a recent Footnotes publication (see Footnotes & Flashbacks: Credit Markets 7-29-24). As noted in the timeline above, the current +212 is only slightly above the lows from some earlier HY credit cycles and inside the June 2014 lows.

The B tier OAS widening posted a +329 bps as of Friday (8-9-24) after a Monday close (8-5-24) of +376 bps. That +376 bps after the sell-off is below all the medians we detail in the box above and the rally to +329 bps to end the week is near the spread lows posted in the chart above for June 2014, Oct 2018, Jan 2020, and Dec 2021. So that is not much damage in the context of the credit cycles. The B tier OAS levels in late May (+238 bps) and early June 2007 were clearly on a different planet. We have looked at these histories in past commentaries (see HY Spreads: Celebrating Tumultuous Times at a Credit Peak 6-13-24).

The above chart updates the time series for IG and HY index yields, and we like to highlight that the relevant yields to use in viewing current yields are those outside the ZIRP, QE, and normalization years. That is the pre-crisis period before the 2008 crisis. That means the 9.3% for HY and 6.1% for IG noted in the box. In that context, IG bonds and HY bonds present low-cost funding for issuers looking back across history as UST rates are low and spreads compressed.
A logical scenario looking out into 2025 is that (in theory) UST rates will be lower and spreads wider. One major challenge is the shape of the UST curve and whether an upward sloping UST curve from 3M UST (as opposed to 2Y to 10Y) is even possible in 2025 and whether market clearing levels out around 10Y can also move lower by 100 bps with so much UST supply ahead. We have doubted that and still doubt it, but we certainly have seen some very low all-in yields in credit and in the UST since the crisis for too many “bad reasons.” One thing that is certain is that refi and extension from ZIRP era bonds will bring higher coupons.

We have been using the above charts for some time now, and we post current IG index yields vs. prior credit cyclical peaks of late 1997 and mid-2007. We plot the index yields on the horizontal line and the actual UST curve from those dates. The low UST yields dominate the comparison in IG even with the lower average quality of the IG credit tiers vs. 1997 and 2007 with such a massive BBB tier. The cost of IG borrowing at a low 5% handle is very low across history despite the tightening cycle.
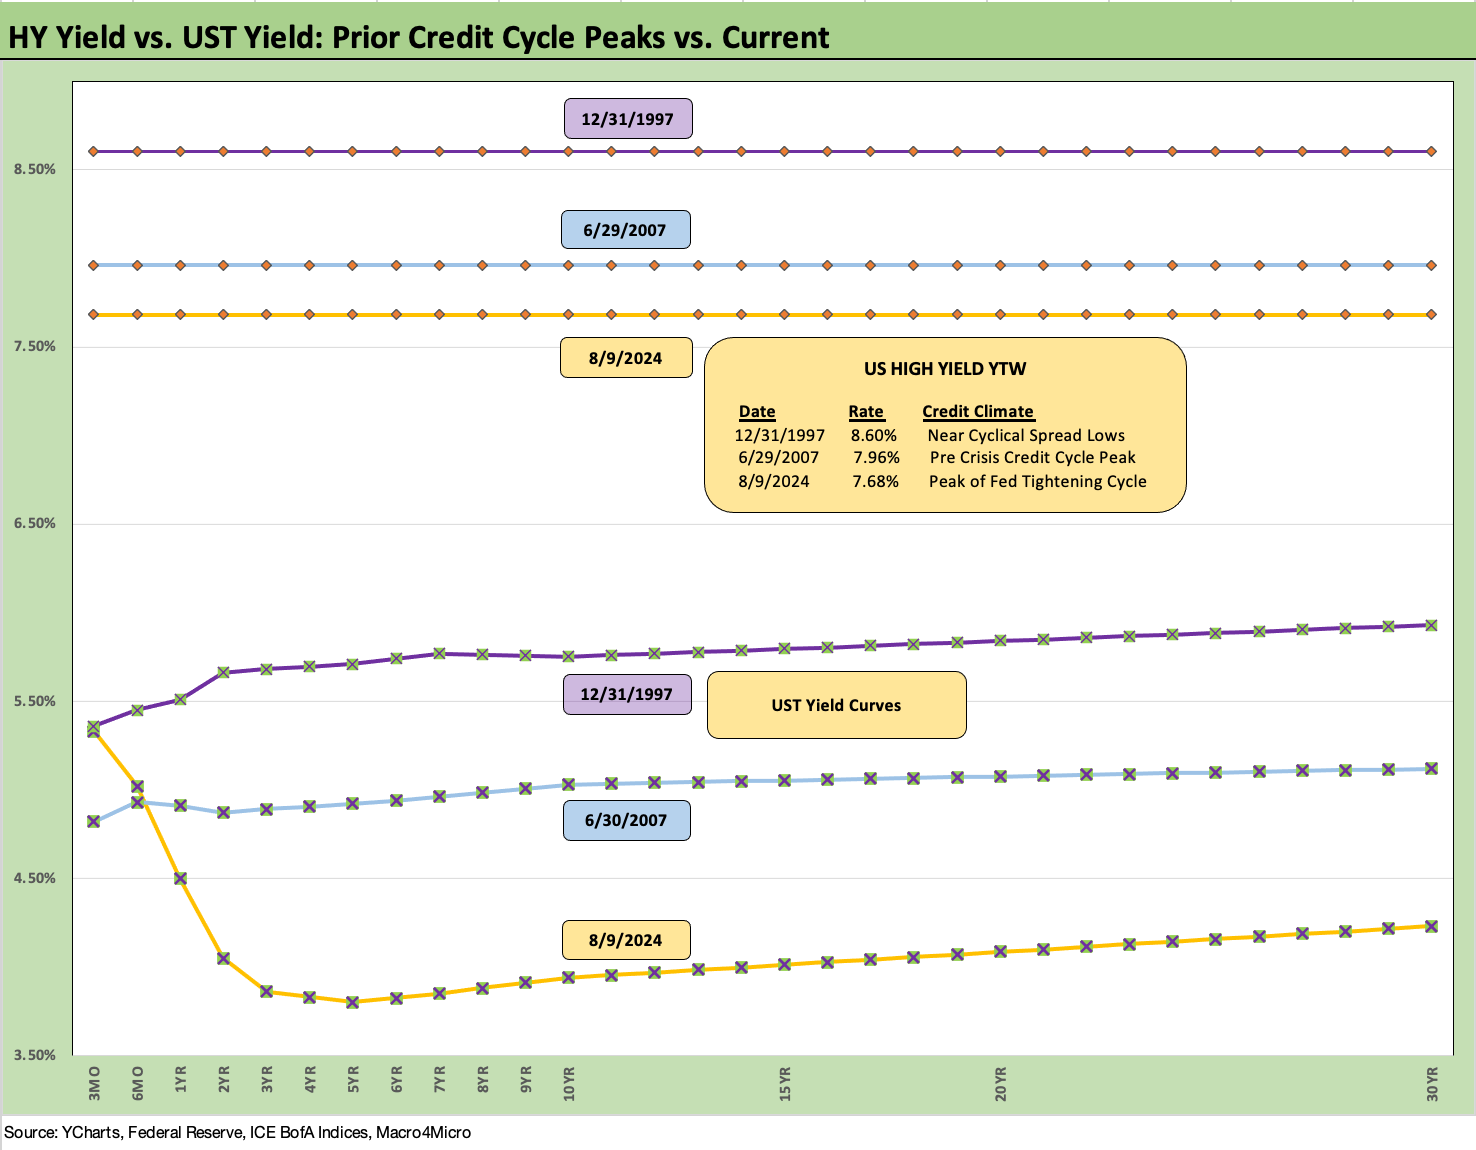
The above chart does the same exercise for HY as we did for IG in the prior chart. The mid-7% yields for HY are below these earlier HY credit cycle peaks in 1997 and 2007. Spreads are still compressed today as we detailed in the earlier OAS chart, but the UST curve is materially lower. As cited earlier, the pre-crisis median of 9.3% for HY YTW is a good distance from the 7.68% at Friday close.
The repricing of coupons and pull-to-par effect on refinancing from the current dollar price of 94 on the HY index (96.5 price for the B tier) will keep investors in the game as HY new issue comes along. There is always an issuer decision to make on spreads, coupon income, and structural risks even beyond the usual credit risk assessment.
The balancing act for those committing capital and planning asset allocation to higher risk credit will have many selection decisions ahead from old school HY bonds to “new school” private credit (a variation on the theme of “old school” insurance private placements where I started my life in credit). This period ahead for the FOMC and election policy differences for trade and tariffs are going to make for a very interesting, challenging, and stressful time (and maybe more than a little toxic).
Contributors:
Glenn Reynolds, CFA glenn@macro4micro.com
Kevin Chun, CFA kevin@macro4micro.com
See also:
Footnotes & Flashbacks: State of Yields 8-11-24
Footnotes & Flashbacks: Asset Returns 8-11-24
HY Industry Mix: Damage Report 8-7-24
Volatility and the VIX Vapors: A Lookback from 1997 8-6-24
Footnotes & Flashbacks: Credit Markets 8-5-24
Footnotes & Flashbacks: State of Yields 8-4-24
Footnotes & Flashbacks: Asset Returns 8-4-24
HY Pain: A 2018 Lookback to Ponder 8-3-24
Payroll July 2024: Ready, Set, Don’t Panic 8-2-24
Employment Cost Index: June 2024 8-1-24
JOLTS June 2024: Countdown to FOMC, Ticking Clock to Mass Deportation 7-30-24
Footnotes & Flashbacks: Credit Markets 7-29-24
Presidential GDP Dance Off: Clinton vs. Trump 7-27-24
Presidential GDP Dance Off: Reagan vs. Trump 7-27-24
2Q24 GDP: Into the Investment Weeds 7-25-24
GDP 2Q24: Banking a Strong Quarter for Election Season 7-25-24
The B vs. CCC Battle: Tough Neighborhood, Rough Players 7-7-24
 |
|