
Footnotes & Flashbacks: Credit Markets 8-19-24
The recent wild ride in credit spreads saw a rally in HY OAS back inside the Jan 2020 and June 2014 lows to close out the week.


Hopefully, this will not become a habit.
The history of HY spreads has had more than its share of volatile moments even in cyclical expansions running alongside strong stock markets during times of Fed policy transition, and the current market is one more example.
The good news for those riding the credit cycle at compressed spreads vs. history is that there have been few signs of major fundamental catalysts for a repricing even if there are some pockets of weakness to identify.
The main economic risks dead ahead include some material shifts in policies on the table ahead of a toxic election and how the market will stabilize in the aftermath.
On the short list of worries, geopolitical risk is a constant in a world more dangerous now than at any point in decades with daily handicapping of a Middle East explosion (Iran) that could very easily change the inflation story and budget/borrowing realities.
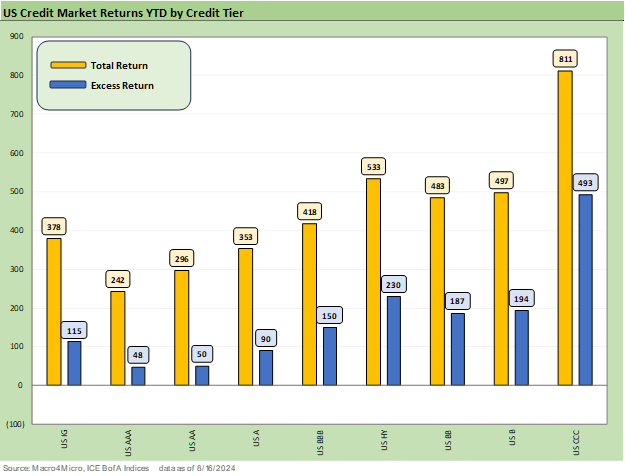
We lead with the usual YTD return profiles across the credit tiers where we look at total returns and excess returns. The total return metrics are improving with the UST delta backdrop for the YTD 2024 period as we detailed in our separate Footnotes publication on yields (see Footnotes & Flashbacks: State of Yields 8-18-24).
Seeing spreads compress at the same time UST yields decline is like corporate bond nirvana, and we are now back to seeing that on a YTD basis after a very strong bout of the same in Nov-Dec 2023. To close out 2023, we saw both months experience material spread contraction after Oct 2023 had gapped wider and rates peaked.
As a frame of reference, the spread widening that the market felt during the VIX spike ended on Monday 8-5-24 at around +393 bps, which was still well inside where Oct 2023 ended (~ +442 bps) before the material compression of Nov-Dec 2023 posted a combined narrowing in the area of ~90 bps.
In other words, swings in HY are fairly routine across cycles even if 1,000 point stock index drops with VIX spikes are rare (see Volatility and the VIX Vapors: A Lookback from 1997 8-6-24). As covered after this latest round, the year 2018 had two 1,000 point drops, a VIX spike, and a massive 4Q18 HY spread widening (see HY Pain: A 2018 Lookback to Ponder 8-3-24). The election and FOMC decisions in the fall will keep more of the same risk hanging around.
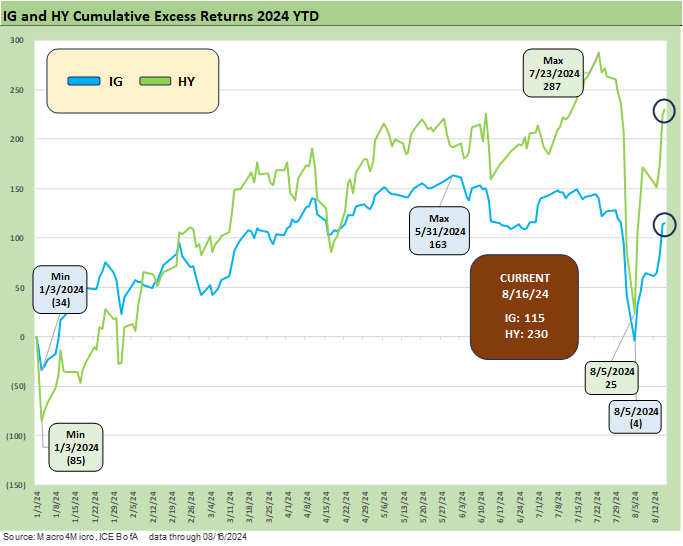
The above chart updates the swing in running excess returns for IG vs. HY with a recent plunge and then a very visible spike. We had detailed the HY OAS moves from Thursday (8-1-24) across the Friday and Monday beatdowns in last week’s Footnotes on credit markets (see Footnotes & Flashbacks: Credit Markets 8-12-24), but this latest week saw a recovery back to +329 bps in HY OAS and inside 100 bps for IG at +98. We look at those pricing gyrations below in the spread section.
For excess returns YTD, the chart shows HY at +230 bps and IG OAS at +115 bps, so those are positioned rationally with investors getting paid more for taking more credit risk. That is often not the case at cyclical turning points.
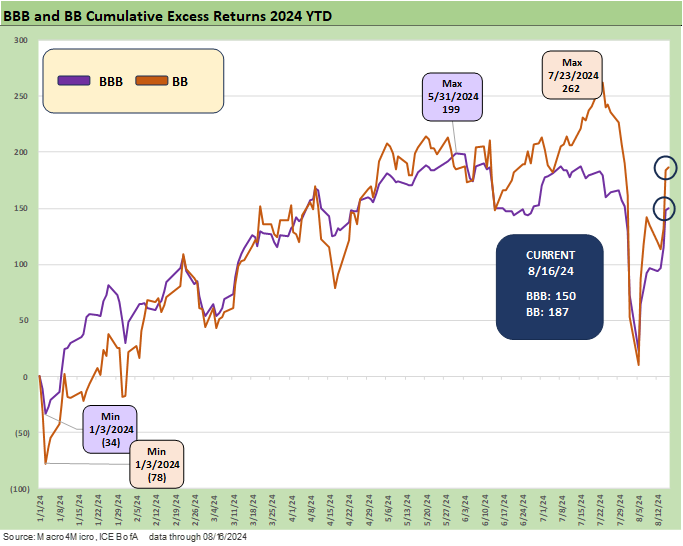
The running excess returns for the BBB tier vs. the BB tier had been converging in a manner that was calling into question the relative value of the BB tier, but the recent bout of volatility has pushed the YTD return of the BB tier (+187 bps) to a more comfortable margin for the BBB tier (+150 bps).
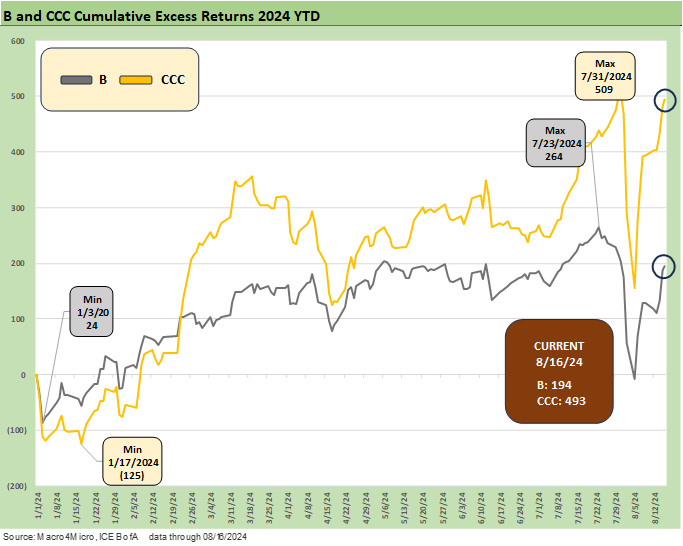
The above chart zeroes in on the comparative excess returns of the B tier vs. CCC tier, and the fact that you are getting more in credit returns for CCCs vs. the B tier is the right trend.
As we have covered in past commentaries, that relative performance can hardly be taken for granted with the CCC tier so often in the negative excess return zone. The fact remains that in the 27 years from 1997 to 2023, the market saw 14 years with positive excess returns for CCCs and 13 years negative (see The B vs. CCC Battle: Tough Neighborhood, Rough Players 7-7-24).
The post-VIX spread rally…
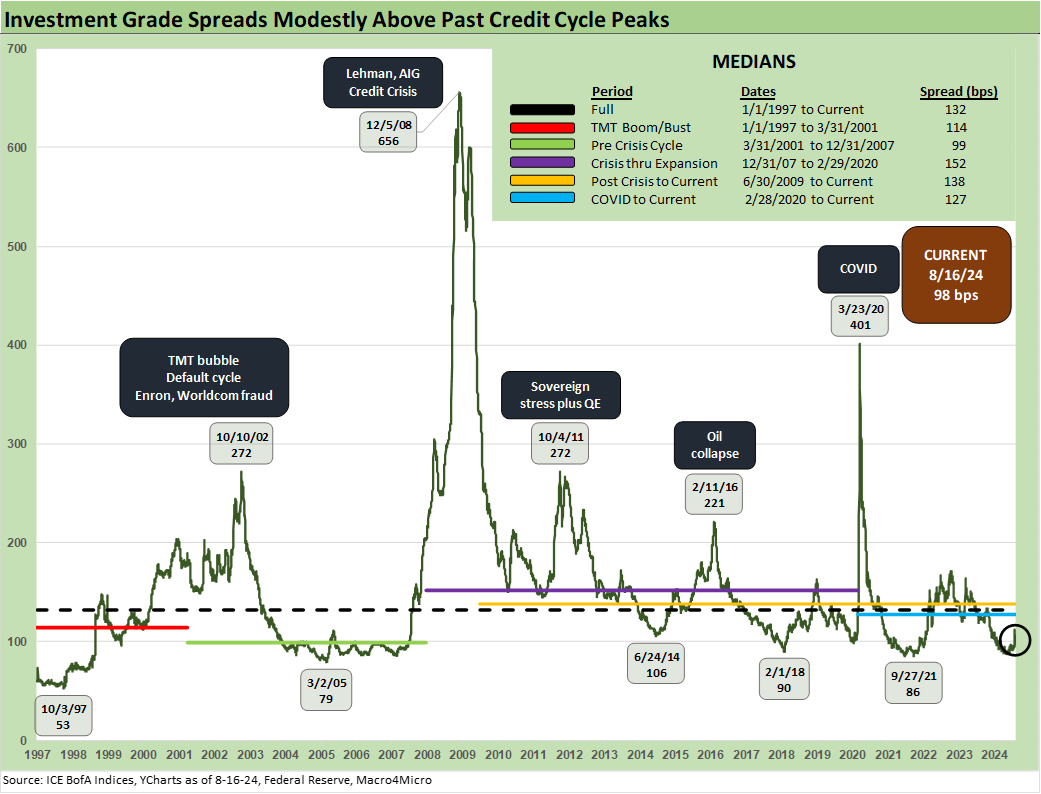
The above chart shows the IG spreads modestly above the 2021 and 2018 lows but inside the June 2014 lows. IG OAS was at +100 bps on Thursday (8-1-24) before the Friday “mini-melt” and hit +112 bps on the Monday (8-5-24) sell-off that saw a 65 intraday VIX level before the IG rally to the recent +98 bps. With a long-term median IG OAS of +132 bps, that was not much of a spread move in that context.
For some historical context, the IG low point for OAS across history was +53 bps in Oct 1997. That +53 bps in Oct 1997 was especially tight and that only edged out to +70 bps to end 1997. The “TMT credit cycle” had legs to stay strong into the 1999 NASDAQ boom as credit stress finally took the helm. By then, Asia and EM broadly had experienced major stress, Russia defaulted, LTCM had hit the headlines, and the Fed eased in 1998 on financial system pressure.
The HY market was especially tight in early June 2007 as detailed in past commentaries, and IG OAS was around +100 bps to end June 2007 or essentially on top of where the market is today. That booming credit period of 1H07 generated IG OAS at an average of+86 bps. The 1H04 to 1H07 credit boom averaged +93 bps. The 1997-1998 average was +95 bps. That makes a statement on current spreads – as in tight – but also underscores that low IG spreads can really last.
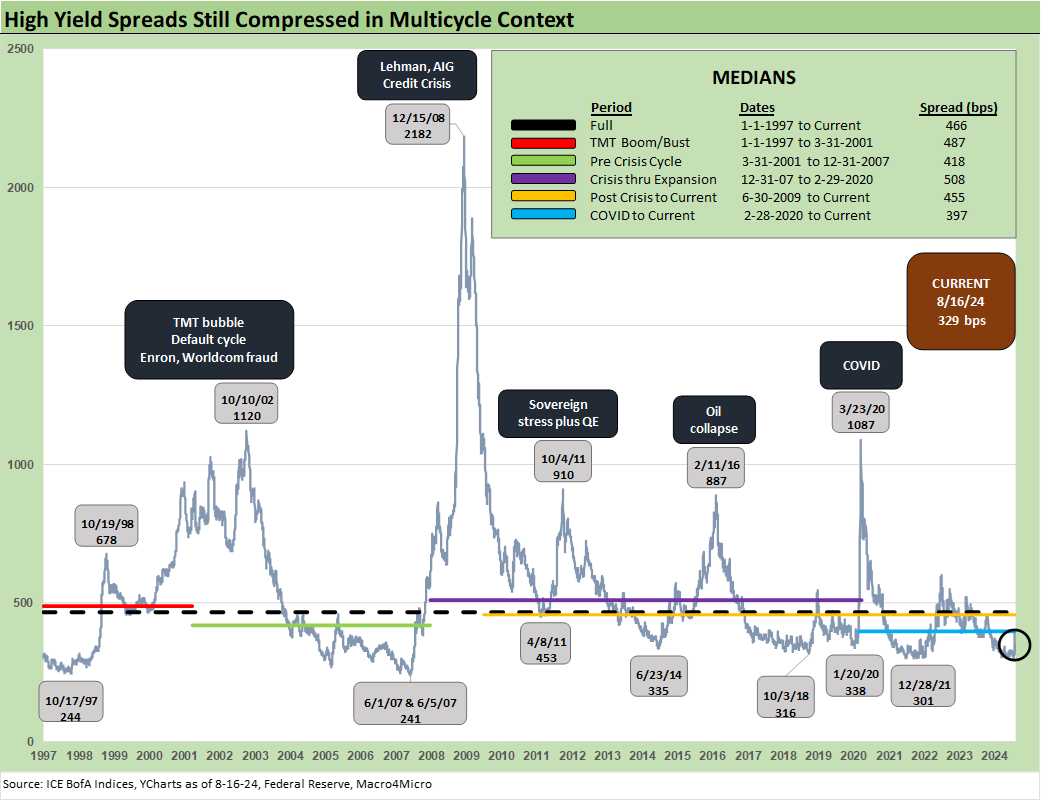
The ride from +335 on Thursday (8-1-24) before the Friday (8-2-24) payroll report and VIX spike and Monday (8-5-24) VIX replay saw HY OAS gap out to +393 bps ahead of the rally that wrapped this past Friday with a close of +329 bps. It is worth highlighting that the peak HY at the end of those two ugly sell-off days to hit +393 bps was still well inside the long term median of +466 bps.
The return to +329 bps puts HY OAS inside the June 2014 lows and a few good days of compression above the Dec 2021 lows noted in the chart (+301 bps) and the Oct 2018 lows of +316 bps. We have looked at some of these earlier HY cycle spread lows in other commentaries (see HY Spreads: Celebrating Tumultuous Times at a Credit Peak 6-13-24).
The market is a long way from the more extreme lows such as those of early June 2007 at +241 bps, but June 2007 ended at +298 bps. We are currently in that neighborhood of where June 2007 ended. In a sign of what sustained spread widening looks like if a lot goes wrong, the year 2007 ended at +592 for a +351 bps move off the June 2007 lows.
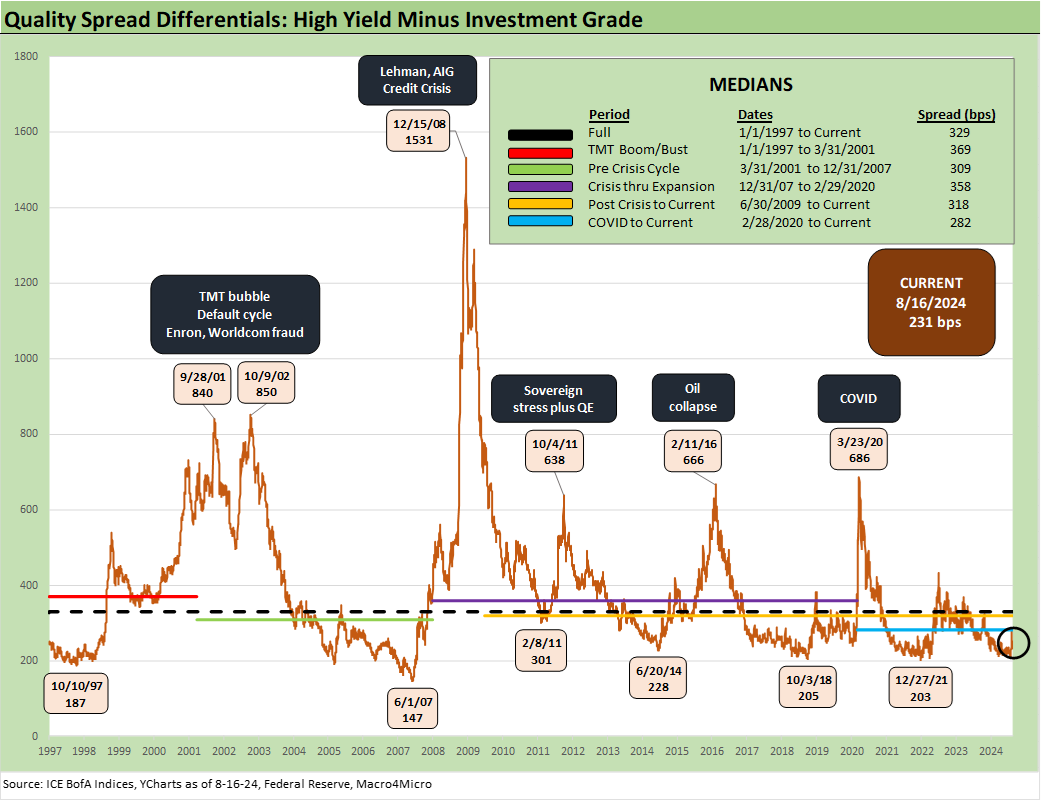
The above chart updates the “HY OAS minus IG OAS” differential for a snapshot of the additional compensation received for stepping down into the HY basket from IG. The current +231 bps is modestly above the lows noted above of Dec 2021 and Oct 2018 but almost on top of June 2014. The long-term median differential of +329 bps is well above the current level by almost 100 bps.
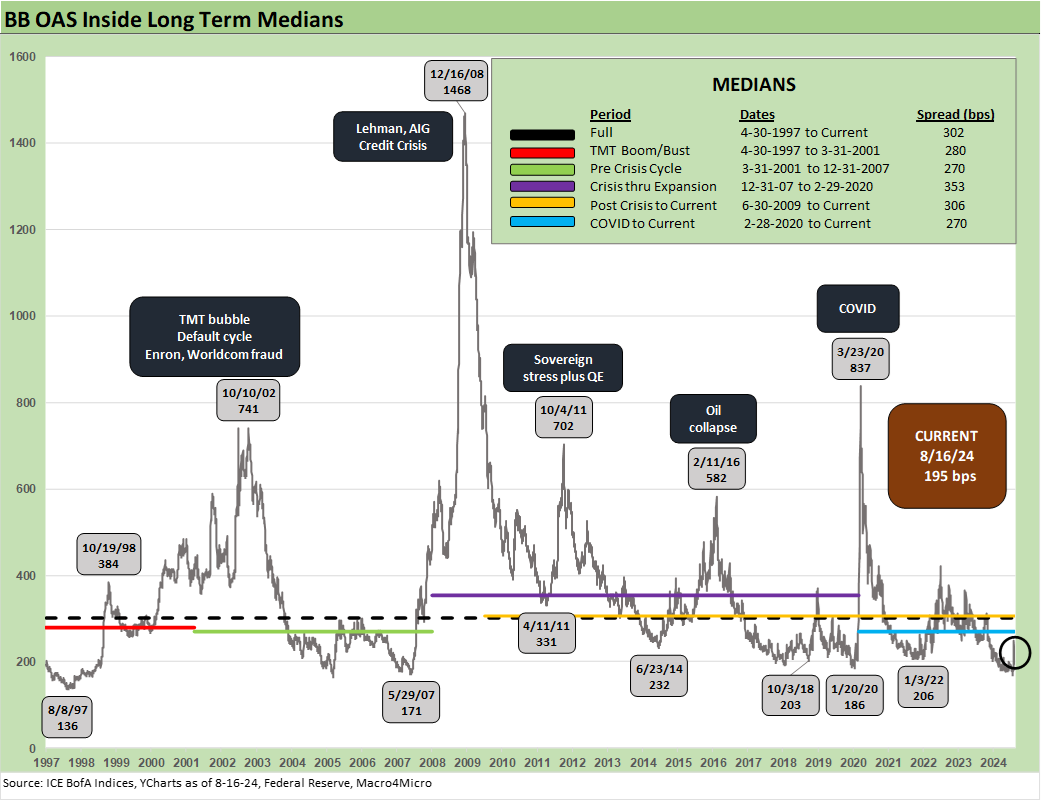
The BB tier rallied from +249 bps on volatility Monday (8-5-24) to +195 bps to end last week. The long-term median for BB OAS is +302 bps, so spread compression remains the theme with the Friday close of +195 bps almost down to the lows of Jan 2020 (+186 bps) and tighter than the lows of Jan 2022, Oct 2018, and June 2014 as noted in the chart.
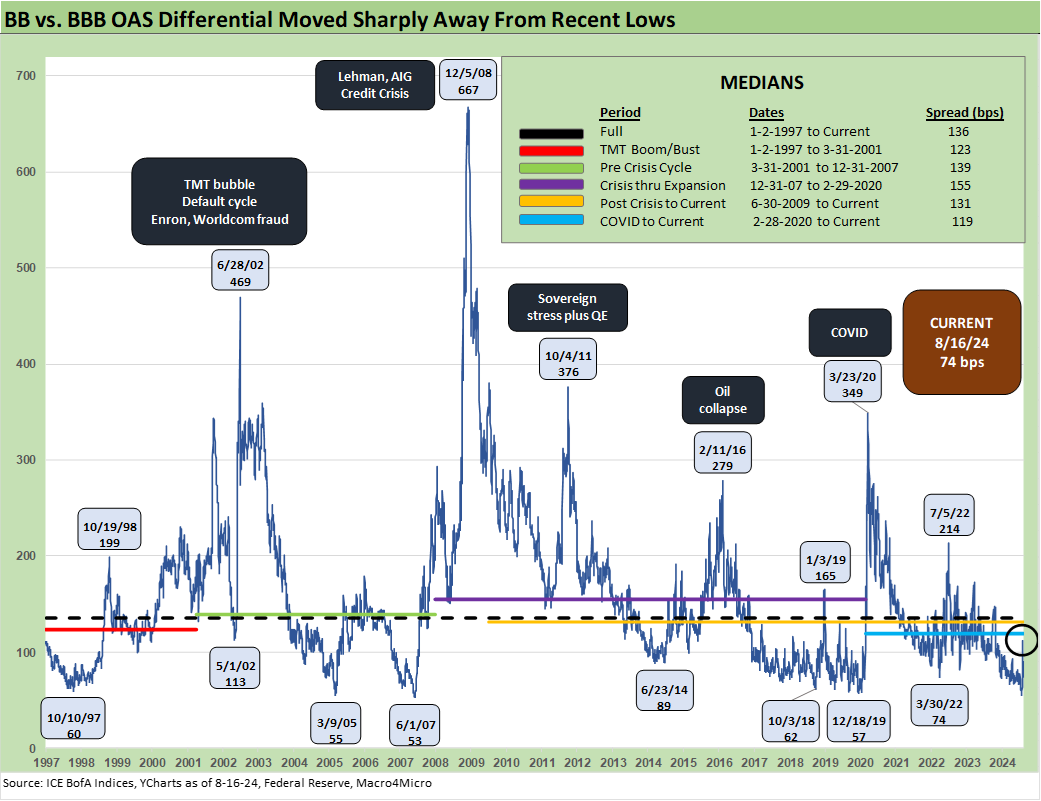
The above “BB OAS minus BBB OAS” differential is shorthand for the spread compression along the speculative grade divide even though it comes with the caveat of being for the full BBB vs. BB tiers and not the narrower gradation of the“BBB3 vs. BB1” composite differential.
The current +74 bps is in the neighborhood of the historical lows but above the +57 bps of Dec 2019, which had been the lowest since +53 bps of early June 2007. The current +74 is tighter than where the differential left off on 8-1-24 at +80 bps just ahead of the Friday 8-2-24 payroll and ensuing market upheaval when the differential rose to +112 bps.
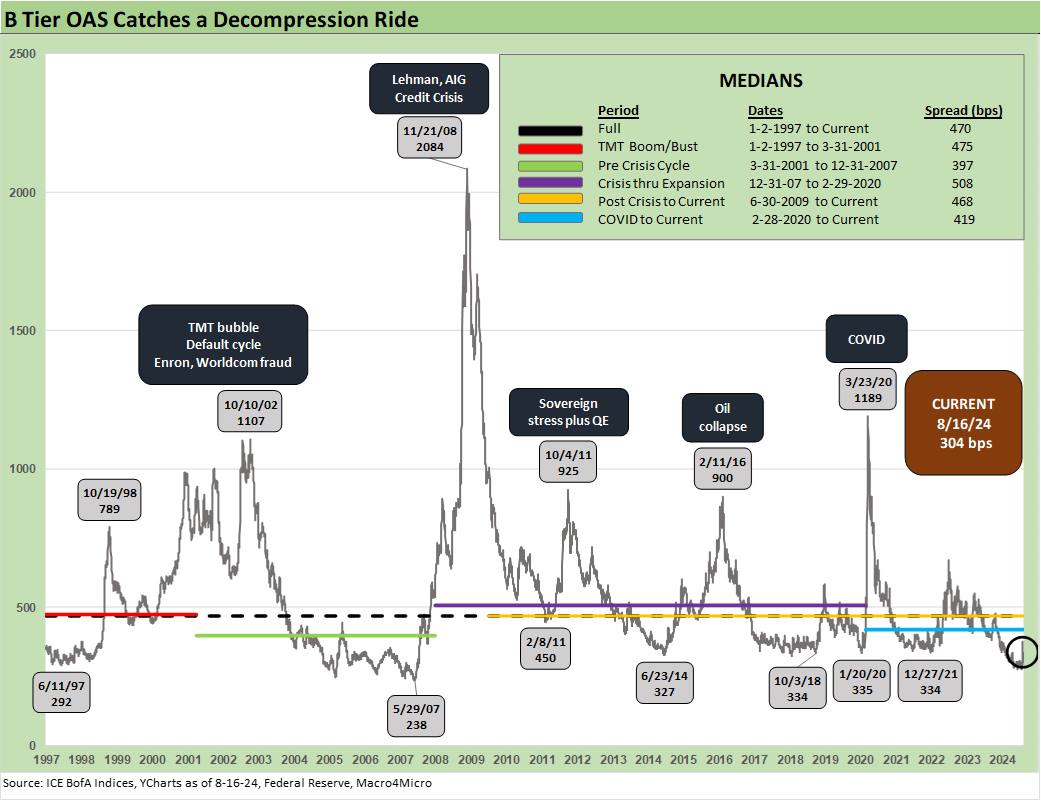
The B tier is the sweet spot of the HY Classic investor and tells a story of compression with the current post-rally level of +304 bps back inside where HY left off on 8-1-24 at +313 bps. That compares to a long-term median of +470 bps and is inside all the lows listed above across 2021, 2020, 2018, and 2014. It is a long way from the May 2007 low of +238 bps.
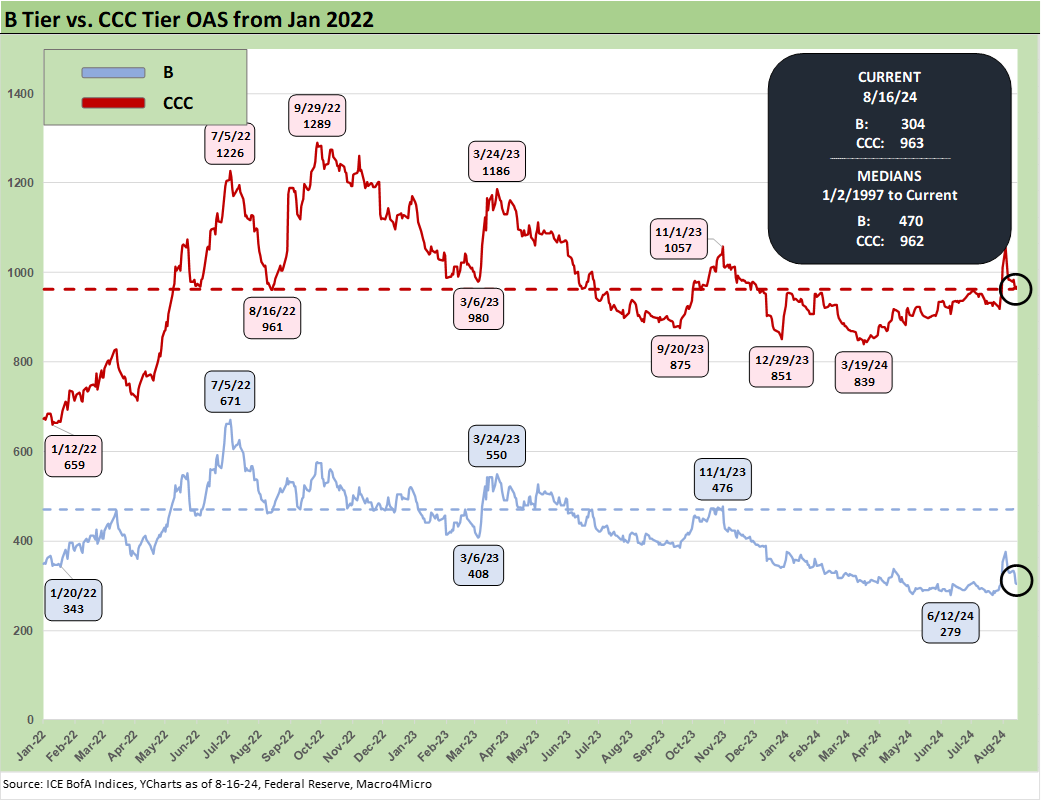
The above chart narrows the timeline on the B and CCC OAS history to zoom in closer on the moves of the middle and bottom tier of HY OAS across the tightening cycle. We see the June 2024 lows of +279 bps before the recent spread wave.
As noted earlier, we already discussed the quirks of the B vs. CCC relationship in a separate commentary (see The B vs. CCC Battle: Tough Neighborhood, Rough Players 7-7-24). An interesting twist is that the CCC tier OAS composite is around the long-term median, but we always add a qualifier to the CCC composite in that the name picking exercise rules and the Hi-Lo dollar price differentials across issuers in the tier are quite wide relative to the B tier. CCCs run the gamut from high credit risk to very high equity-like risk profiles.
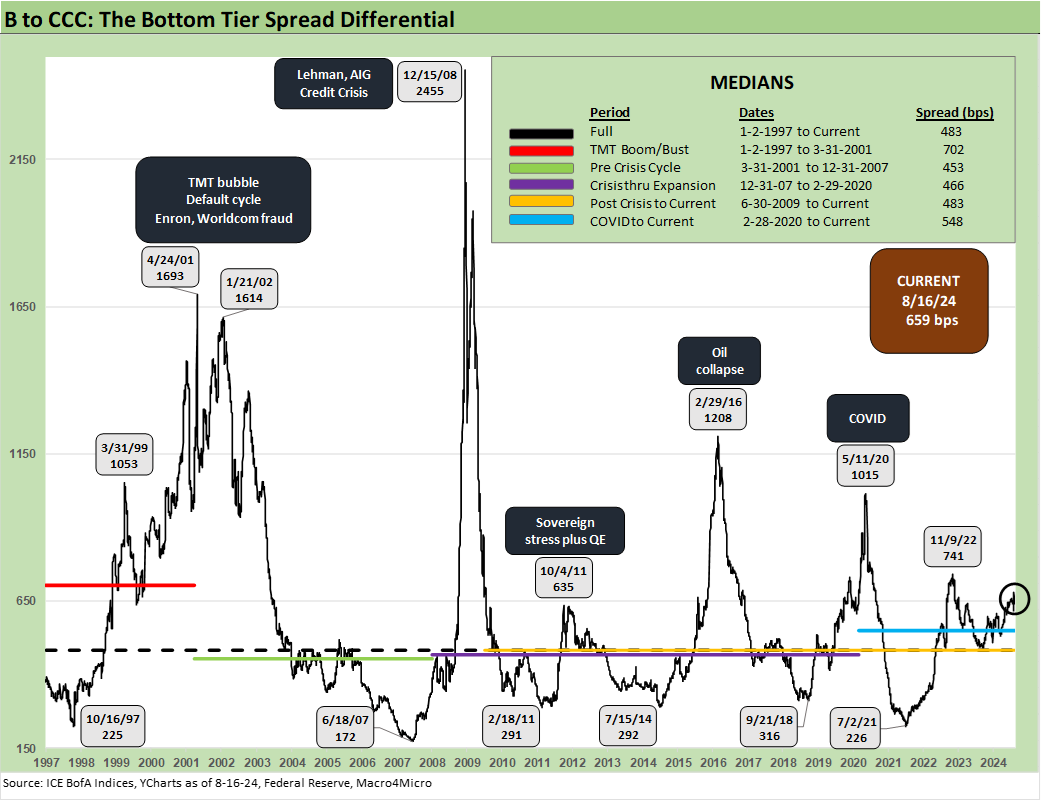
The above chart revisits the history of the “CCC OAS minus B tier OAS” differentials. The worst credit cycle downturns more often shift to dollar price differential considerations from spread differentials very quickly. The CCC tier hit a 42.9 dollar price low in Oct 2001 after the CCC YTW hit 28% in late Sept 2001. The “B minus CCC” dollar price differential soared to 43.5 (Jan 2002), which was wider than the later credit crisis at 31.9 (Feb 2009). That is when many CCC tier names turn into “high risk equities with coupons” with the distressed debt players driving the bus.
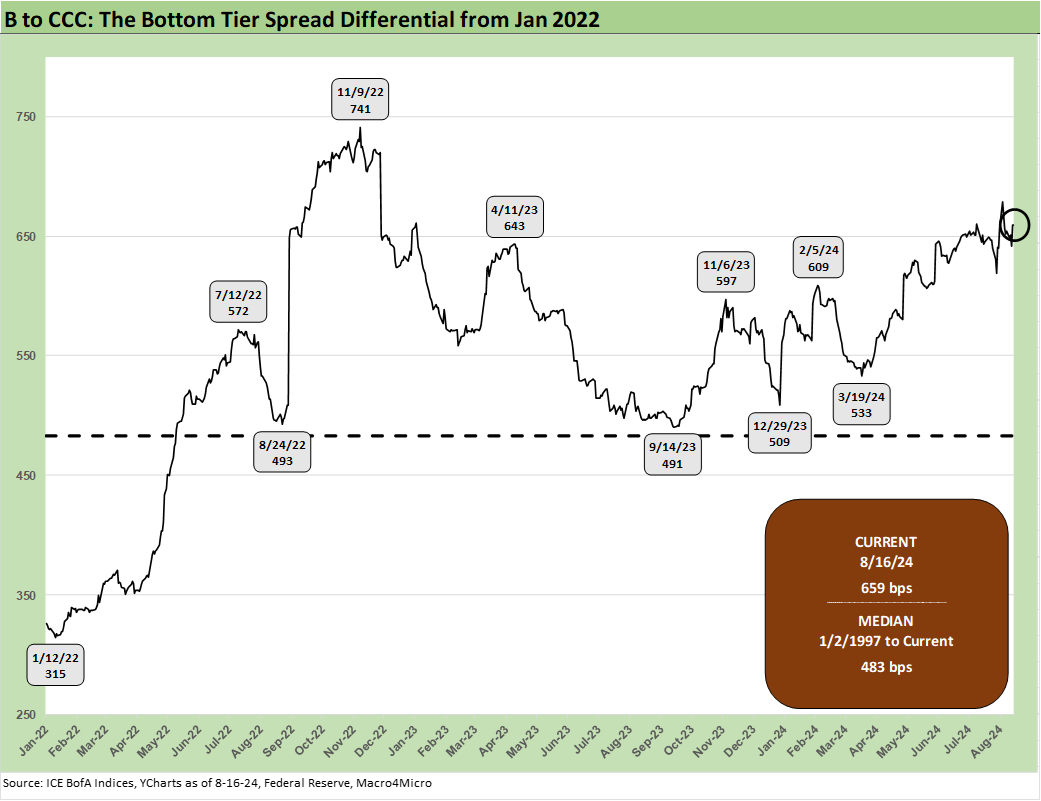
The above chart offers a short timeline and a more granular view on the B vs. CCC tier differentials across the tightening cycle. The beatdown of late 2022 saw a peak ahead of some notable swings, constituent changes, and a material spread compression in the B tier.
Framing credit market yields…
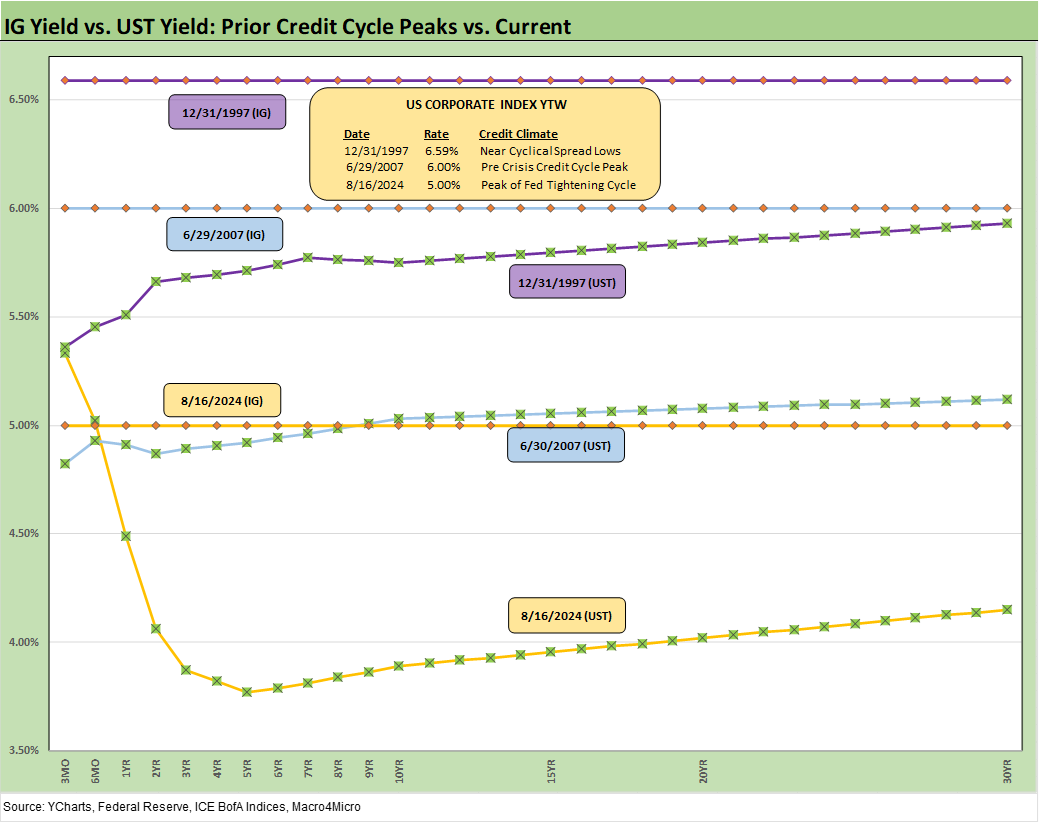
The above chart updates the IG index yields vs. prior credit peaks of late 1997 and mid-2007. We plot those IG index yields on the horizontal lines. We also plot the UST curves for the 3 periods to underscore that the IG yields in this market are dominated by the low UST curve as well as tight spreads.
The scale of the UST inversion is notably out of line with those earlier credit market histories. The all-in yield on IG corporates is below the 3M UST at this point, so you better have a strong duration view on what lies on the other side of the election if you want to extend. That gets caught up in the “Are tariffs inflationary or dilutive?” debate (in our view, that is not much of a debate) and whether a recession lurks.
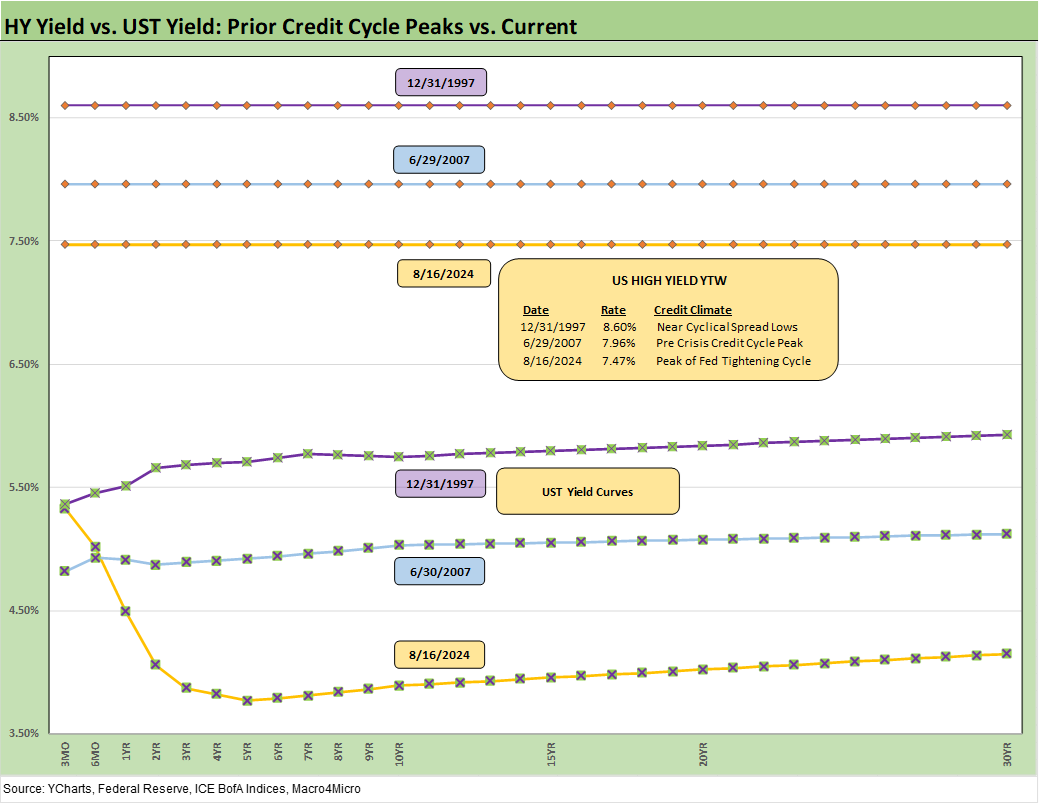
We do the same drill for HY bonds in the above chart as we did for IG and look at the HY index yields on the horizontal lines for the prior 1997 and mid-2007 spread lows. We again replicate the UST curves. The 7.47% all-in HY YTW is well inside the long-term median for US HY (shown in the next chart) of 9.3% that relate to non-ZIRP periods from before the late 2008 move to ZIRP.
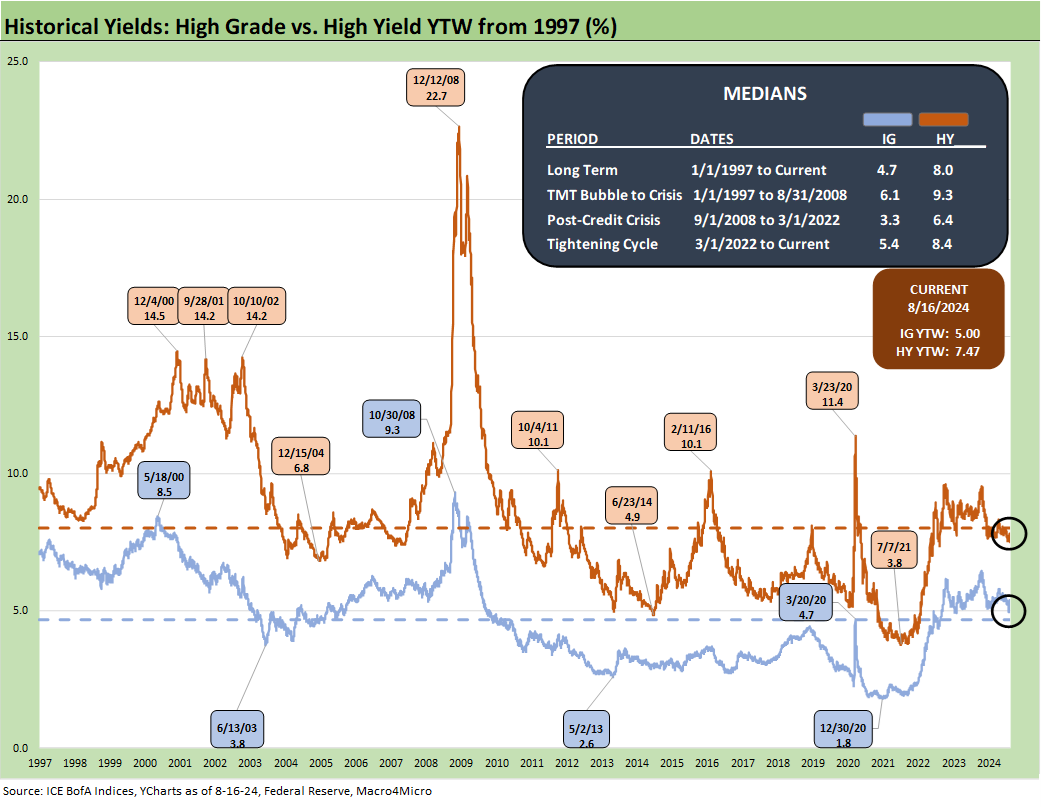
The above chart provides a different angle on the long-term migration of the IG and HY YTW. Now that we are operating in markets outside ZIRP and “normalization” and are coming off a tightening cycle, we see the 6.1% IG median and 9.3% HY medians as the relevant frames of reference.
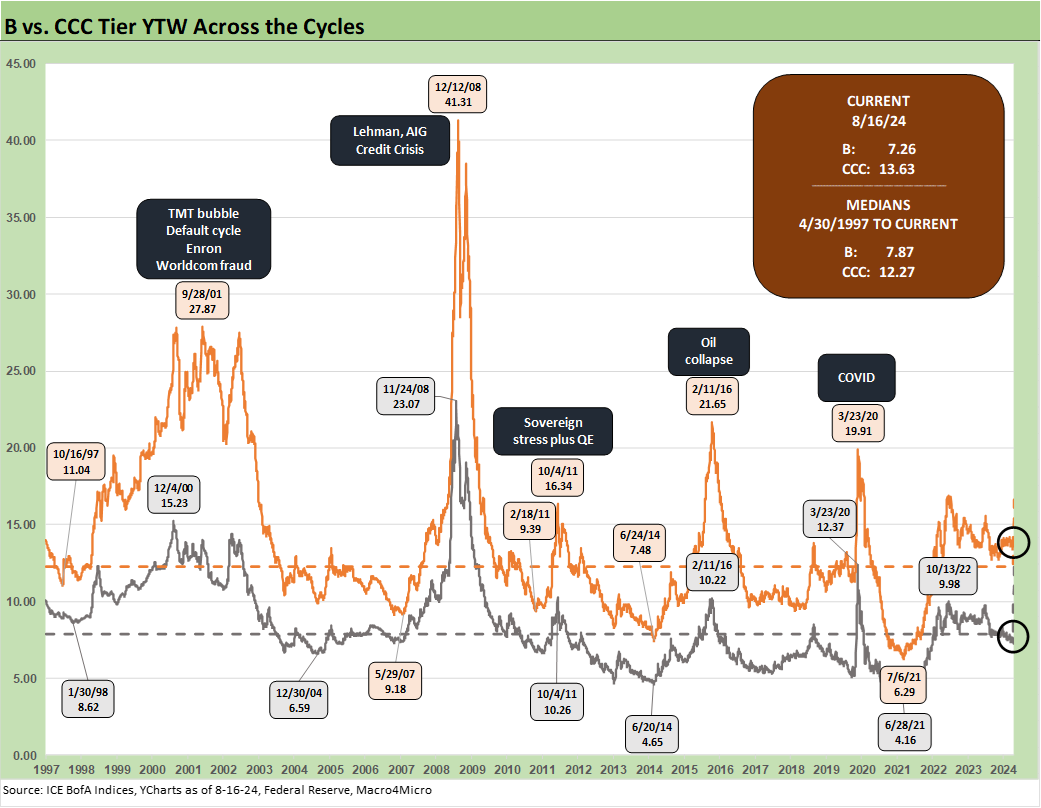
The above chart plots the time series for B and CCC tier YTW. We see the double-digit yields in the B tier and extreme distress in the CCC tier during the post-TMT bubble default cycle that was the longest (not the highest) default cycle in HY market history.
With long-term nominal returns on equities in the area of 10%, the periodic availability of equity-like returns is in evidence across the credit cycles. Making the distinction between what is equity risk vs. credit risk down the HY credit tiers is a big part of the exercise in framing relative value. The market is not in that stage yet at this point in the cycle for the B tier while the CCC tier is about the name-by-name exercise.
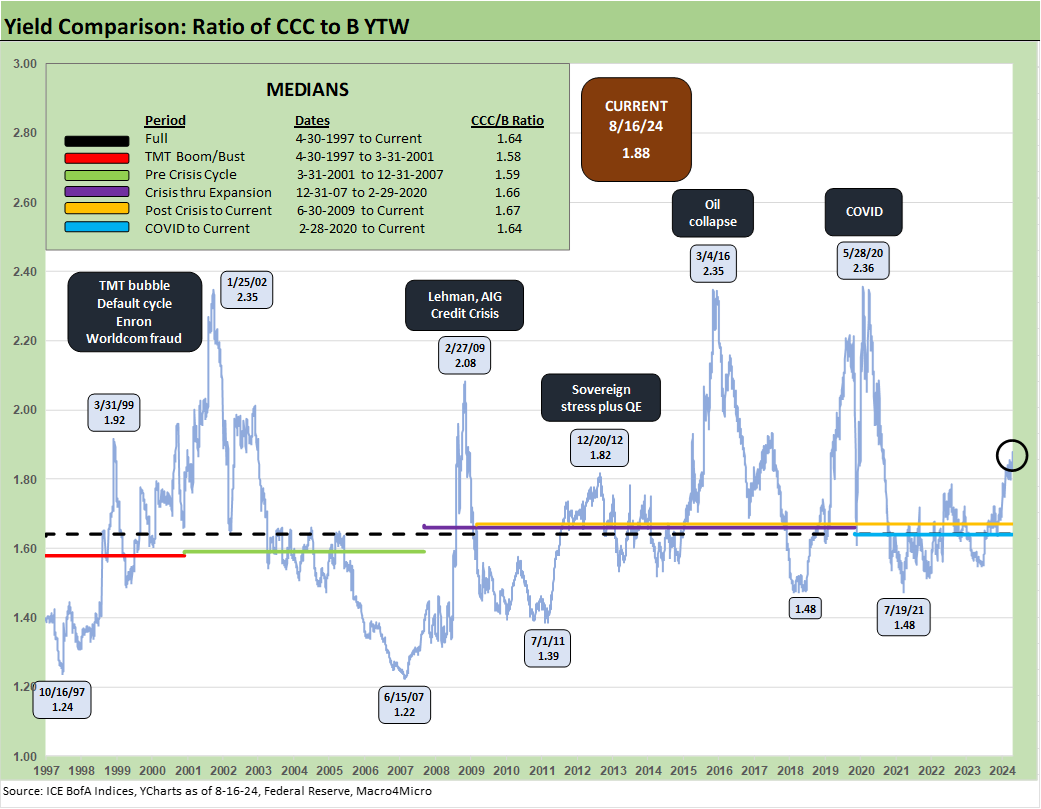
The above chart updates the ratio of YTW for the CCC tier vs. the B tier. We see the medians across the time horizon clustered in a tight range, and the market is now above that 1.6x area with the B tier so compressed. It is just one of a range of relative relationships to stir into the mix.
History says the HY market will be in for a material setback at some point, but it is very hard to find the transmission mechanism to serious fundamental pressures in this market. Those credit quality pressure points can be assumed in a forecast, but they are hard to find on the ground now in aggregate (vs. single names and narrow industries) for credit risk in HY bonds. That is helping HY investors stay the course. As a rule, seasoned HY investors do not scare easily, but retail flows are more volatile.
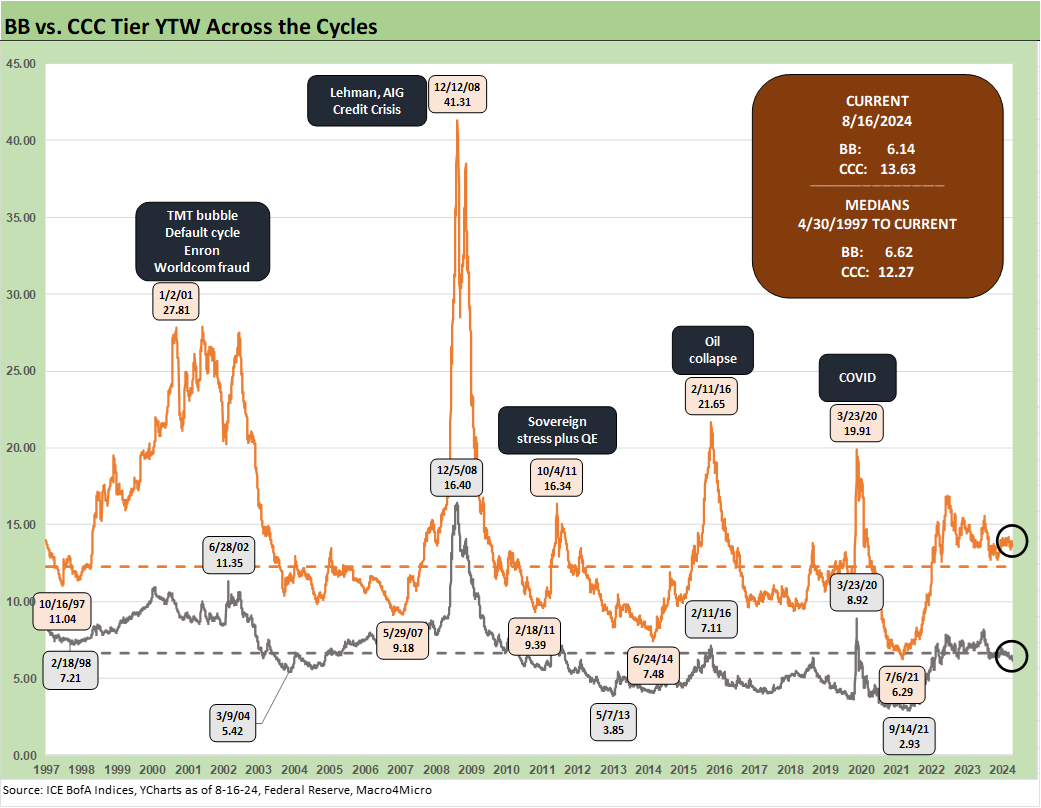
The above chart offers a Hi-Lo time series with the BB vs. CCC tier YTW history. We already looked at the CCC tier in a separate chart, but a look at yield lows in the BB tier is an eye-opener across the cycles. For those who see the phrase “downgrade to junk” in the headlines (and especially those on the equity side of the business), this chart is a reminder that “junk” is very diverse with exponentially higher default risks as you move from the BB to B tier and exponential again as you move from B to CCC.
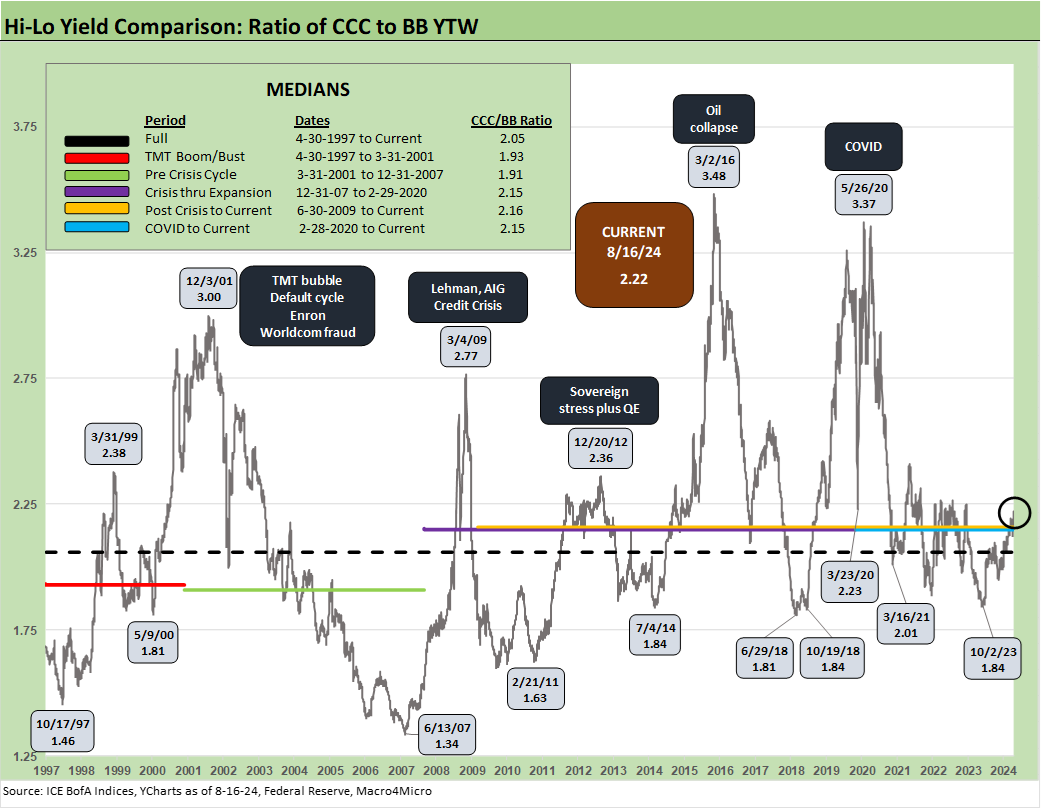
The above chart provides the Hi-Lo YTW ratio for the CCC to BB YTW. The above ratio at 2.22 is reasonably close to the long-term median but closer to the post-crisis periods. As we noted, the very tight spreads in the BB tier are a factor and the steady demand for BBs from traditional BBB tier buyers supports the resilience of BBs.
Contributors:
Glenn Reynolds, CFA - glenn@macro4micro.com
Kevin Chun, CFA - kevin@macro4micro.com
See also:
Footnotes & Flashbacks: State of Yields 8-18-24
Footnotes & Flashbacks: Asset Returns 8-17-24
Housing Starts July 2024: The Working Capital “Prevent Defense” 8-16-24
Retail Sales: Third Wind? 8-15-24
Industrial Production: Capacity Utilization Trends 8-15-24
Total Return Quilt: Annual Lookback to 2008 8-14-24
CPI July 2024: The Fall Campaign Begins 8-14-24
Footnotes & Flashbacks: Credit Markets 8-12-24
Footnotes & Flashbacks: State of Yields 8-11-24
Footnotes & Flashbacks: Asset Returns 8-11-24
HY Industry Mix: Damage Report 8-7-24
Volatility and the VIX Vapors: A Lookback from 1997 8-6-24
Footnotes & Flashbacks: Credit Markets 8-5-24
Footnotes & Flashbacks: State of Yields 8-4-24
Footnotes & Flashbacks: Asset Returns 8-4-24
HY Pain: A 2018 Lookback to Ponder 8-3-24
Payroll July 2024: Ready, Set, Don’t Panic 8-2-24
Employment Cost Index: June 2024 8-1-24
JOLTS June 2024: Countdown to FOMC, Ticking Clock to Mass Deportation 7-30-24
Footnotes & Flashbacks: Credit Markets 7-29-24
Presidential GDP Dance Off: Clinton vs. Trump 7-27-24
Presidential GDP Dance Off: Reagan vs. Trump 7-27-24
2Q24 GDP: Into the Investment Weeds 7-25-24
GDP 2Q24: Banking a Strong Quarter for Election Season 7-25-24
The B vs. CCC Battle: Tough Neighborhood, Rough Players 7-7-24
 |
|