
All the Presidents’ Stocks
We stack the S&P 500 and NASDAQ index prices across the 4-year Trump term against the Biden term to date. It tells a simple story.


Are you telling me he called and asked you to find 7 million votes?
The most bullish markets occur when the economy is doing well or the Fed helps, and the very strong markets under Biden offer evidence in the reality zone vs. the Trump stock markets with more FOMC easing still ahead.
Comparative stock markets across the two administrations offer the Harris campaign some Larry Bird style trash-talking rights, and you know what Trump would be saying if the shoe was on the other foot as he tries to sell a “Kamala crash” after the same pitch on Biden back in 2020.
A lot of different variables come into play in framing equity market performance across the years in terms of Fed policy, bank/broker behavior (excess credit and bad lending/underwriting), commodities prices (oil embargo in 1973, Iran in 1979, etc.), geopolitics (Gulf War fear in 1990 triggers recession), and periodic asset bubbles that inevitably will burst (oil, commercial real estate, TMT, housing, etc.).
In the end, there are always a lot more factors at work than the White House resident that drive the stock market, and the key drivers are usually outside Executive Branch influence. That said, stock markets are still a topic that some Presidents fixate on more than ever (and that can come back to haunt them).
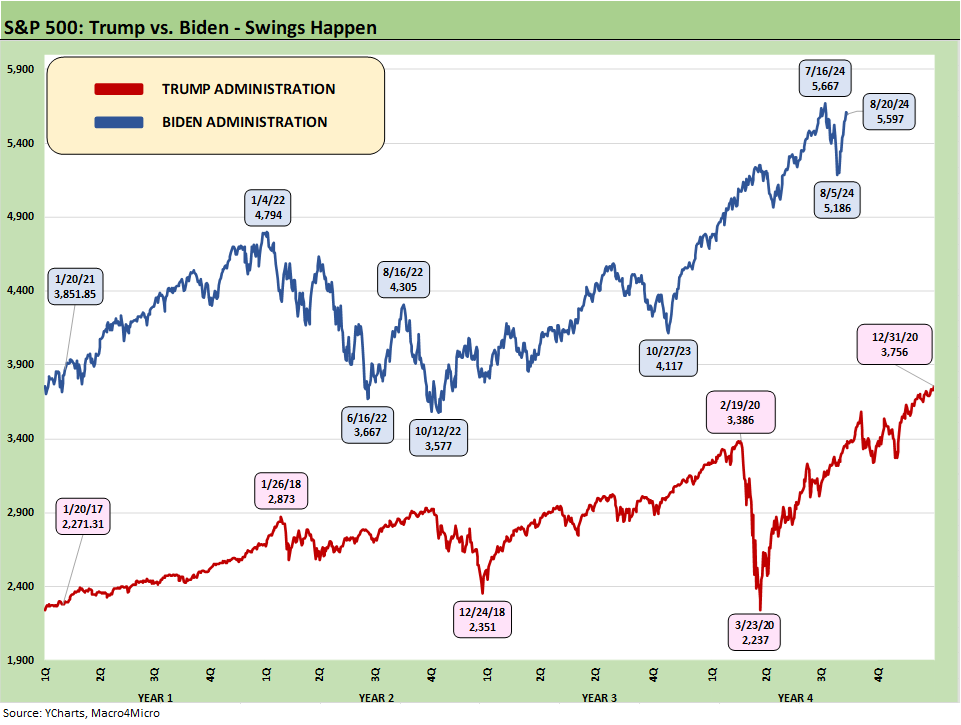
The above dual line chart plots the S&P 500 index values for the timelines across the single Trump term and then separately for what will be the single Biden term through the 8-20-24 close. We line the two index price histories up along two different lines rather than one single “up and to the right” line. The stacked lines are a reminder that Trump has a hard time making his S&P 500 prices look like the “economic miracle” he speaks of so often as well as his “greatest economy in the history of the world” mantra. After all, his S&P 500 line was mostly below the lowest points of the 2022 sell-off during the tightening cycle until late 2020 Trump markets. This chart is not one that will show up on Fox any time soon.
Basically, the Biden stock market crushed the Trump years, and it is a very simple visual to confirm that in the time series above. Trump finished out his final year with over 9 months of ZIRP after a series of 3 fed funds cuts in 2019 even before COVID. Then came ZIRP and a replay of more than a few Fed market support mechanisms, some with origins in the credit crisis. Then Biden took the baton in an easy money ZIRP backdrop in 2021 that also came with rebounding demand.
Trump loved his stock market bragging rights, and the chart above tells an objective story that shows the Biden S&P 500 (and NASDAQ composite in the following chart) running well above his predecessor. Trump will not see it as an outperformance of course. Trump could strike out with the bases loaded in the World Series and his brain would remember it as a grand slam, but the visual above tells a simple story.
The “all-time high stocks” headline was a mainstay of the Trump sales pitch until he saw Biden’s equity market trends. His new pitch is the Biden stock market was rocking since Trump was well ahead in the polls. I guess that means 2021 hit so many records because Trump lost? Or was that forward-looking optimism for the return of The Donald? Logic is not a big part of political dialogue.
Presidents come and go, but the economy and companies roll on…
The phrase “up and to the right” exists for a reason. After all, each President since the 1980s bull market in fact reach new highs on the S&P 500 at some point in their administration. The same is true in the post-TMT, post-2000 downturn and the chaos of 2001.
Nominal GDP doubled in the 1980s. It was a beautiful thing, but a stock market crash, oil patch crash, thrift crisis, commercial real estate bubble, and multiple securities firm failures and bailouts also happened. Oh, and some guy named Trump logged a lot of billable hours with bankruptcy lawyers. Then the 90s brought the longest expansion in history to that point, and record stock markets that ended the decade with a balanced budget.
Despite a post-2000 slow growth trend line for the broader economy and multiple equity market beatdowns (tech bubble, credit crisis), each President since 2000 saw their share of highs with Trump and Biden posting more record highs than Bush and Obama.
Bush took the mantle in the TMT crash and Obama was handed a credit crisis. As we look back from Carter to Biden, only Clinton and Biden got through without a recession touching their term. Carter ended with one. Reagan inherited one, George HW Bush ran into one, George W had one early and one late, Obama inherited one, and Trump was hit with the COVID downturn.
After Bill Clinton’s two terms closed out in 2000, the two bull market decades anchored by Clinton and Ronald Reagan set a bar for economic growth that no one since has come close to. That said, George HW Bush also hit record highs in the S&P 500 between those two but had a rough exit. That might take some of the bragging rights out of the term “record high” when everyone gets them. The wildcard then becomes “disaster avoidance” and hitting more all-time highs across more years early and late in the term.
We have been around a little too long to extrapolate the Biden outperformance of Trump’s equity markets into something about how the White House resident serves as the main driver of the stock market price action. Different Presidents get different cards dealt to them around the state of the economy and the economic health checklist at inauguration.
Ronald Reagan inherited a double dip recession but later oversaw a fantastic bull market and presided over an economy that makes Trump’s “greatest economy ever” nonsense look absurd (see Presidential GDP Dance Off: Reagan vs. Trump 7-27-24). Reagan had a booming economy in his second term, but even that one had a stock market crash. The Clinton stock market also had two terms of bull markets, and his economic numbers dwarf Trump’s economy even more than Reagan’s (see Presidential GDP Dance Off: Clinton vs. Trump 7-27-24).
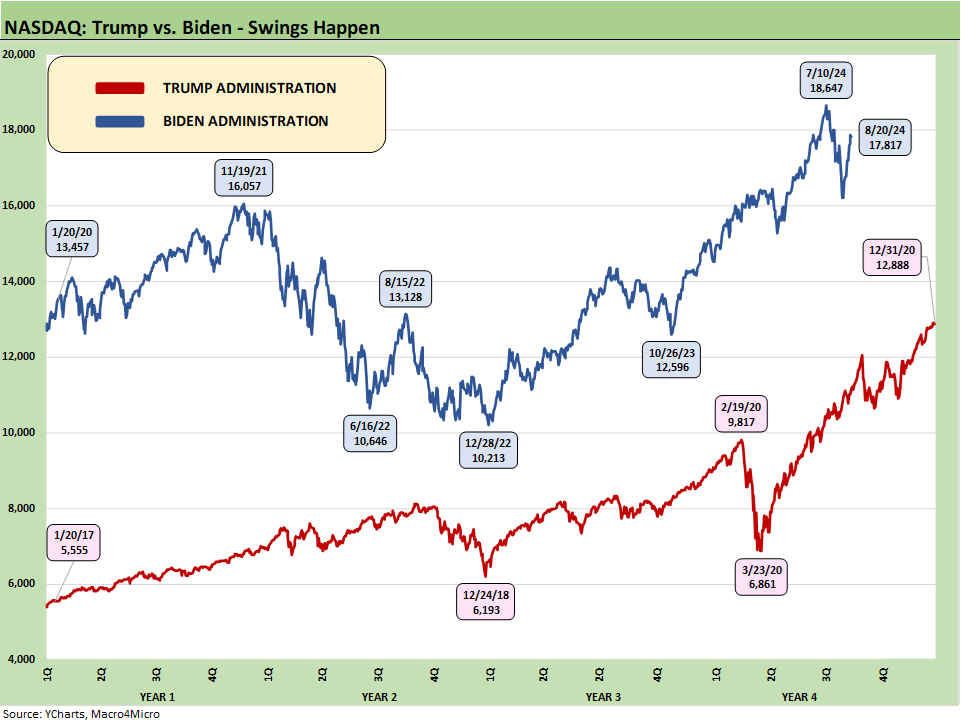
The above chart does the same exercise for the NASDAQ composite, and the result is the same but with more pain inflicted on this tech-centric benchmark during 2022. We saw an even bigger bounce-back to all-time highs on the back of growth stocks broadly and Magnificent 7 names especially.
The NASDAQ has led more years than any other asset class since the late 2008 crisis peak (see Total Return Quilt: Annual Lookback to 2008 8-14-24), and tech has always been the competitive and comparative advantage of the US in the global economy. Low cost, efficient global supply chains were also a strength of the US in corporate profitability but that has now become a critical focal point (e.g., chips) as the government is now thinking of that global supply chain as a security risk. Supplier chains by definition are fragile and framed as a domestic political and geopolitical liability these days.
That global supplier chain risk makes for a thickening plot in the area of “industrial policy” that as a concept used to be anathema to small government conservatives. Now the industrial policy complexity is being simplified to “Tariff Man” saber rattling that will backfire. Protectionism has generally been embraced by both party leaders to this point (even if with very different styles of delivery on the topic). Escalating such policies could make the charts above look very different in 2025.
When in doubt, spin…but fact avoidance is just wrong…
Much of politics is about marketing and spinning, but the fact is that the resilience and growth of the US economy and its impressive diversity has been very much in evidence under both Trump and Biden. Only one of those – Trump – is running on the “carnage” theme. It only works if you can get enough people to sign onto the “fact denial covenant.” There are many angry, hateful, ignorant, fearful, and frustrated people in the world, and the US is the third most populated on the planet. So do the math. Running a fact free and lie-heavy campaign thus has reasonable odds, but it cannot be a cornerstone that is not fact checked and challenged real time.
In the end, the stock market is more a symptom than a cause, and top-line and bottom-line earnings growth, an expanded asset base, near record payroll counts, favorable demographic demand trends, and better corporate execution in meeting new challenges is a “cause.” That makes the “fear and loathing” sales pitch a tough sell when it comes to the economy. The stock market does offer an objective reflection of at least part of the reality.
Similarly, inflation is a fact, and you cannot just hang much of it on price gouging as a theme. Rising corporate profitability also has brought record payroll additions and rising fixed investment with rising real wages now showing up. The strength of many US companies has brought record union wage and benefit deals and a lot more. US corporate profitability was materially rising with low inflation, high inflation, and now again with materially lower inflation.
Simplifying that inflation story is more a deflection of blame, but much of the scapegoating was misleading and simplistic in the first place. Fighting fire with fire is understandable for political themes (the term “Wall Street” is the ultimate deflection game) but simplifying complex risks like inflation can backfire. Taxing corporation seems more rational and intelligently analytical than trying to blame entire industries for inflation.
There is always a lot wrong in an economy, but a lot more going right. A healthy bank system helps and a rapid decline in inflation eases some of the worst risk factors as does slowly rising real wages. More tariffs would screw up that progress and too many taxes would also. We always get back to the fact that the current interest rate backdrop is materially lower than what was seen in pre-crisis, pre-ZIRP economic cycles (see Footnotes & Flashbacks: State of Yields 8-18-24). This is a good start for the next stage of policy actions.
The home stretch on election and policy handicapping is upon us.
See also:
Footnotes & Flashbacks: Credit Markets 8-19-24
Footnotes & Flashbacks: State of Yields 8-18-24
Footnotes & Flashbacks: Asset Returns 8-17-24
Total Return Quilt: Annual Lookback to 2008 8-14-24
CPI July 2024: The Fall Campaign Begins 8-14-24
Footnotes & Flashbacks: Credit Markets 8-12-24
HY Industry Mix: Damage Report 8-7-24
Volatility and the VIX Vapors: A Lookback from 1997 8-6-24
HY Pain: A 2018 Lookback to Ponder 8-3-24
Payroll July 2024: Ready, Set, Don’t Panic 8-2-24