Housing Starts May 2024: Starts vs. Deliveries Balancing Act
We look at Starts/Permits for May 2024 with the choice of “working capital management” or “backpedal.”
May shows some retrenchment on the housing starts side as the industry shows the right discipline in peak selling season after a lot of spec building along the path from “under construction” to “completed” homes.
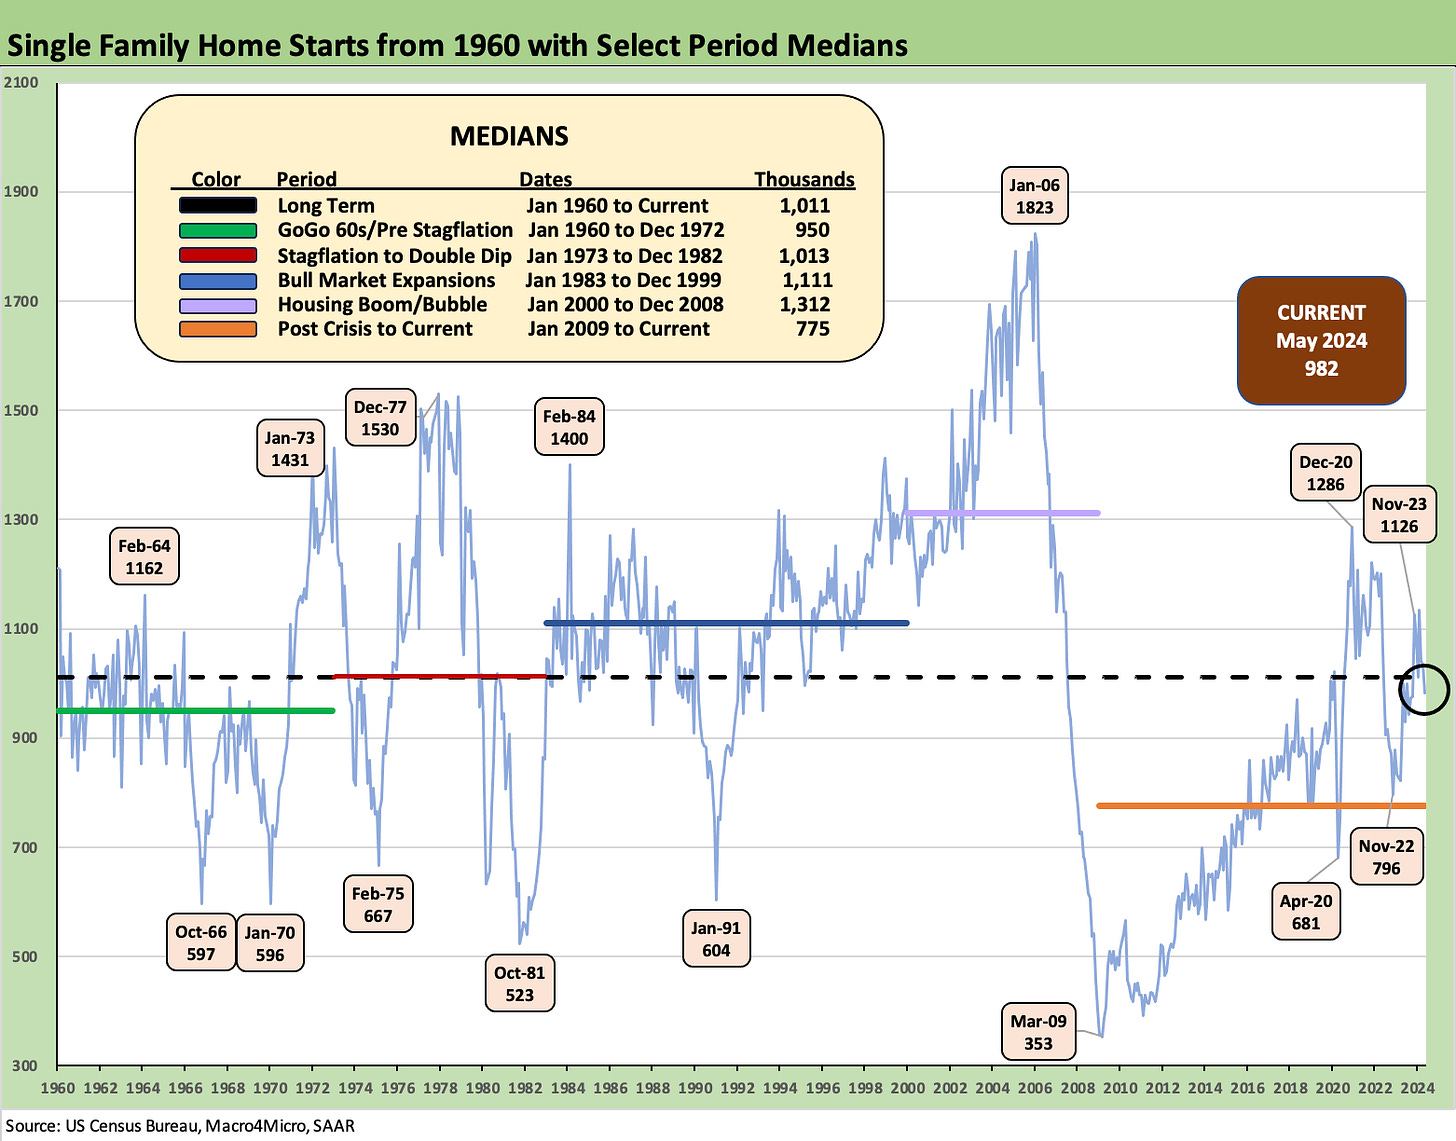
Starts for single family are down moderately at -5.2% sequentially and -1.7% YoY with 3 out of 4 regions down YoY but the West up by +16.9%. The critical South region is down -4.4% sequentially and -3.5% YoY.
Multifamily starts are dramatically lower at -51.7% YoY and down sequentially by -10.3% with units under construction slowly trailing off at -1.5% sequentially and -8.6% YoY. Multifamily completions are down by -7.2% sequentially but essentially flat YoY.
The overall picture in single family still strikes us as a function of prudent working capital management as the builders look to balance deliveries with starts. The backdrop includes a high mix of spec building by traditional build-to-order homebuilders who needed to shift their approach to meet the erratic mortgage rate movements in this cycle.
The above chart updates the long-term single family starts run rate across the cycles. The May 2024 numbers dipped back below the long-term median but are still running above the medians from the credit crisis through current times. We see most of the weakness as prudent working capital on the single family side and a sustained backpedal in multifamily.
As reiterated by Lennar on its earnings call this week, the builders look to strike a healthy balance between deliveries and starts with LEN a useful example as the #2 builder (see Lennar: Key Metrics Still Tell a Positive Macro Story 6-20-24). The inventory balancing act for builders cuts across contracted homes and spec building (completed or under construction) as the builders need to juggle the balance with existing home sales inventory and the stubbornly high mortgage rates this year.
The major builders have been very creative around the deployment of incentive strategies but not all builders are created equal in their ability to tap into captive mortgage operations. That means price cuts have been unfolding more frequently in some markets. Price cuts and fewer starts in a midyear market well into the peak selling season is a challenge that can be navigated, but the strong growth on the residential line of GDP is in for some slower times.
The above chart plots the path of starts vs. permits in total and for single family using “not seasonally adjusted” (NSA) data to get closer to the builder trenches. We see total permits and single family permits moving sideways MoM while starts moved lower in both. Single family permits were slightly higher YoY NSA as well as SAAR.
The big YoY move on an NSA basis was in multifamily in both permits and starts. Multifamily permits on an NSA are down by -27.3% YTD. The YoY SAAR Permits for May 2024 was -31.4%.
The above chart updates the single family starts by region on an NSA basis. We see small moves biased lower NSA but not enough to call a slowdown until we see how much inventory gets cleaned up in total sales across existing and new homes. The good news is that the industry is showing discipline in its starts vs. deliveries. Liquidation of inventory generates cash flow for buybacks and debt reduction.
The idea is that “maybe next year mortgage rates will decline for the peak building season” and that shifts the equation toward better affordability. Then the half empty crowd can hype an inventory-driven home price collapse scenario. The reality of very high pent-up demand remains a fact of life. Rates move the needle faster than price.
A low 6% or high 5% mortgage rate backdrop would be great news. The questions of course are tiered from macro to micro. Why did rates decline? Was it tied to a macro body slam? What do election outcomes hold for policy? Political unrest? (Knights Templar storm the Capitol wearing red ties and then sack the White House? Constitutional crisis? Etc.)
This will be one of the stranger election cycles for the consumers and households and their confidence level. Half the country is typically disappointed. This year promises to upgrade “disappointed” to “ragingly pissed off” regardless of facts. Not a healthy state of affairs.
The above chart updates the multifamily starts time series, and we see the YoY plunge continuing at -51.7% to 278K, lower than all the medians noted in the box. Multifamily units under construction are at a low over the LTM period while multifamily completions are the lowest since Nov 2023 on a SAAR basis but ticked higher on an NSA basis.
The above chart updates the multifamily permits, and those are down by -31.4%. The 382K is at least ahead of the 1980s/1990s median and the housing bubble period median when it was “all about single family.”
See also:
Lennar: Key Metrics Still Tell a Positive Macro Story 6-20-24
Credit Crib Note: NVR, Inc. 5-28-24
New Home Sales April 2024: Spring Not Springing Enough 5-23-24
Toll Brothers: A Rising Tide Lifts Big Boats 5-23-24
Existing Home Sales April 2024: Pay More, Get Less, but More Available 5-22-24
Credit Crib Note: Taylor Morrison 5-20-24
Housing Starts April 2024: Recovery Run Rates Roll On 5-16-24
PulteGroup: Strong Volumes, Stable Pricing 4-24-24
Housing Starts April 2024: Recovery Run Rates Roll On 5-16-24


