
New Home Sales April 2024: Spring Not Springing Enough
We look at a tepid month for new home sales with the South and West doing a fade in April.


The New Residential Sales release showed some softening in sale rates to 634K (SAAR) at a time when completed homes for sale are at a 1-year high of 98K and total homes for sale are at a 1-year high also at 480K.
The 634K was the second lowest in the last 12 months (Nov 2023 was lower) and comes with inventory for sale at the highest in 12 months (as one would expect as we enter the peak selling season), so this trend could signal softening, more incentives ahead, or both.
The regional mix shows the South off -15.1% for April YoY and the West -5.0% YoY with median sales prices at +3.9% YoY in this mix but down slightly by -1.4% sequentially (not seasonally adjusted, NSA).
We see a 1-year high in houses for sale (NSA) at the end of the period in the two largest regions with the smaller Midwest stable and the Northeast down.
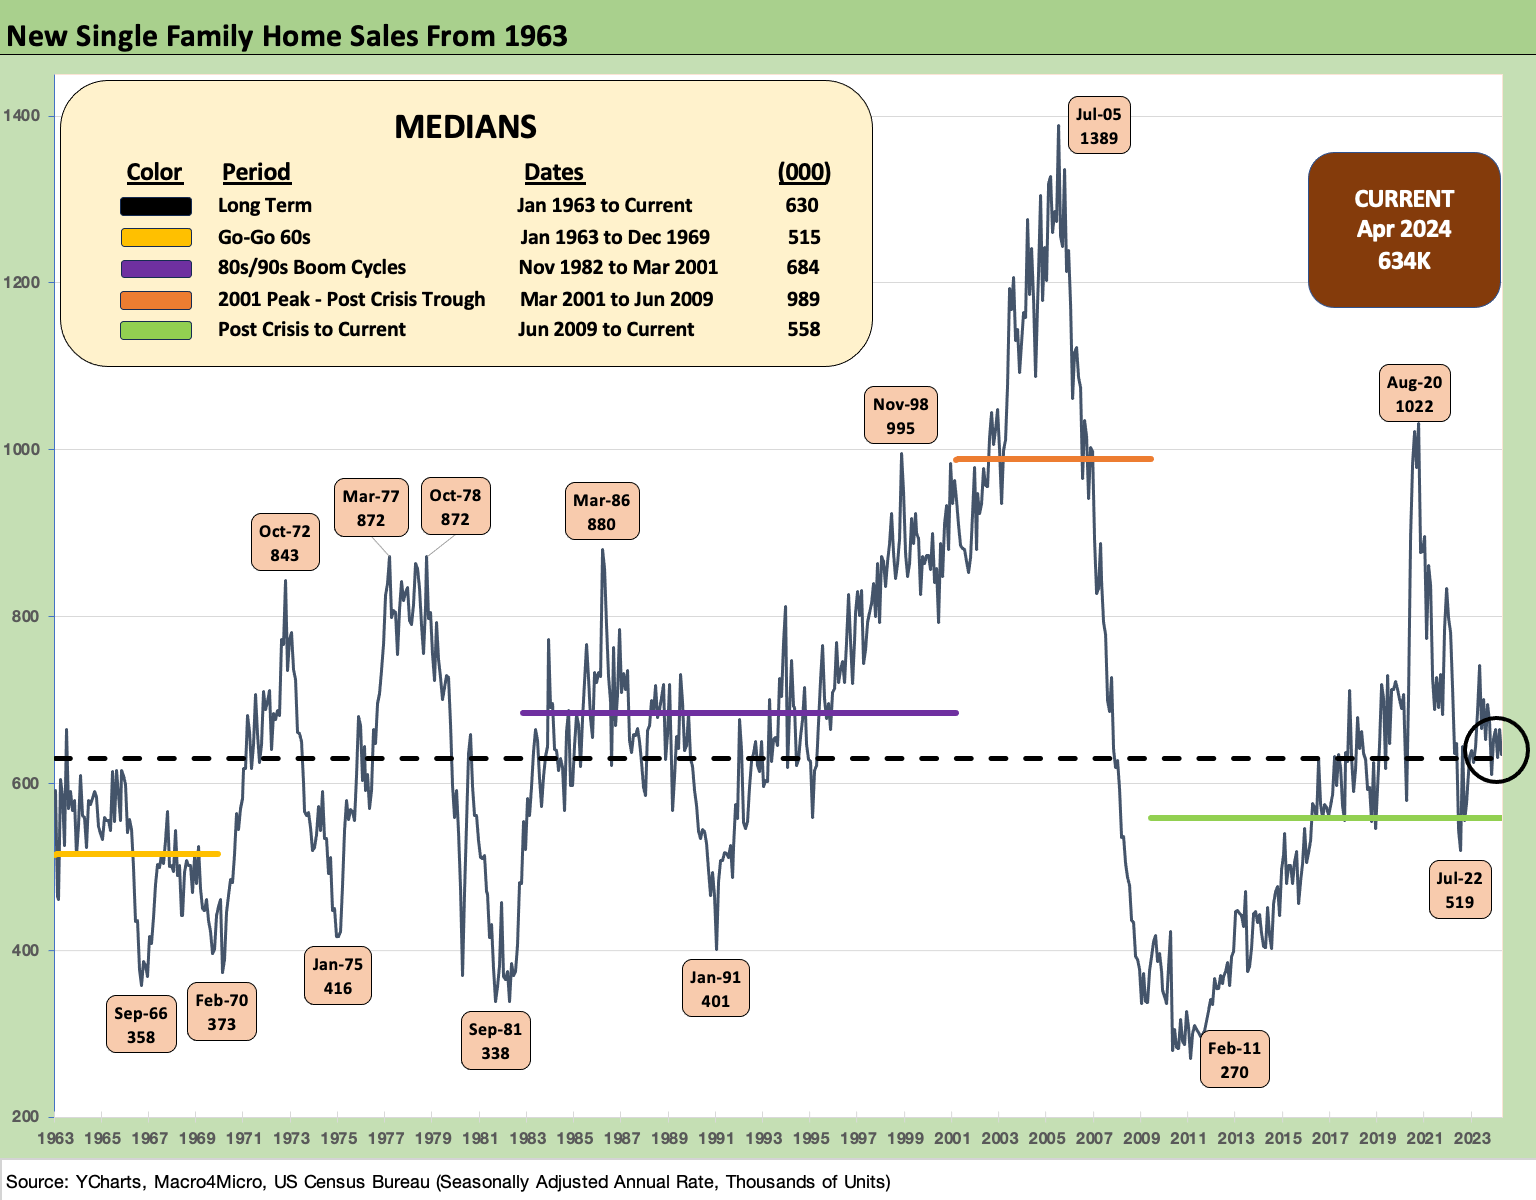
April new home sales marked a setback after last month got the spring started right (see New Home Sales March 2024: Seasonal Tides Favorable 4-23-24). We see 634K as of April above, which just edges out the long-term median from 1963. The medians are worth pondering with the post-crisis median of 558K not much higher than the 1960s.
That slightly above median level comes with the asterisk that demographic demand has never been this high just on the body count and need for shelter as the baby boom winds down and the echo boom continues to grow and multiply in the census. There is also the reality of immigration numbers and what that demand will look like after the election. Mass deportation and the military roaming the streets might cut into residential construction activity. That is not political – it is basic supply and demand.
Of course, in the initial recession that would come with mass deportations and labor crackdowns, mortgage rates could be much lower in the attendant economic contraction. Unless of course we have a China trade war and labor shortages, since then we could get stagflation instead. These sort of extreme scenario debates will pick up as the year goes on.

The above two-sided chart updates the new home sales vs. the market share (%) of new homes in total home sales. We cover the distortion of historical trends (golden handcuffs, locked-in, etc.) in the existing home sales commentaries (see Existing Home Sales April 2024: Pay More, Get Less, but More Available 5-22-24). This past month showed new home sales with a 15.3% share of total sales vs. the long term median of 12.4%. The share is down from a recent 17.4% high in 2023 and almost 19% in 2020.
We highlight that the residential construction data from the Census is an adventure in monthly restatements, so some of these metrics have a moving needle each month. The basic concept still holds, however, which is builders are picking up share with so many potential home sellers locked in and locked down with sub-4% mortgages. Large builders can navigate that problem with their captive mortgage operations. Small builders don’t have as many incentive tools at their disposal.
Getting our arms around the new home sales softening and getting into the guts of peak selling season is a challenge with so much good news out of the major public builders. In the midst of the solid guidance issued during the homebuilder earnings season, there is occasionally some mention of capital constraints for land developers or for smaller private homebuilders to get cost effective capital.
We have covered the mortgage headwinds ad nauseum and how the major builders can navigate those challenges while picking up sales share. This month’s data could be a one-off or a sign that the rate of starts could stall into the spring and early summer unless the high base of completed specs and high rate of unsold homes under construction continue to see good demand. Otherwise, there could be some tapping of the brakes on home starts.

The above chart updates the volume vs. price relationship since Jan 2001. We see current sales rates on top of the median from Jan 2001, but the April 2024 median price ticked down to $433.5K from $439.5K in March.

The above chart updates the time series for median prices on new home sales. We see softening since the 2022 peak as mortgage rates weighed on affordability. These time series always come with mix and regional caveats, but the general flavor of earnings from the public builders showed the big prices flowing through in 2022 with lagging effects of contracts and the UST migration over that year.

The above chart offers another angle on the monthly trend line from Jan 2022 just ahead of the end of ZIRP in March 2022. When the smoke cleared over this timeline on the post-COVID trend line in home equity balances, there has been a lot of net worth added to the balance sheets of households while owners of builder equities have done very well. For some time horizon returns on builder equities, see Toll Brothers: A Rising Tide Lifts Big Boats 5-23-24.
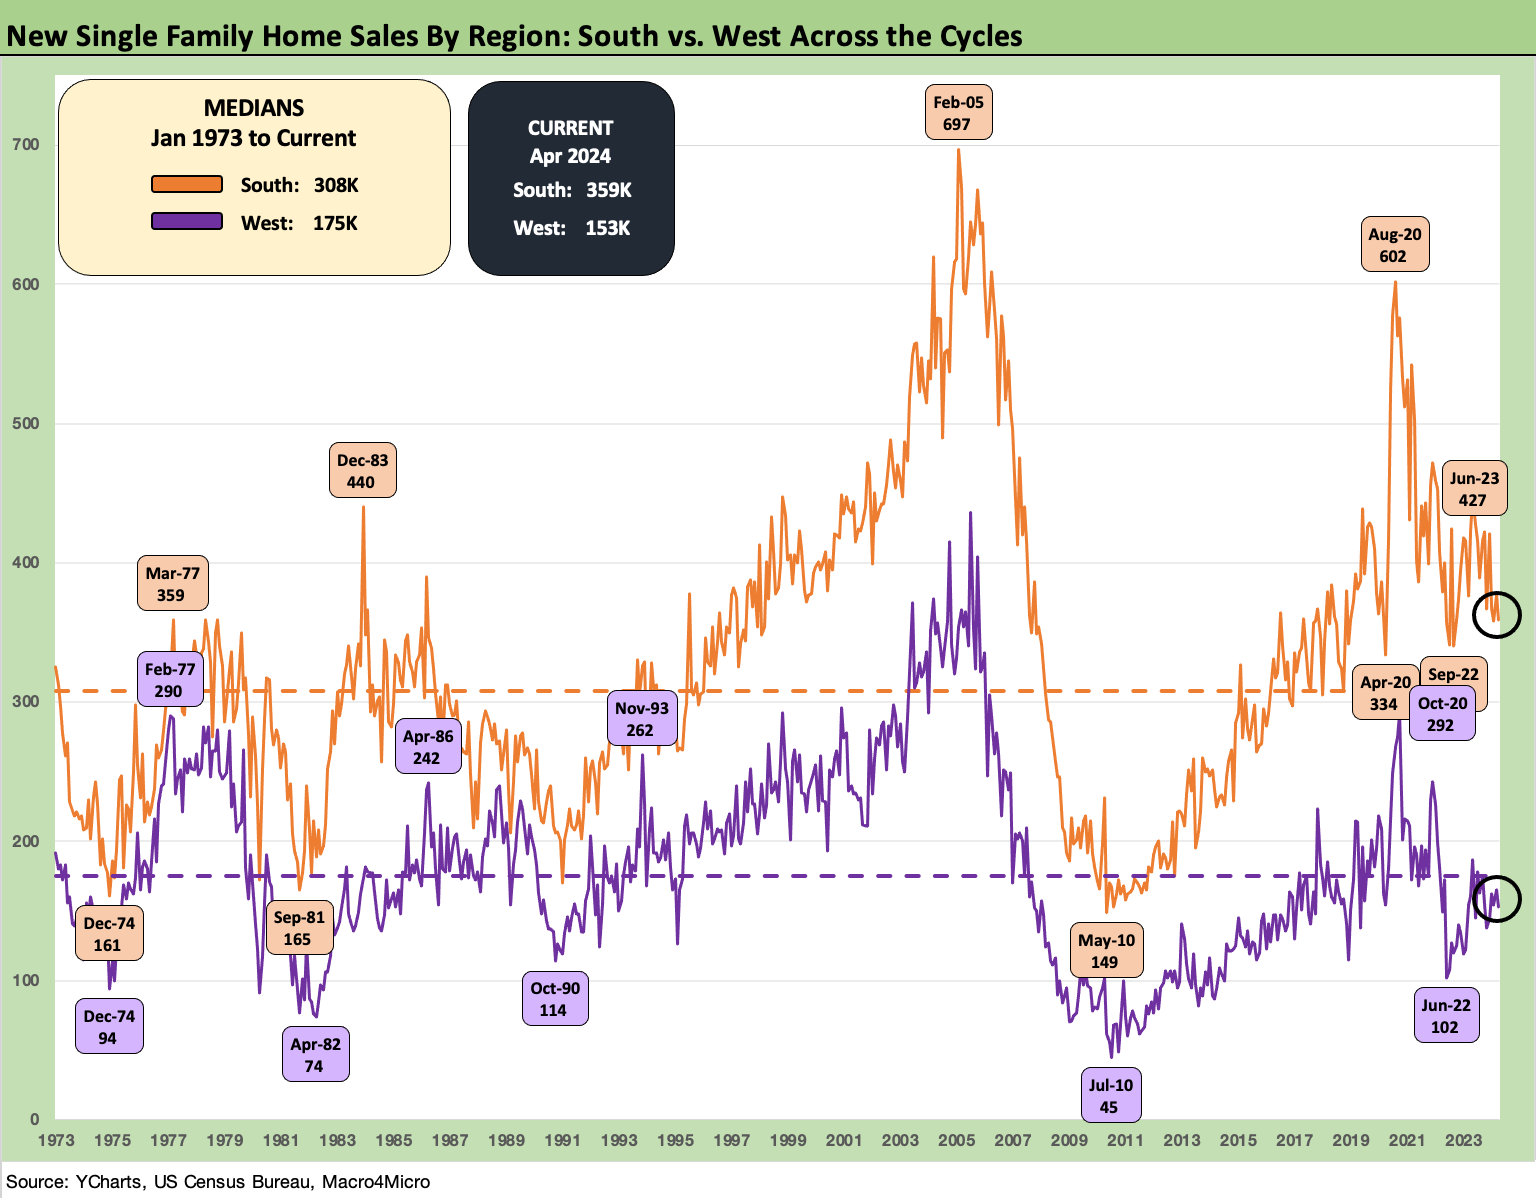
The chart above plots the new home sales volumes for the two largest home sales regions, the South (with the massive Texas and Florida markets) and the West. Both markets declined sequentially and YoY in April. The South is 57% of the 634 SAAR number and the West is 24%, so those two are 81% of the scoresheet. Last spring averaged north of 400K for the South, and we have now printed 300 handles in March and April of 2024 averaging just below 370K so far. The region needs a good May or June.

The above chart plots the two smallest regions, the Midwest and Northeast. The Midwest was up sequentially and YoY while the Northeast was down sequentially and flat YoY. In sum, they were mixed even if the reality is they don’t move the needle much on the national numbers.
See also:
Toll Brothers: A Rising Tide Lifts Big Boats 5-23-24
Existing Home Sales April 2024: Pay More, Get Less, but More Available 5-22-24
Credit Crib Note: Taylor Morrison 5-20-24
Footnotes & Flashbacks: State of Yields 5-19-24
Footnotes & Flashbacks: Asset Returns 5-19-24
Housing Starts April 2024: Recovery Run Rates Roll On 5-16-24
CPI April 2024: Salve Without Salvation 5-15-24
Consumer Sentiment: Flesh Wound? 5-10-24
April Payroll: Occupational Breakdown 5-3-24
Payroll April 2024: Market Dons the Rally Hat 5-3-24
Employment Cost Index March 2024: Sticky is as Sticky Does 4-30-24
PCE, Income, and Outlays: The Challenge of Constructive 4-26-24
1Q24 GDP: Too Much Drama 4-25-24
1Q24 GDP: Looking into the Investment Layers 4-25-24
PulteGroup: Strong Volumes, Stable Pricing 4-24-24
New Home Sales March 2024: Seasonal Tides Favorable 4-23-24
Systemic Corporate and Consumer Debt Metrics: Z.1 Update 4-22-24
D.R. Horton: Ramping Up in 2024 Despite Mortgages 4-19-24
Glad I am long multi family since folks have to find shelter somewhere and if they cant buy well guess they will need to rent someplace...that should absorb the Covid supply surge which might be bad news for the FED cause after the surge currently then a pause in new units which might lead to shelter costs in the inflation formula accelerating again...Glad I dont hold Jerome's job