
Existing Homes Sales May 2024: Weary Climb
We update existing home sales and price trends in a market where supply grows and prices rise in a challenging twist.


The sometimes counterintuitive nature of home price trends and the direction of inventory and strain of mortgage rates continues as existing home inventories keep rising along with median prices, which reached a record high of $419.3K in May (+5.8% YoY)
The timing of seller capitulation relative to buyer affordability across regional markets and product tiers keeps the layers of analysis busy with sequential volumes ticking lower on a decline in the massive South region but 3 of 4 (Midwest, West, and Northeast) flat YoY for May on a SAAR basis.
Existing home sales inventory continued to rise sequentially (+6.7%) and YoY (+18.5%) alongside record median prices as the pricier end of the market (over $750K) grew at a much faster rate than the struggling middle and low end.
On a positive note, the Freddie Mac 30Y benchmark ticked lower to 6.87% yesterday from 6.95% last week but up from 6.67% one year ago. That said, the “rate-lock” effects so often cited are very much in place with over 60% of mortgage holders at 4% or below and almost 30% at 3% or below.

The above chart updates the volume trend across price tiers using YoY increases along the trail of this tightening cycle. We look at the month of May more narrowly in a chart below in this piece. The trend is clear enough with the bigger ticket product tiers showing superior growth in a solid cyclical recovery off the COVID lows that has seen sustained strong employment and record stock markets. Confidence is easier to have when you have a material embedded increase in home equity and can make a large downpayment or pay all cash.
The first time and entry level has been routinely covered in our housing and single name homebuilder work (see links at bottom). In our recent Lennar report this week, we framed the relative stock performance over various time horizons of the 14 public builders we like to track. Toll Brothers, with its average sales price (ASP) of over $1 million, has been the top performer over the trailing 1 year and trailing 3-year time horizons. That ASP at Toll is well ahead of the distant #2 Tri Pointe (TPH), who weighs in at a $659 ASP for its most recent quarter. The worst stock performer was the low-ASP player LGI Homes (LGIH) with its $361K ASP and negative stock return in this tightening cycle.

The above chart updates the existing home sales inventory time series as the current inventory of 1.28 million homes has bounced off the lows of 850K in Feb 2022 but remains well below the long-term median of 2.14 million and the median of 2.9 million during the housing bubble years. The 1.28 million is also well below the 1.85 million median across the period from the existing home sale trough in 2011 through this month.

The above two-sided chart updates the pattern of sales volumes for total existing home sales (EHS) vs. new single family home sales. The EHS weighed in at 4.11 mn for May while new single family for April was 634K. We will get the updated new single family number for May 2024 next week.
The general trend has been home builders picking up market share of total home sales (existing + new) given the availability of product at the builder (after all, they build it) and the ability of many builders to deploy incentives across mortgage buydowns and fee-based incentives (as in discounts or fee waiver in mortgage, title, insurance etc.).
The basic backdrop for EHS has not changed much across this peak spring summer season, but more sellers are out looking. The challenge for the existing home seller and buyer alike is still a major headwind from rates and monthly payments. The economics require lower rates for the seller to extract the full value from a home sale while also being able to afford the right move-up trade on the other side at the higher mortgage rates in this market. That can make for two obstacles, and we see it in rising inventory months with single family at 3.7 months (from 3.0 in Jan 2024) and 4.7 months for condos and coops (vs. 3.6 months in Jan 2024).

The above chart breaks out the timeline for single family alone vs. total existing. We see EHS of 4.11 million, which is well below the long-term median (from Jan 1999) of 5.25 million. The lower line is ex-condo/ex-coops. Total single family ex-condos/coops declined sequentially to 3.71 million from 3.74 million. We saw 400K in condos and coops, flat to April 2024.
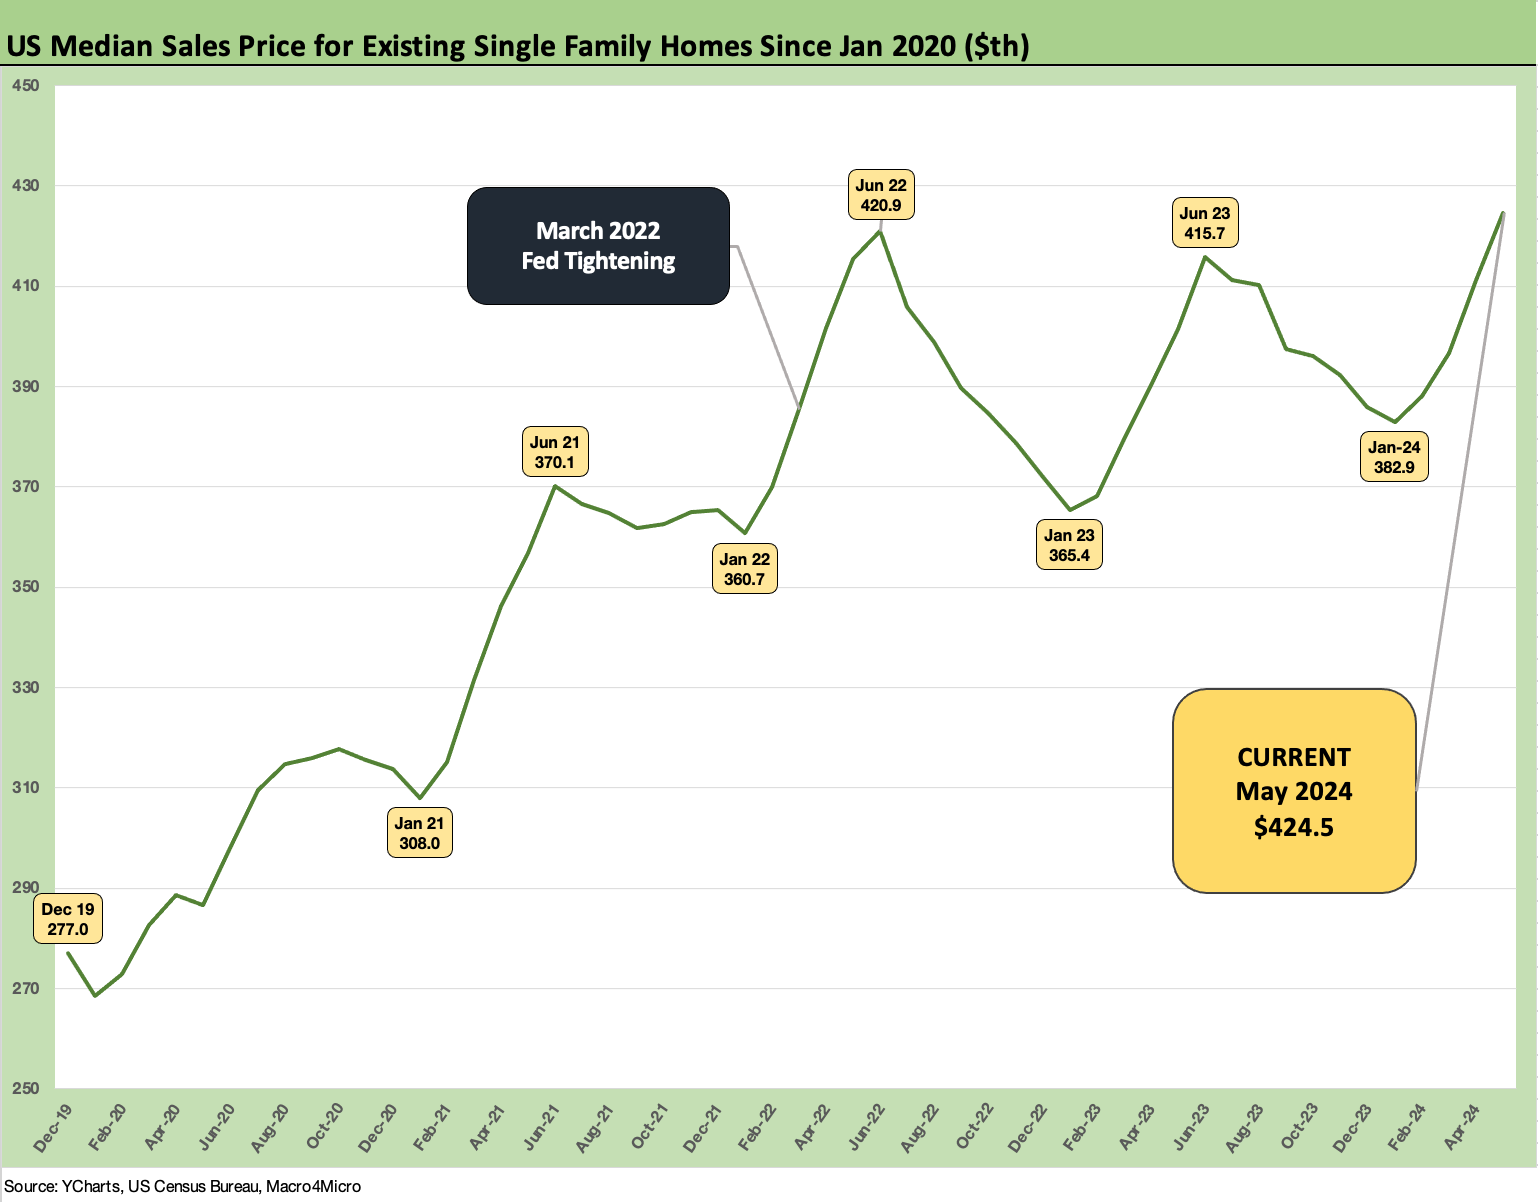
The above chart updates the median price trend for existing single home sales across the period from the end of 2019. The median price just crossed back above the high price last seen in June 2022, after ZIRP was over for 3 months and the tightening cycle was underway in a month of June that saw the peak CPI of 9.1%.

The above chart updates the monthly EHS volumes from Jan 2021 through May 2024. We are a long way from the 6-handles of 2021 as the steady trend lower across 2022 took us down into the high 3-handles of 2023. The market is stalled in 2024 in the low 4 handle range.
The bears will say a rise in inventory on lower rates will slam pricing, but that is a leap of pessimism when looking at this chart. That will free up transaction activity and will need to be set against the top-down macro drivers of why rates are sliding (Recession? Lower inflation? Oil price crash?). Confidence in sustained economic expansion while believing in lower rates and lower inflation and lower costs of home production (labor, materials, etc.) are quite a wish list.
That inflation debate and questions around the supply side variables (think tariff and trade wars, etc.) will be on the docket for next week in the debates we would hope. We can have two protectionists possibly talking about the damaging effects of tariffs on inflation – or maybe not. The search for the political and economic free lunch (the frictionless wheel and the risk-free tariff) will continue.
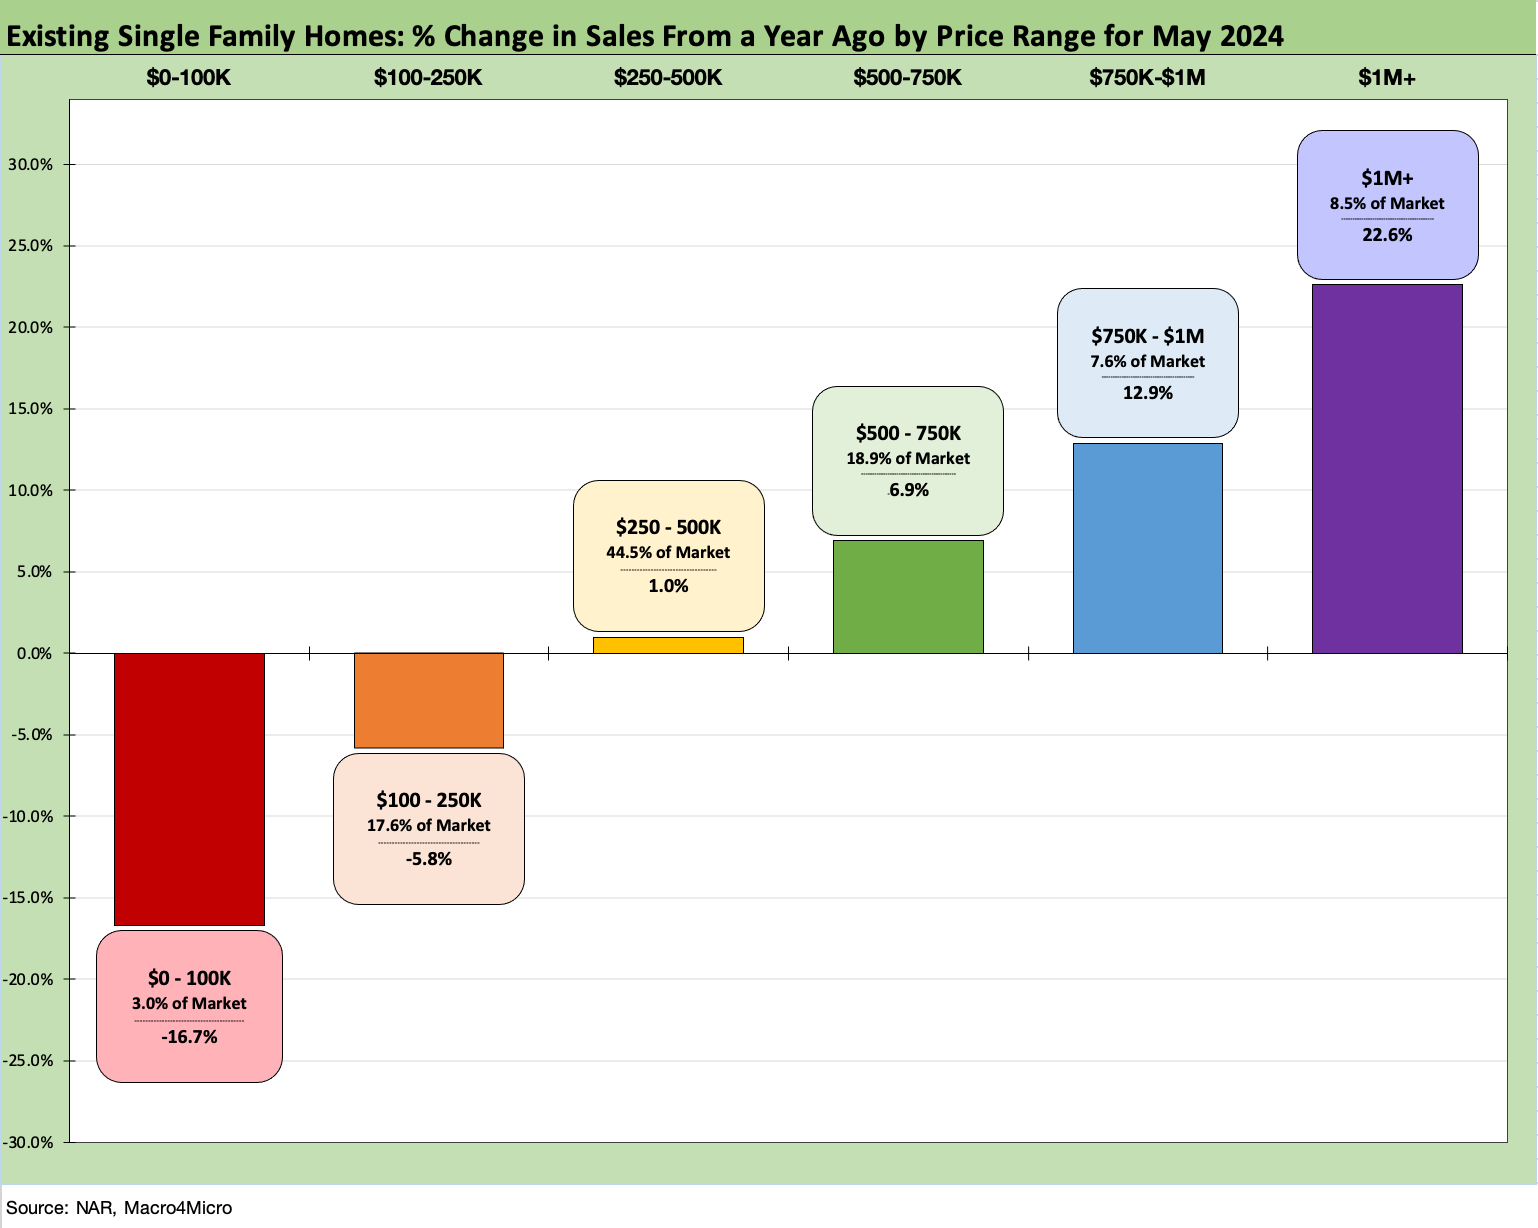
The above chart details the price tier performance in May with 4 of 6 higher and the $1+ million tier the highest growth and the $750K to $1 million next. At least the $250K to $500K segment was positive at +1.0%. That segment is over 44% of the market and the historical sweet spot.
This chart also offers one more reminder that every trend in aggregate median prices comes with the asterisk of “mix” by price tier and by region.
See also:
Housing Starts May 2024: Starts vs. Deliveries Balancing Act 6-20-24
Lennar: Key Metrics Still Tell a Positive Macro Story 6-20-24
Footnotes & Flashbacks: State of Yields 6-16-24
Footnotes & Flashbacks: Asset Returns 6-16-24
Credit Crib Note: NVR, Inc. 5-28-24
New Home Sales April 2024: Spring Not Springing Enough 5-23-24
Toll Brothers: A Rising Tide Lifts Big Boats 5-23-24
Existing Home Sales April 2024: Pay More, Get Less, but More Available 5-22-24
Credit Crib Note: Taylor Morrison 5-20-24
Housing Starts April 2024: Recovery Run Rates Roll On 5-16-24
PulteGroup: Strong Volumes, Stable Pricing 4-24-24
Housing Starts April 2024: Recovery Run Rates Roll On 5-16-24