
New Home Sales: Pumping the Brakes?
The May 2024 release brings a massive upward revision in April and a plunge in May to the lowest level since the fall.


The pricing strategies and incentives had been picking up as mortgage rates remained stubborn in recent months while homebuilder equities have been waffling after such a great run (see Lennar: Key Metrics Still Tell a Positive Macro Story 6-20-24, see links at bottom).
The steep dive for May from an upwardly revised 698K in April (from 634K) to only 619K in May was tied to the massive South region (includes TX and FL) that saw a drop from 418K to 368K. That said, all 4 regions declined even if the South dominated the mix.
The median price of $417.4K was down very slightly from April 2024 ($417.9K) but was down less than 1% from May 2023.
We see the supply of “homes for sale at the end of period” running at higher average levels YoY in recent months both for homes “under construction” and “completed,” but those levels are down sequentially for “under construction” and near YTD lows while “completed for sale” are at YTD highs.
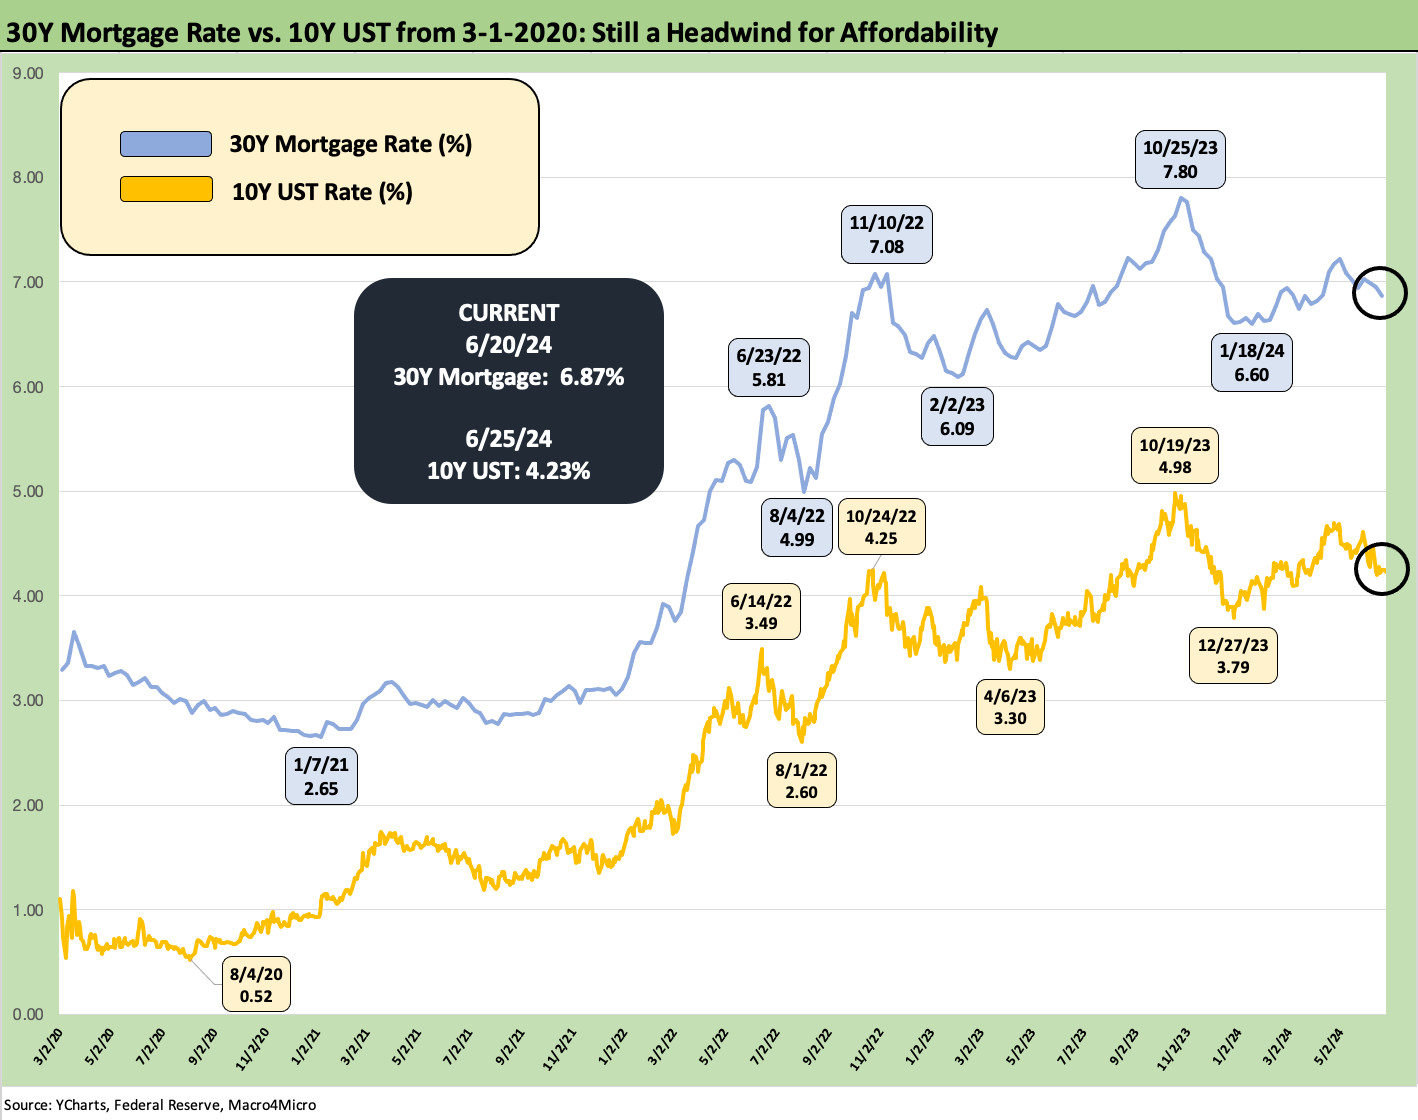
The above chart updates the run rates for 30Y mortgage rates (Source: YCharts) vs. the 10Y UST. The path of mortgage rates had been mixed and volatile with 30Y hitting 8% (for some lenders) and 6% handles over the past year.
As we have covered along the way in our research on housing and rates, the homebuilders had impressively pushed right through the monthly payment shocks with major builder equities and ETFs (XHB) generating the best returns among the 32 benchmarks and ETFs we follow each week. The XHB only recently fell out of the #1 slot for the running LTM (see Footnotes & Flashbacks: Asset Returns 6-23-24).
The peak building/selling season is here, and the ability of the builders to sustain favorable order growth rates is inevitably going to be capped on the low end by the affordability challenge even if the Toll Brothers of the world can keep rolling (see Toll Brothers: A Rising Tide Lifts Big Boats 5-23-24). Existing home sales have not brought good news (see Existing Home Sales May 2024: Weary Climb 6-21-24) and starts will be tied to the prudent working capital management of the builders (see Housing Starts May 2024: Starts vs. Deliveries Balancing Act 6-20-24).
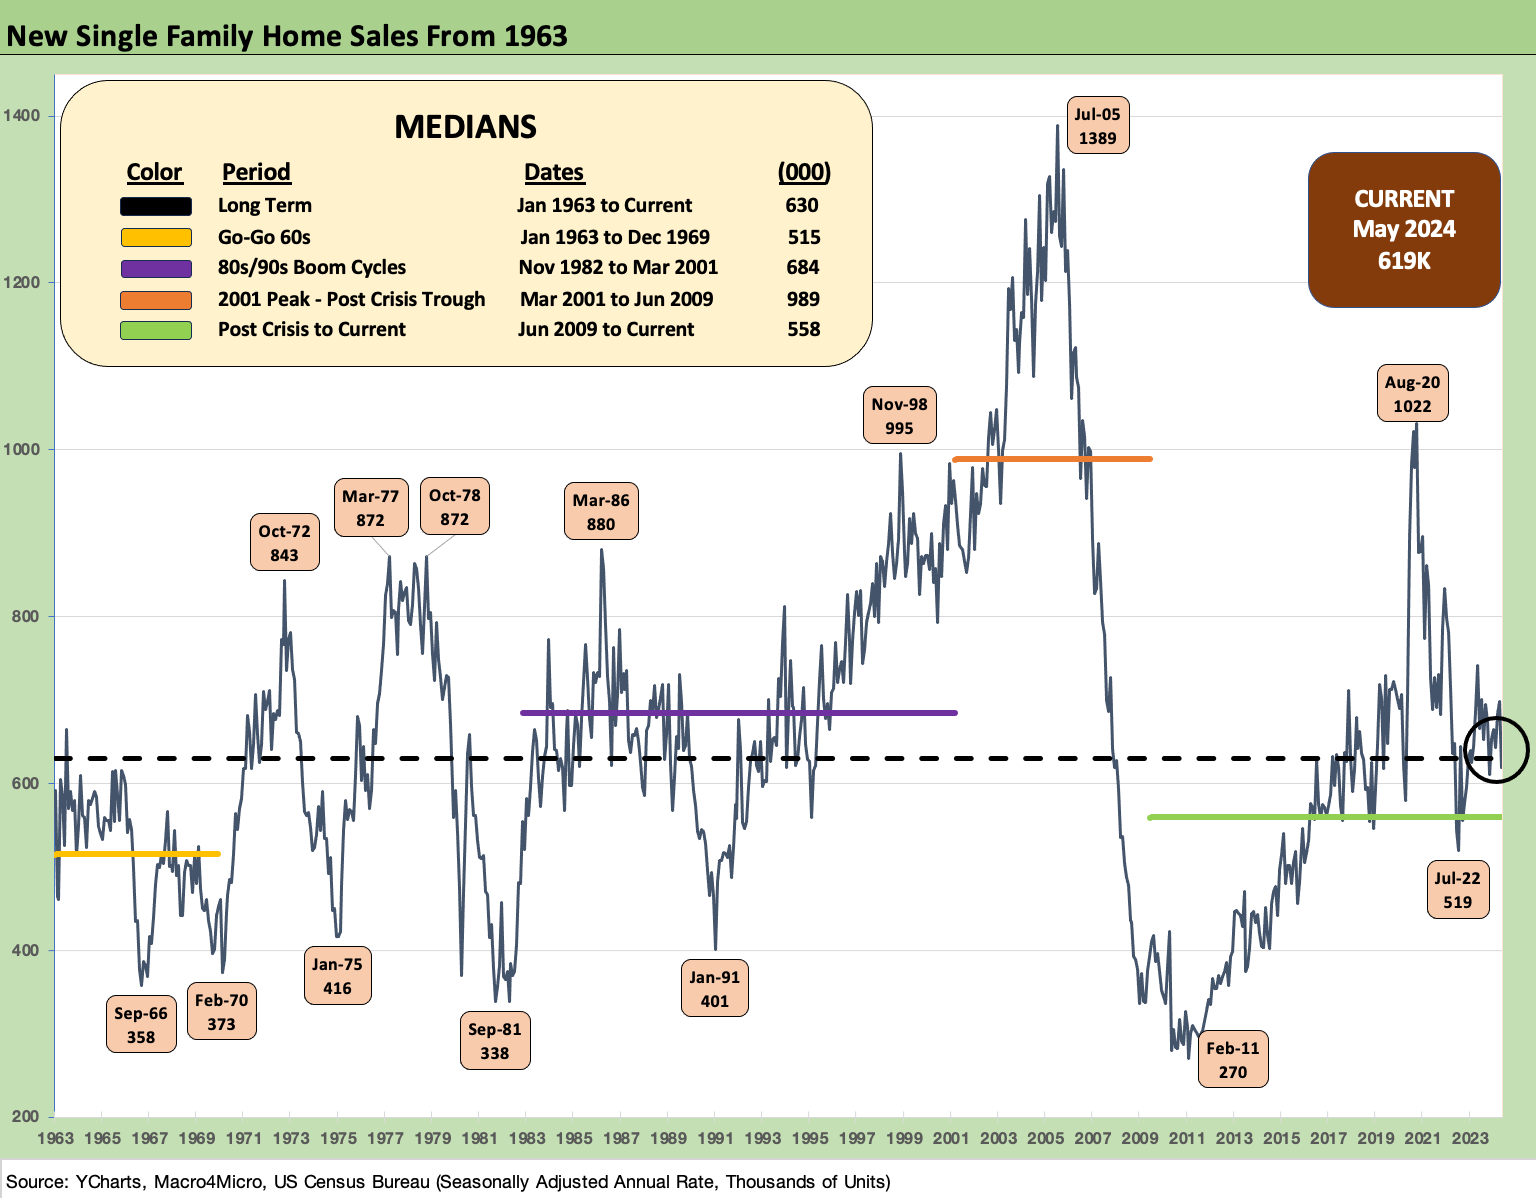
The above chart updates the long-term time series single family new home sales. We see current levels now below the long-term median from 1963 despite the greater demographic demands today. May 2024 new single family home sales only exceeds the post-crisis median after the housing bubble burst and mortgage credit collapsed along with a range of regional valuations for some years.
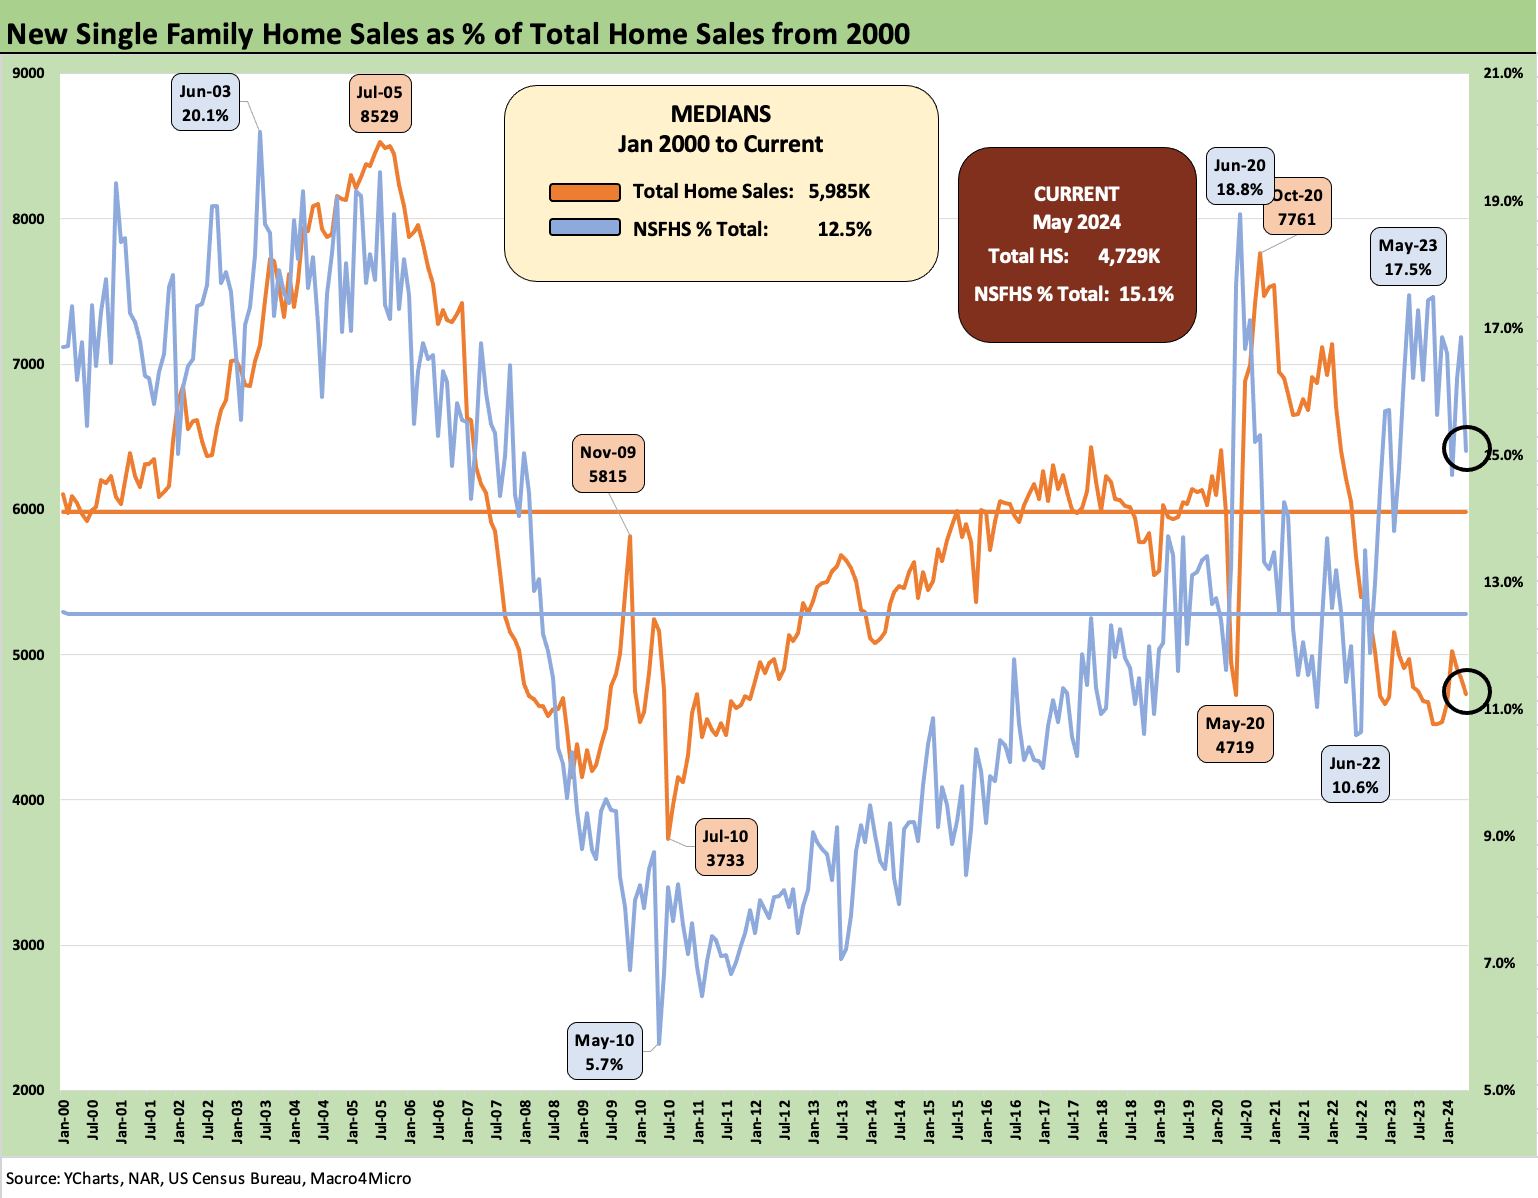
The above two-sided chart updates the new single family sales time series alongside the market share of new home sales within the total home sales numbers (existing + new). Homebuilders picked up market share given the existing home mortgage “lock-in effect” (“golden handcuffs,” etc.) and the wider range of incentive strategies in the homebuilders’ arsenal as they plan their community counts, product tier mix, and pricing strategies.
The most recent 15.1% share is above the long-term median of 12.5% but down from the market share highs noted in the chart (18.8% in June 2020, 17.5% in May 2023).
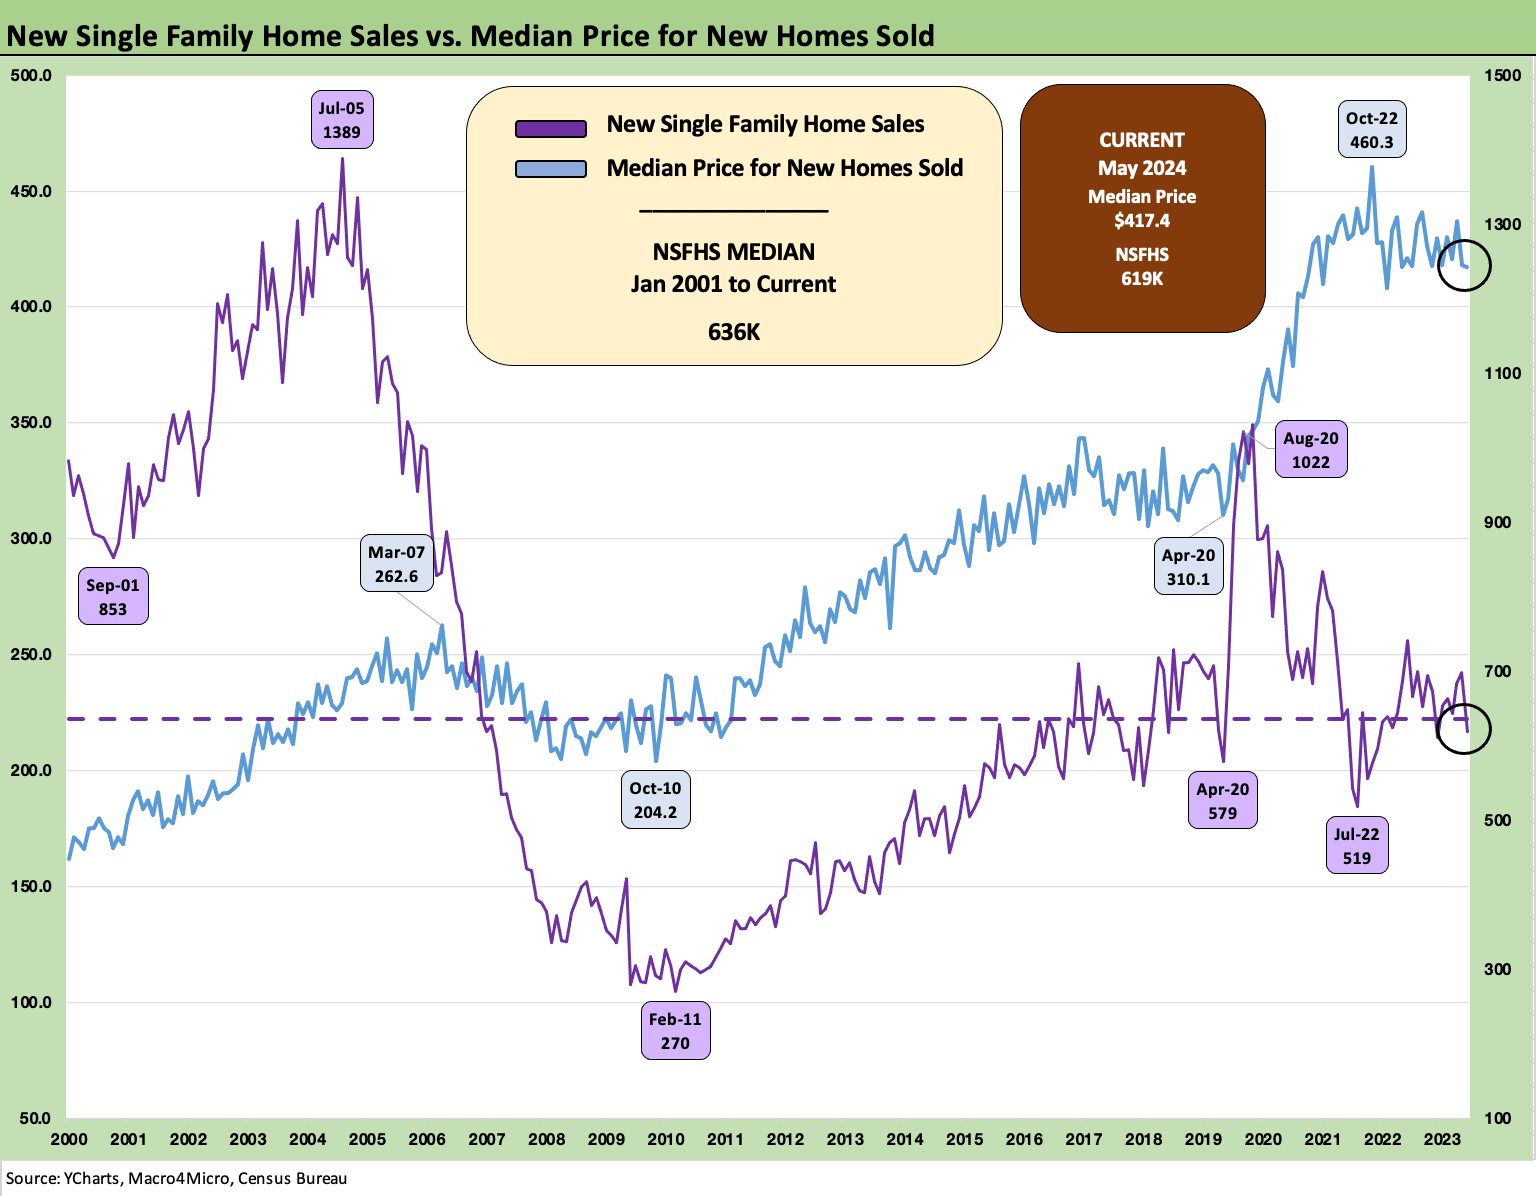
The above two-sided chart updates the timeline for median prices and sales volumes. The rising price is clear enough, but the dagger in affordability is tied to the mortgage rate trend and disproportionate impact on monthly payments.
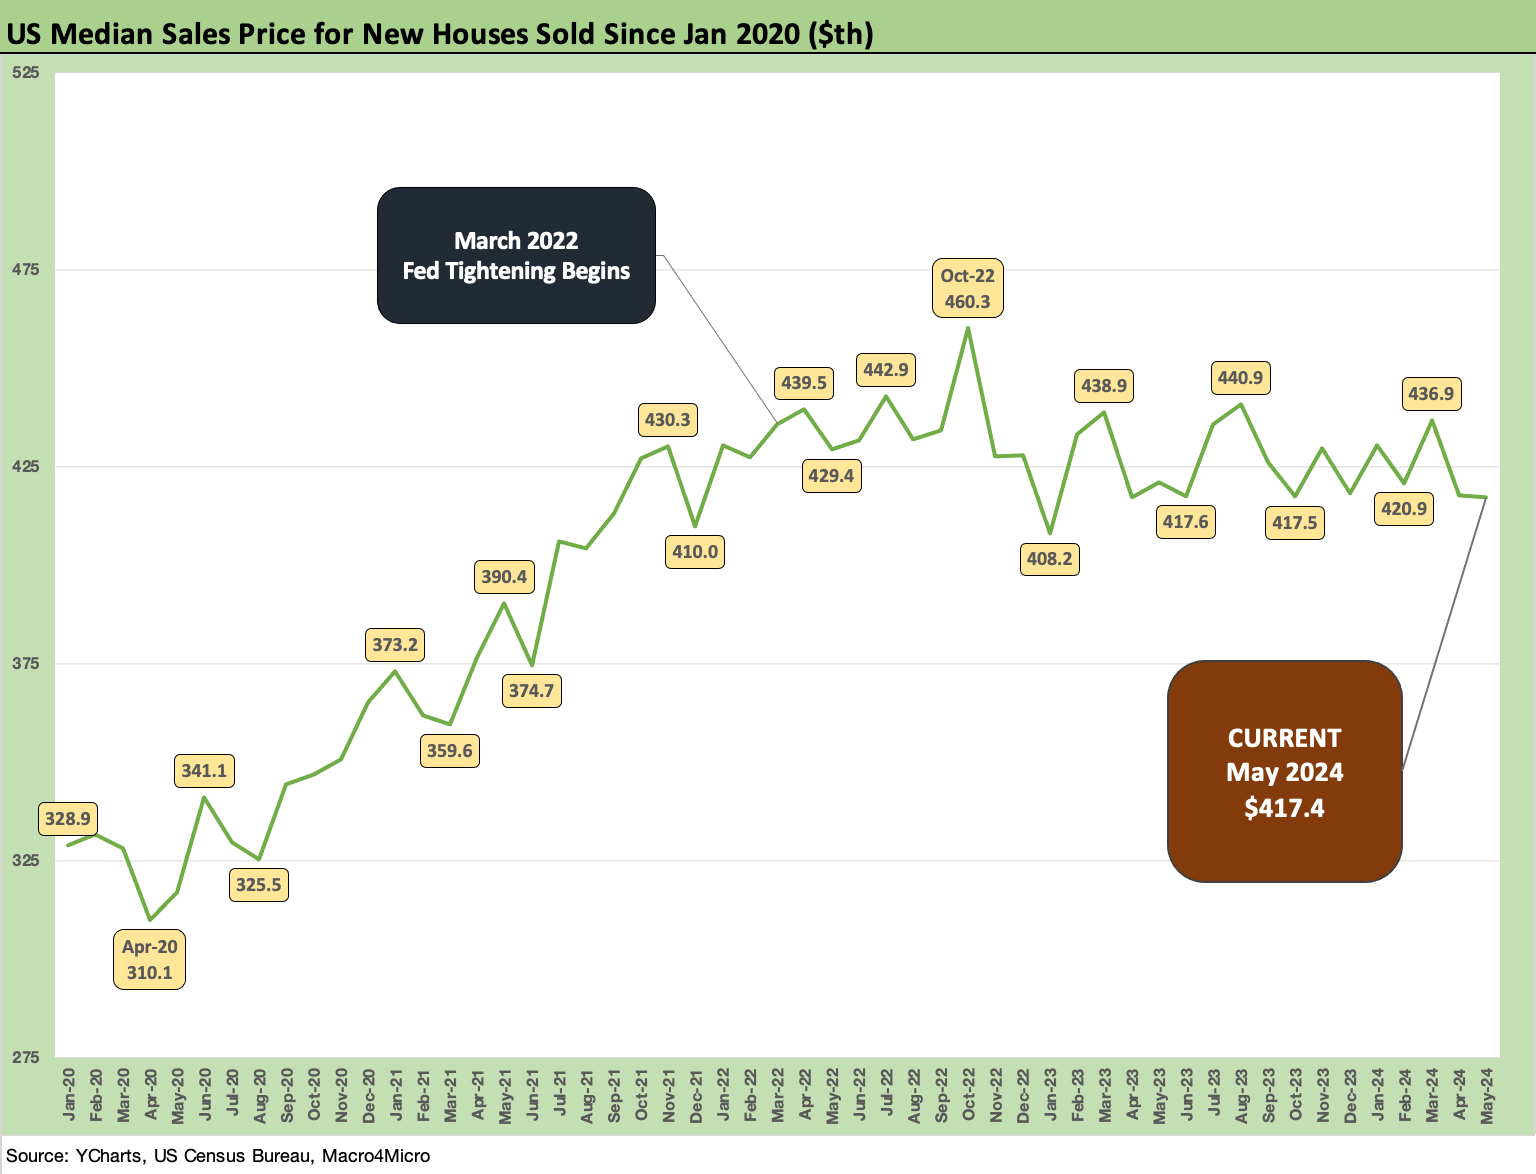
The above chart updates the time series for median prices. The trend line comes with the asterisk of regional and product price tier mix. The basic problem is clear enough as the limited supply and very high demand has pushed new home prices higher. The ability to free up more existing home inventory through structural changes in the industry (e.g. ability to sell a house with the mortgage assumed) would be a legislative and regulatory battle for another day (with a lender cage match thrown in).
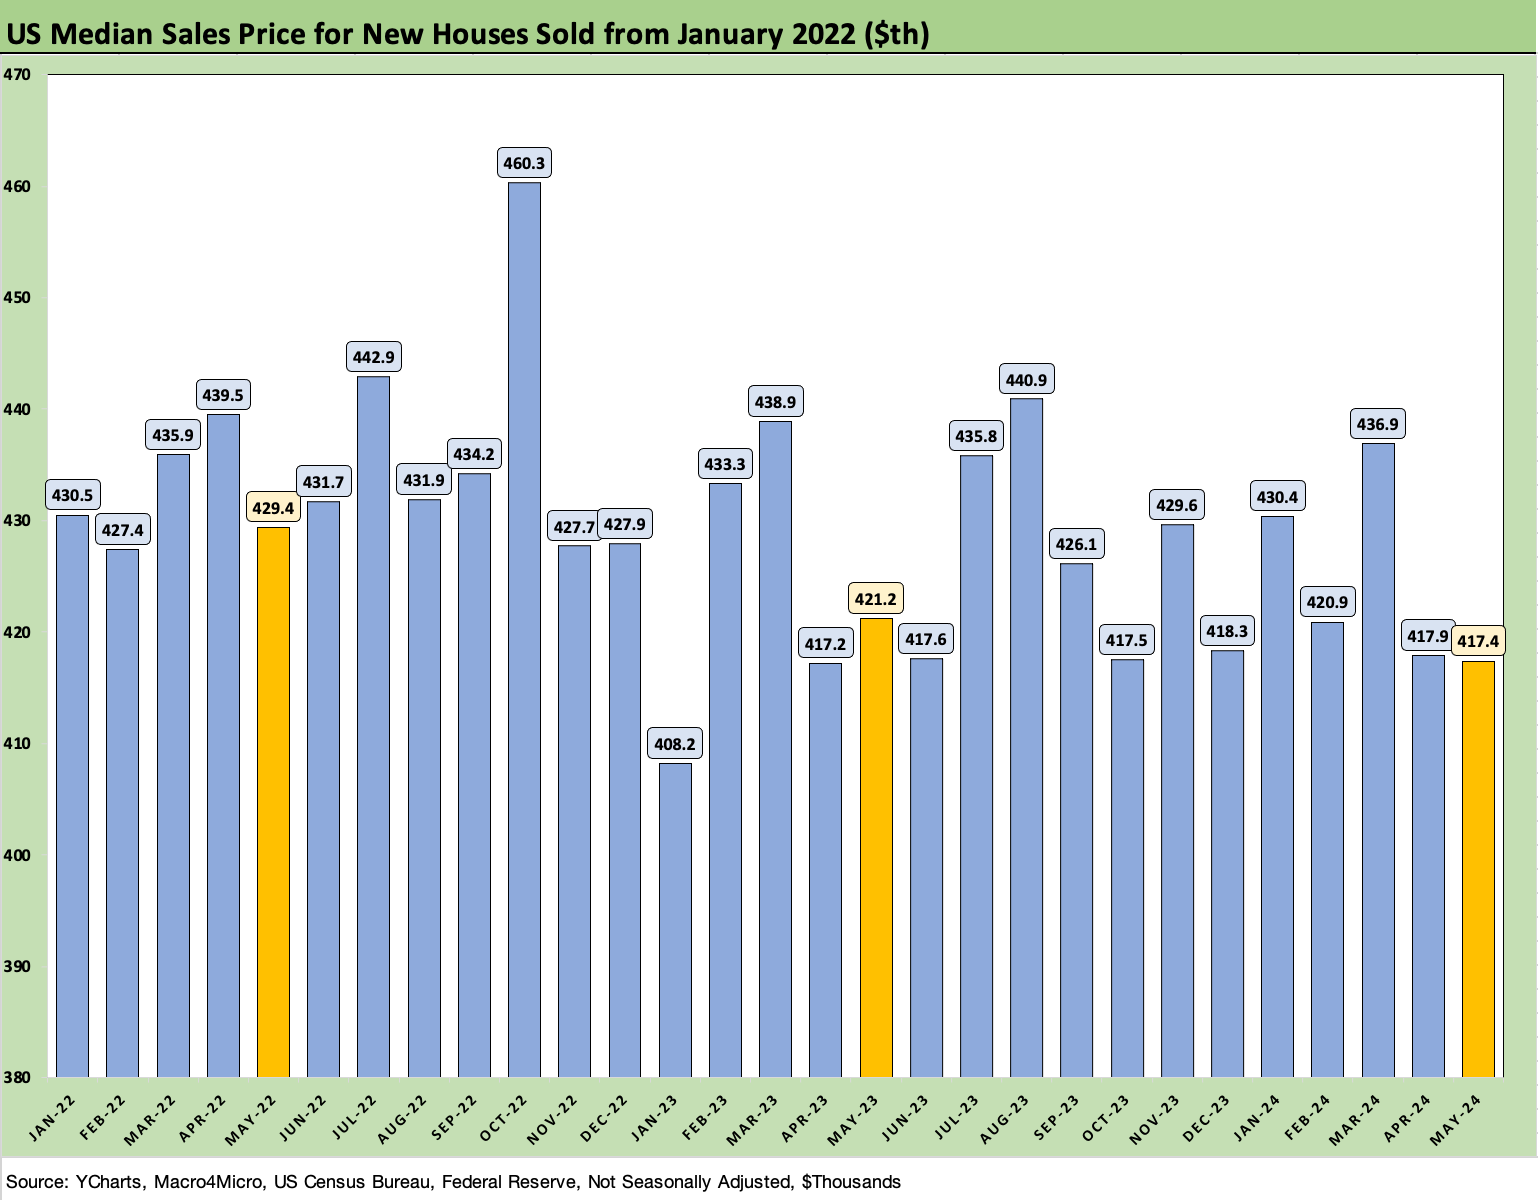
The above chart just offers another granular visual on median prices across each month back to Jan 2022 just ahead of the tightening cycle.
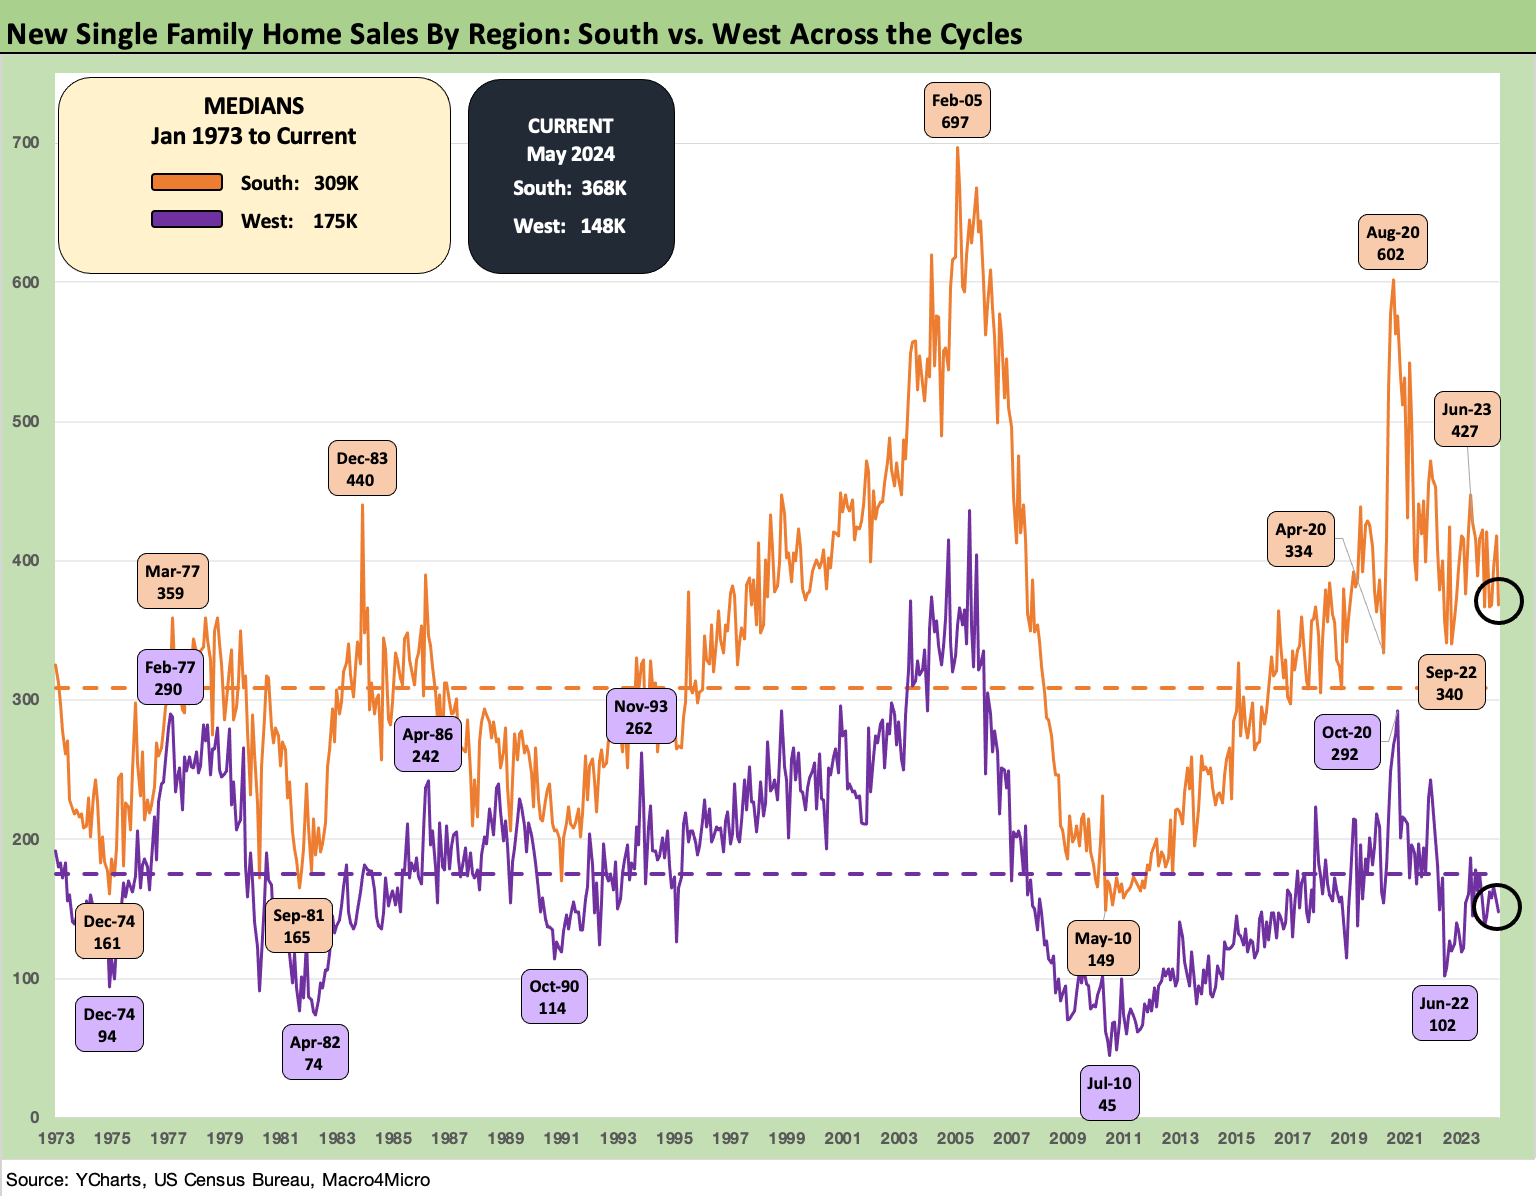
The above chart frames up the new home sales history across the two largest regions, the South and the West. We also include the longer-term medians in the box in the upper left. We see the South running ahead of the median and the West below it.
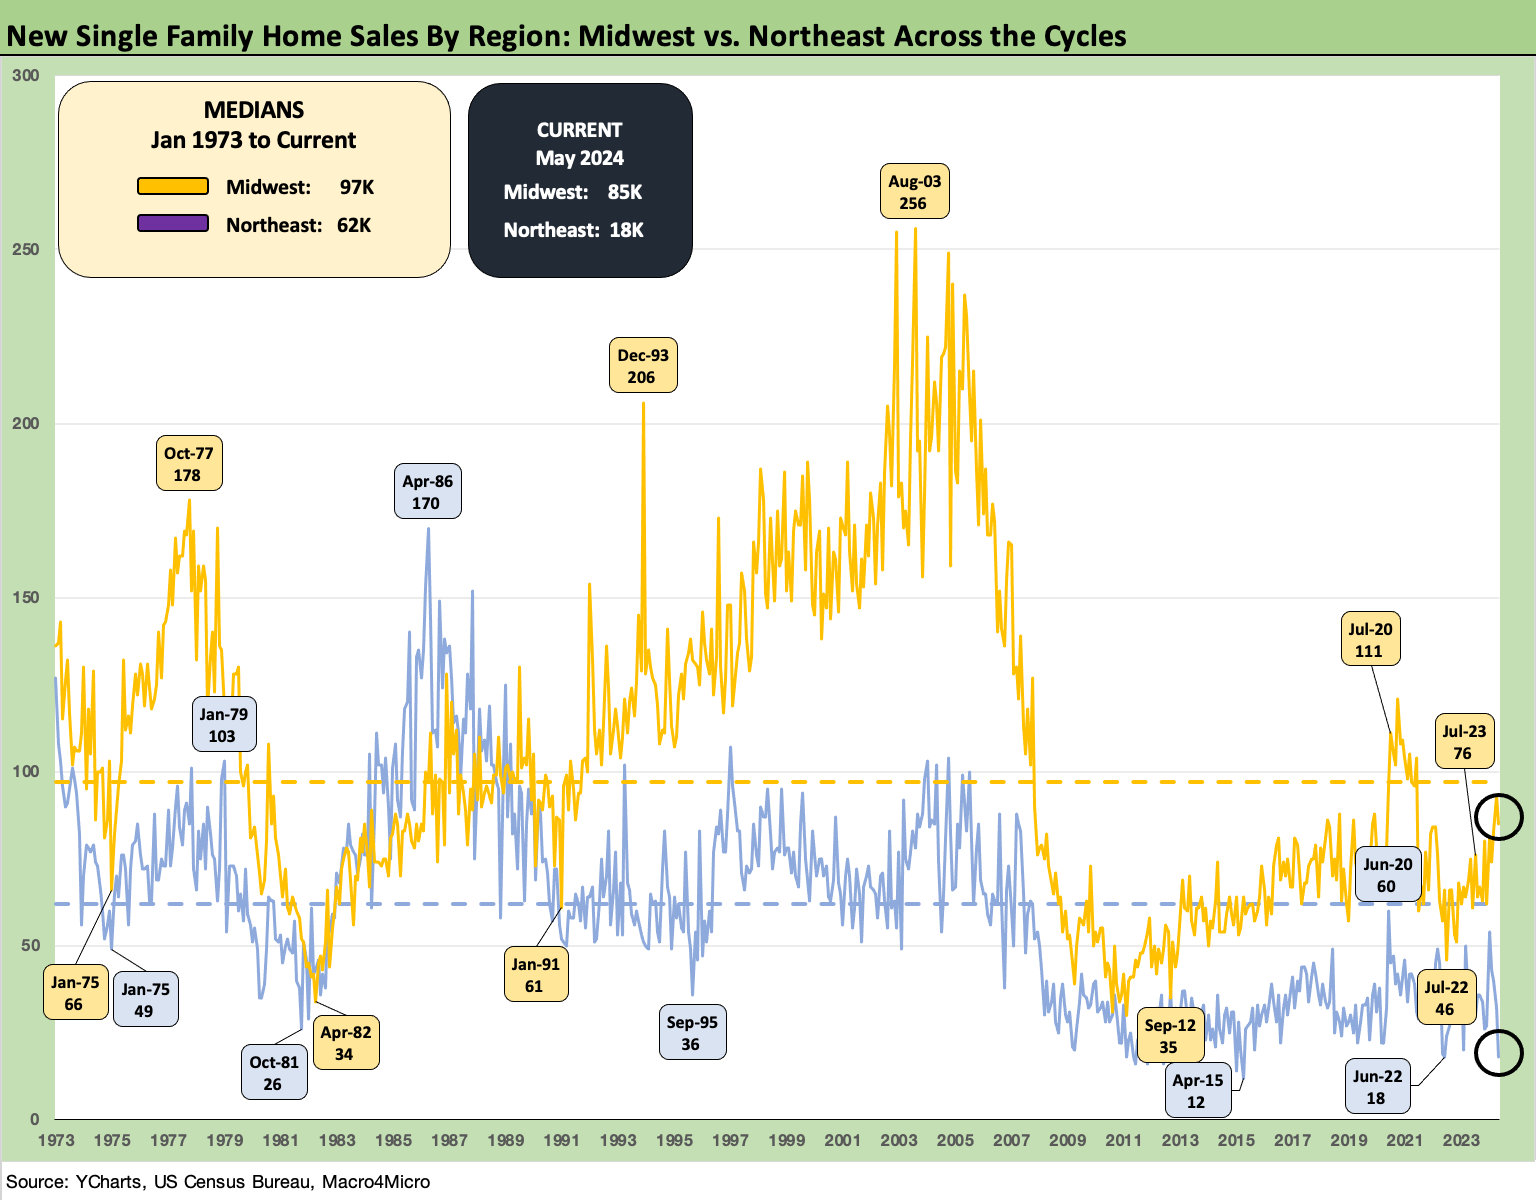
The above chart updates the two smaller regional market histories for new home sales. Both are running below long term medians.
See also:
Footnotes and Flashbacks: Credit Markets 6-23-24
Footnotes & Flashbacks: Asset Returns 6-23-24
Footnotes & Flashbacks: State of Yields 6-23-24
Existing Home Sales May 2024: Weary Climb 6-21-24
Housing Starts May 2024: Starts vs. Deliveries Balancing Act 6-20-24
Lennar: Key Metrics Still Tell a Positive Macro Story 6-20-24
Credit Crib Note: NVR, Inc. 5-28-24
Toll Brothers: A Rising Tide Lifts Big Boats 5-23-24
Credit Crib Note: Taylor Morrison 5-20-24