
Market Commentary: Asset Returns 5-10-26
We look at asset returns as semiconductor equities start to strain the adjective supply.


The Trouble with Sycophants: they just keep multiplying.
The moves in tech equities – and semiconductors narrowly – launched running returns for some major industry movers not seen since 1999 with tech-centric benchmarks posting trailing 1-year returns 3-4x the long-term annual returns on the equity asset class (even if well short of the crazy +86% for NASDAQ in 1999).
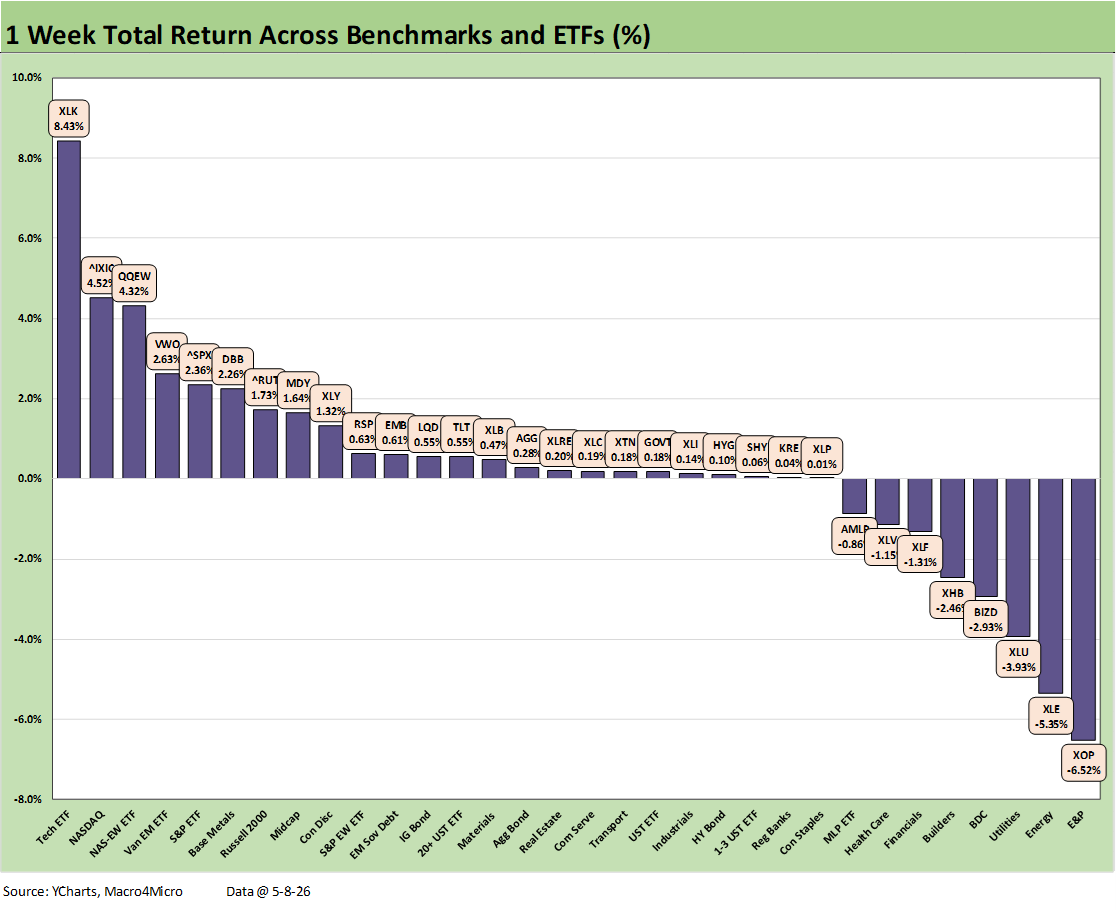
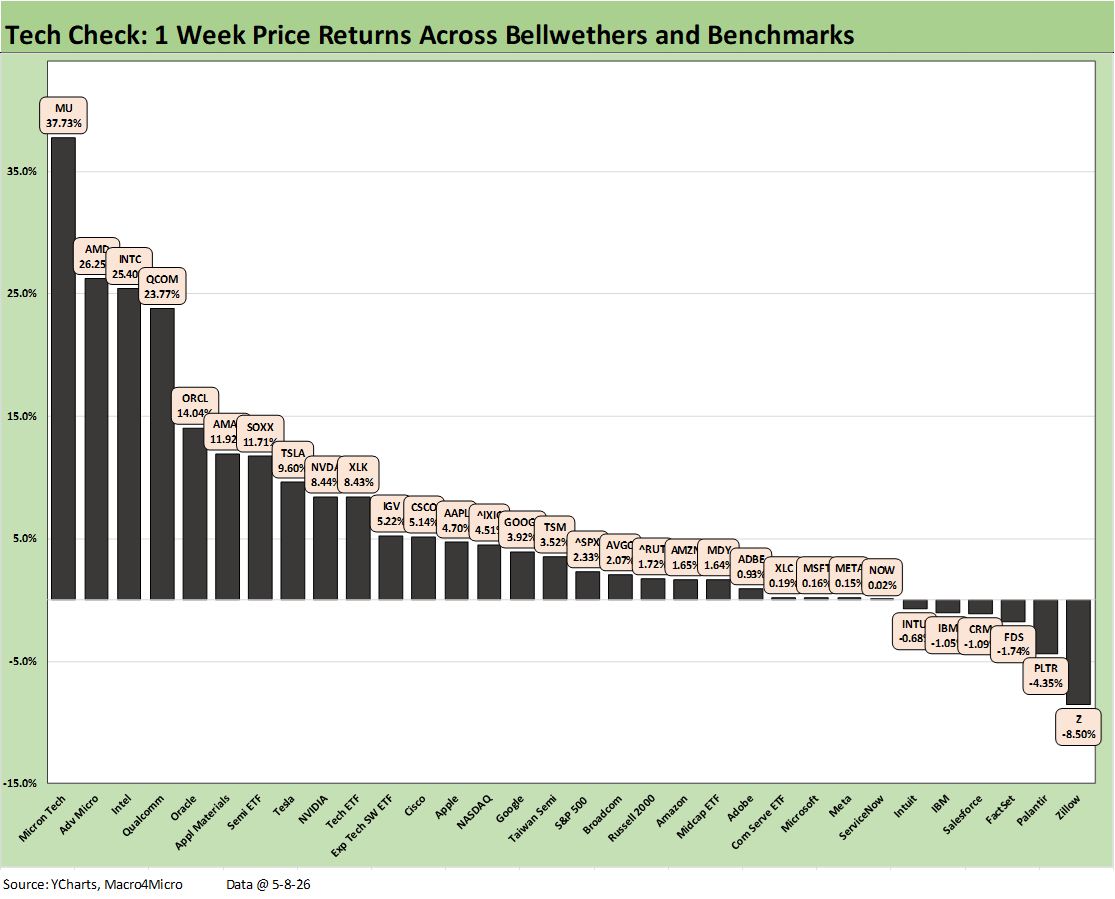
The 1-week return for the SOXX ETF of 11.7% reflected outsized moves by Micron (+37.7%), Advanced Micro (+26.2%), Intel (25.4%) and Qualcomm (+23.8%) as such market action fed a 1-month return for the NASDAQ of 16% with the Tech ETF (XLK) at 23.9%.
The FOMC and oil price wildcard remains unpredictable with CPI and PPI this week being critical drivers of sentiment as we push further into month 3 of the Iran War and all the disconnects in the futures and physical markets for oil and minimal chance of Iran caving in to a wide range of demands. Trump is seeking an exit that does not have him take the fall for “losing a war.” One plan is to say, “the war is over” and another is to say that “it is not a war.”
On the good news list has been an exceptional 1Q26 earnings season with FactSet reporting a blended S&P 500 earnings growth rate of over 27% (highest since 4Q21) with 89% of the S&P 500 companies having reported.
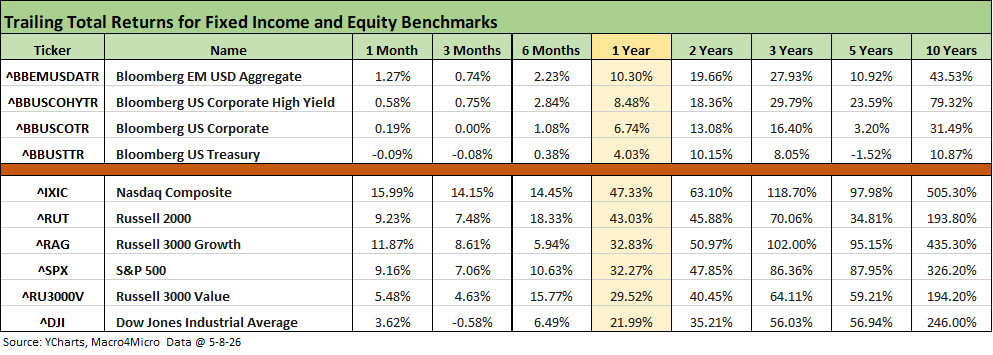
The above table updates our broad asset class benchmarks across debt and equity, and the reversal from the March sell-off has been stunningly strong in equities. Debt has been mixed over 1 month and 3 months with duration setbacks, but even that has been very mild with credit generally unflappable outside the recurring private credit headlines. Even private credit has calmed down a bit as BDCs reported and demystified what was going on under the hood. As we detail below, the BDC ETF (BIZD) posted positive 1-month returns and made it into the upper half of the second quartile. BIZD is almost back to 0% in returns for the rolling 3 months.
The equity benchmarks have also entered another zone this month led by tech as we cover in various charts below. Earnings season has been reassuring for the tech excess, which in turn just keep on getting more excessive. As we break out in the next chart, semiconductors are on a ride not seen in a tech bucket since 1999 – year when the NASDAQ printed over +86% for the year. The 16% 1-month return on NASDAQ and +11.9% return on Russell 3000 growth are impressive.
The 1999 TMT bubble experience of course ended badly, but the credit risk profiles of the main drivers this time around are quite healthy in contrast. Valuation methodologies, growth multiples, achievable revenue models, returns on the capex, related multiplier effects, and structural changes in tech and related services and goods markets are fair game to debate, but the bull market steamroller tends to run over second guessing at this point.
We posted the above chart on Thursday on our LinkedIn page but update the numbers for a stellar Friday that include daily moves such as Micron (+15.49%), Intel (13.96%), and Advanced Micro (+11.44%) with Qualcomm “lagging” at +8.1%. That was a “great month” in a single day.
As we discussed in our LinkedIn post (the following is a cut-and-paste with some edits and adds):
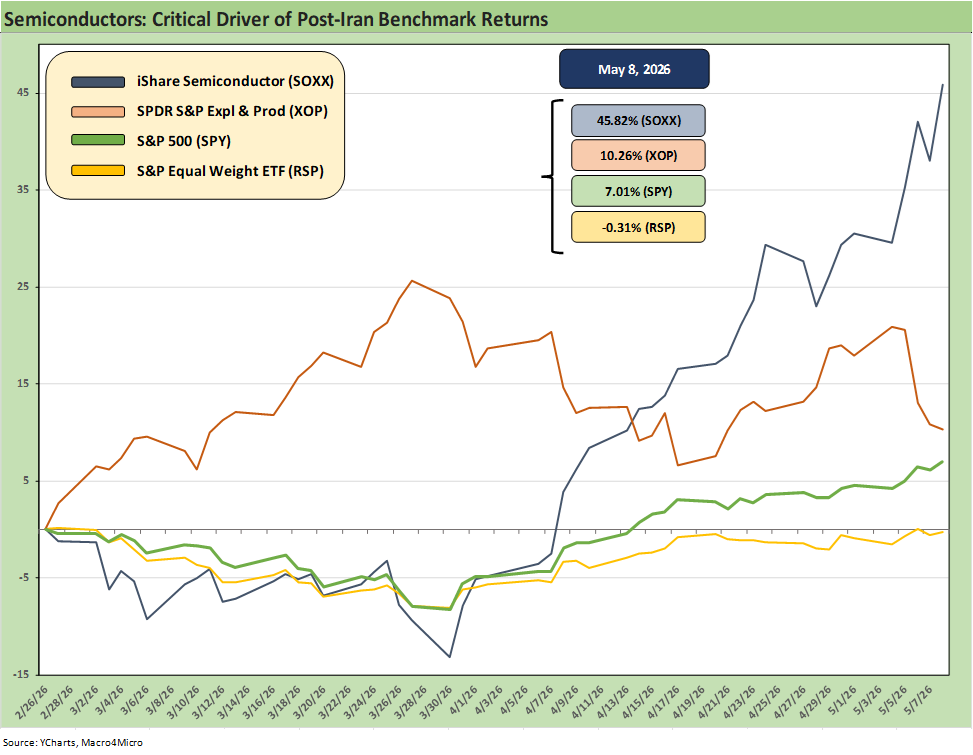
The chart details the run rate in total returns for the Semiconductor Index (SOXX) set against the S&P 500 ETF (SPY) and the Equal Weight S&P 500 ETF (RSP). For good measure, we include the E&P ETF (XOP) as a group rewarded by the spike in oil. The timeline covers the period from late Feb (2-26-26) and $67 area WTI before the Iran War kicked into gear through Thursday close ($95 handle WTI futures).
Anyone outside of an isolation ward knows that tech broadly and semiconductors narrowly have been key drivers of benchmark returns in the rebound during the post-Iran period. The visual captures some of it. AI capex, data centers, and the boom in tech products and semi demand are charging ahead with an acceleration of volumes as the base case and not retrenchment. Solid 1Q26 earnings and AI capex guidance have added to the tailwinds in tech.
The 45.8% return by SOXX is a long way from the +10.3% on XOP, the -0.3% return on RSP, and the +7.0% on the S&P 500 as of Friday’s close. That timeline rounds up to around 10 weeks. The chart offers a good visual on how SOXX soared after an ugly March while RSP stalled and the S&P 500 was muted but favorable.
The E&P sector will stay volatile wrapped around the “I am at war, I am not at war” information/disinformation exercises by the White house. A blockade is an act of war under international law. Referring to smaller exchanges of fire as “trifles” and “love taps” in a “ceasefire” is an obvious strategy to avoid War Powers Act challenges.
There has been more than a little commentary on the return to a lack of breadth driving headline equity returns. A subset of the equity market has dominated the move higher in the NASDAQ and for the S&P 500 with the heavy weightings in tech. That is great news for headlines and “record highs” in the large cap indexes and especially for those who are long the winning tech names. It helps if they light (or short) the losing side of tech subsectors getting beaten down such as software and SaaS-based service companies.
A big question will be what that concentration means for relative risk in the markets. Disappointment could be painful on the downside if the AI and chip trade falters and Iran fallout flows into cyclical expectations. The “cyclical vs. secular” debate is not a new one, but this is the most intense version since the late 1990s. A sustained move higher in oil prices would flow in FOMC odds and valuation parameters.
The rolling return visual
In the next section, we get into the details of the 32 ETFs and benchmarks for a mix of trailing periods. Below we offer a condensed 4-chart view for an easy visual on how the mix of positive vs. negative returns shape up. We see it as a useful exercise in looking for signals across industry groups and asset classes.
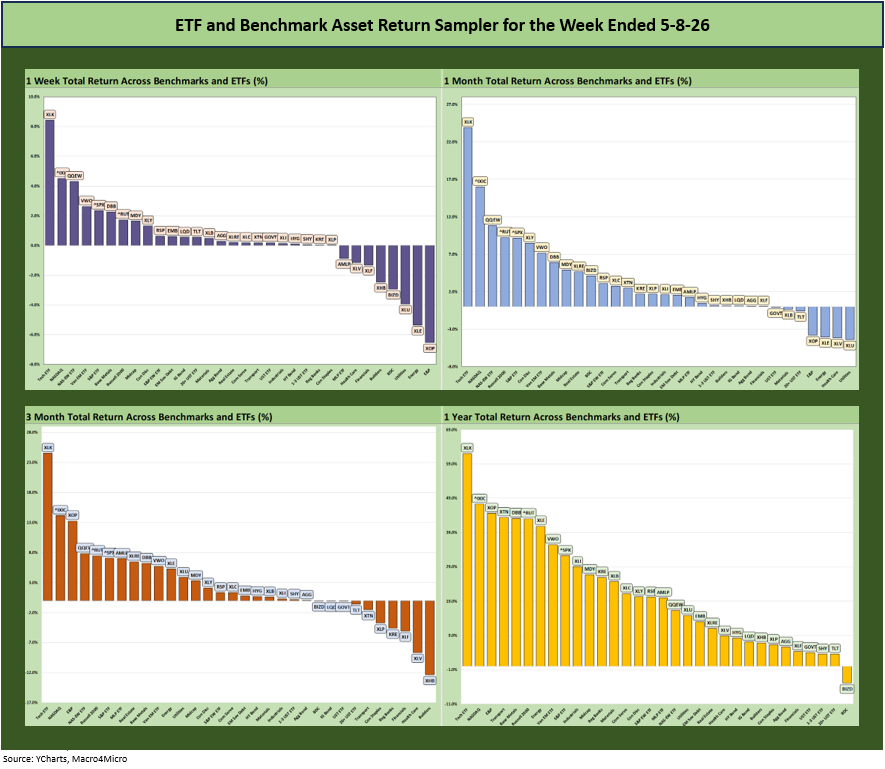
The symmetry of returns remains very much on the positive side as highlighted in the visual pattern above, but the exceptionally strong performance of tech and relative weighting has tended to push the broader market benchmarks (notably NASDAQ and S&P 500) into the top quartile across recent timelines. Even the performance of Russell 2000 has been influenced as small caps have been consistent top quartile performers in recent periods despite financials and industrials being a bigger factor for the Russell 2000.
The Magnificent 7 heavy ETFs…
Some of the benchmarks and industry ETFs we include have issuer concentration elements that leave them wagged by a few names. When looking across some of the bellwether industry and subsector ETFs in the rankings, it is good to keep in mind which narrow ETFs (vs. broad market benchmarks) get wagged more by the “Magnificent 7” including Consumer Discretionary (XLY) with Amazon and Tesla, Tech (XLK) with Microsoft, Apple, and NVIDIA, and Communications Services (XLC) with Alphabet and Meta.
The “Mag 7+3” can be considered a key part of the tech drivers when Broadcom (AVGO), Oracle (ORCL) and Taiwan Semiconductor (TSM) are added to the mix. Those market cap rankings have been moving around across the months, and the growth in names such as Micron ($842 bn market cap this week) may require some new grouping and tag lines as 2026 proceeds. Oracle is more a software and systems company (ORCL is a holding in the Software ETF, IGV), has been volatile and fallen off the pace. Taiwan Semi has been consistent, and Broadcom also is comfortably in “the trillion plus club” at this point while Oracle materially fell off the pace the last 6 months.
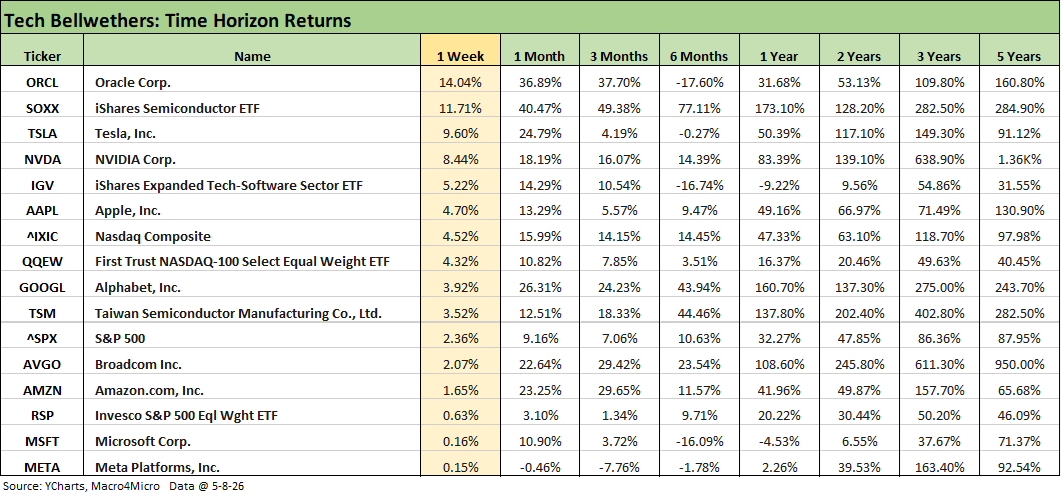
The tech bellwethers weighed in with all positive this week with Oracle at #1 mounting a comeback from its negative running returns over 6 months. As highlighted in an earlier chart, the Semiconductor ETF (SOXX) has been soaring and added another 11.7% this week to its 40.5% month and 173% trailing 1 year.
Meta (META) remains on the dog list as one of the underperforming Mag 7 names with negative returns over 1-month, 3-months, and 6-months and only +2.26% over 1 year. Microsoft (MSFT) has similarly struggled in the software camp with a negative return over 6 months and 1 year.
The commentary below is a cut-and-paste from our post on LinkedIn with some edits:
The group of 32 benchmarks and ETFs we monitor posted a score of 24-8 with a major performance differential between the tech-heavy top quartile and negative returns in the bottom quartile.
The broader market benchmarks got a lift as earnings season gradually winds down with tech influence serving as a big driver of headline index performance. We see the NASDAQ, S&P 500, Russell 2000, and Midcaps S&P 400 (MDY) all in the top quartile. Even the Equal Weight S&P 500 (RSP) was in the upper end of the 2nd quartile. Tech has done so well that the RSP ranking this week might lull one into a sense of market breadth, which is clearly not the case as of the end of the week.
We cover the booming tech sector performance – notably in semis – in a separate “Tech Check” return post to follow in this commentary. The performance of the Tech ETF (XLK) is way ahead of this group this week with NASDAQ at #2, the Equal Weight NASDAQ 100 ETF (QQEW) at #3, and the tech-heavy S&P 500 at #5 with only the Emerging Market ETF (VWO) breaking up a tech sweep in the top 5.
With the on-again, off-again Iran War and ceasefire disinformation and “status report” sleights of hand, oil has swung wildly. The upstream E&P ETF (XOP) and diversified Energy ETF (XLE) can rebound and plunge each week with the latest swing in oil prices. For this week, XOP returns came in last with XLE just ahead of it. The return on the Midstream ETF (AMLP) was also in the bottom quartile but at the upper end. WTI ended the week at just over $95 per bbl after closing last Friday at just under $102.
All the bond ETFs were slightly positive this past week, but FOMC handicapping will get a test this coming week with April CPI and PPI releases. The payroll numbers beat expectations this past week and JOLTS were mixed (see Employment Situation: April 2026 5-8-26, JOLTS March 2026: Openings Down, Hires Up, Layoffs/Discharges Up 5-5-26).
The payroll mix was suboptimal and the direction of jobs in manufacturing remained negative for the month and even more in the red YoY. The payroll adds remain dominated by “health care and social assistance” and “leisure and hospitality.” That is not exactly the high multiplier effect jobs and reshoring theme pitched by the tariff strategy.
The question around FOMC flexibility looks like it will come down to oil prices unless jobs face some major setbacks. Oil and inflation has a history in the US that borders on being a deep scar from the late 1973 to early 1975 stagflation period and the 1980-1982 stagflation double dip.
The commentary below is a cut-and-paste from our post on LinkedIn with some edits:
The weekly Tech Check for tech equity price returns highlights another extraordinary week for semiconductors and the headline chip stocks. The pattern is consistent with recent weeks but we see a broader group with 20+% handle and even 30+% handle returns for the leaders during just a single week. The Hi-Lo range of over 46% is striking and especially when the bottom performer (Zillow) was only in single-digit negative range at -8.5%.
For the week, the positive-negative score was 26-6. The semis led the pack and numerous software and SaaS-based service names were again in negative range. This week’s performance in the top 4 names would be a good year for a typical stock with Micron (MU) at +37.7%, Advanced Micro (AMD) at 26.2%, Intel (INTC) at 25.4%, and Qualcomm (QCOMM) at +23.8%.
The bottom quartile is led by the same software and SaaS service players that have struggled badly with the “AI panic” on business models and AI displacement. The bottom quartile above includes 7 of 8 names that are in the bottom quartile YTD. We look at that mix in the broader asset return timeline in a chart further below.
On a YTD basis, the bottom quartile includes Adobe (ADBE) in addition to the above bottom quartile from this week – ex-Meta. Microsoft (MSFT) just missed the bottom quartile this week with META the only Mag 7 names in the bottom tier. On a YTD basis, MSFT just missed the bottom quartile by a single notch.
A notable miss from the top quartile this week was NVIDIA (NVDA) at the top of the 2nd quartile. As such a highly visible name and arguably the leader of the boom, it is notable that NVDA’s YTD return only ranks #13 in the above group just behind Amazon (AMZN) and ahead of Russell 2000 in the rankings.
The Mag 7 were spread around the weekly quartiles again this week with Tesla (TSLA) in the top quartile, NVDA and Apple (AAPL) and Alphabet (GOOGL) in the 2nd quartile, MSFT in the 3rd quartile, and META in the bottom. The NASDAQ was in the 2nd quartile of this mix with the S&P 500 and Russell 2000 with Midcaps in the 3rd quartile.
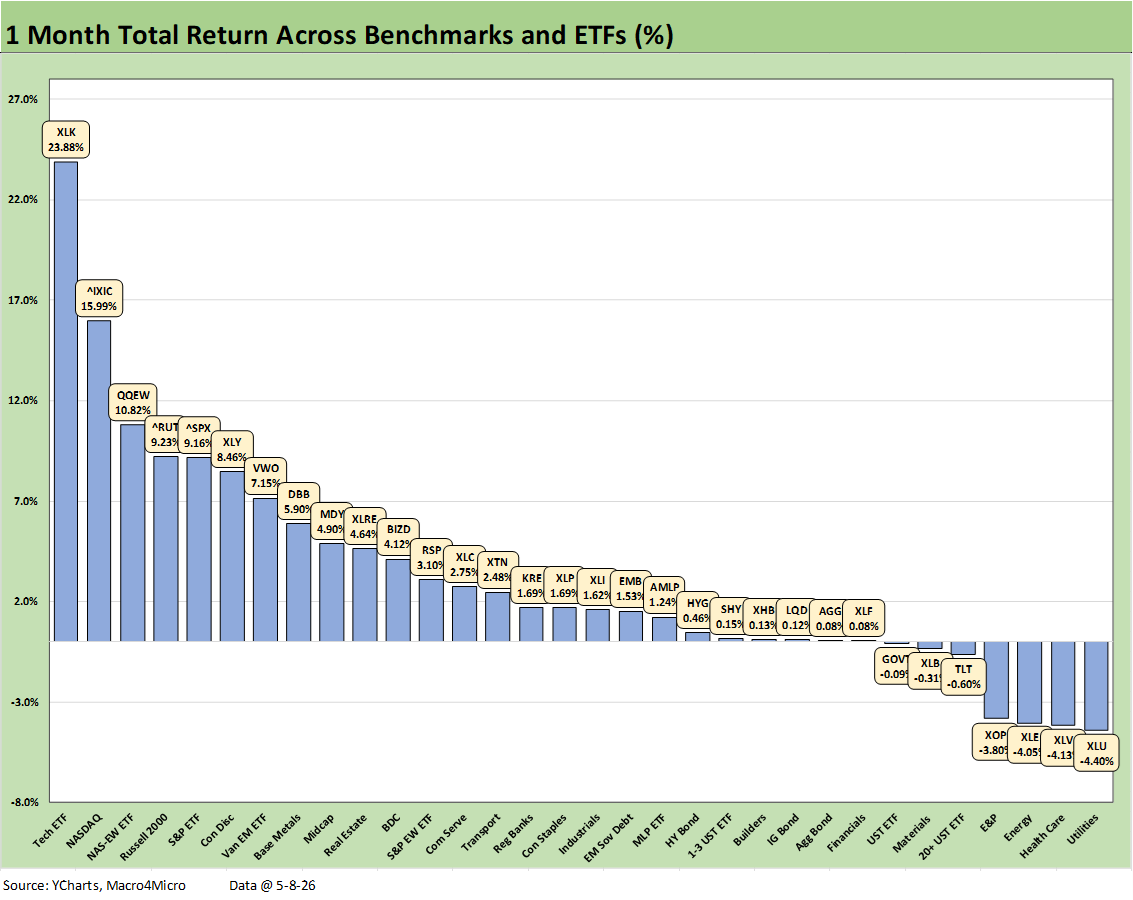
The rolling 1-month period for the broad mix of assets and sector ETFs posts a 25-7 positive vs. negative score. We see a mixed bottom tier showing some adverse moves in duration and slightly lower oil prices over the timeline. As we look across these performance charts and timelines, the main events for the outperformers are the tech rallies with some side stories on select industrials and energy related names.
We see NASDAQ, S&P 500, and even Russell 2000 get some tech lift from earnings season support with 4 of the top 5 being about tech (XLK, NASDAQ, QQEW, S&P 500) with arguably 5 of the top 5 with tech also an important contribution to small cap performance.
The Industrial ETF (XLI) fell off the pace this month while Consumer Discretionary (XLY) made a move back into the top quartile. Consumer Discretionary (XLY) had a banner month from its outsized holdings in Tesla (TSLA) and Amazon (AMZN) as we cover in the separate Tech Check details for the trailing 1 month. With consumers under a cloud right now, the XLY mix showed a fair amount of dispersion in the returns of the major holdings with names such as Home Depot, TJX, McDonald’s, and Lowes struggling but some positive surprises (e.g. Starbucks).
Where the UST curve and inflation go from here along with FOMC policy is intertwined with the obvious wildcard – oil. The market also has a little more confidence that a deal will get struck and Trump’s priority is to avoid boots on the ground (after all, the “war is over”). We see the UST ETF (GOVT) in the bottom quartile in the red zone along with the long duration 20+Y UST ETF (TLT). For this measurement period, we also see the Energy ETF (XLE) and E&P ETF (XOP) along with Materials (XLB) in the red.
In terms of the Iran War risks in recent weeks and what lies ahead, more dramatic strategic errors in this misadventure and erratic strategy could bring more problems. The risk to avoid is massive escalation that further damages the Gulf infrastructure and exacerbates supply chain stress. More aggression or stalling could keep the Strait shut for even longer.
The risks are not hard to speculate about where escalation pulls in the Houthis and slams the Red Sea routes shut. That scenario is almost as obvious as was closing the Strait if Iran was attacked in the first place. Other outlying escalation mistakes would be those that could trigger Iraqi Shiite militia, prompt China to become a more active supplier to Iran, and statements that could lock the door on EU support to the extent anything can even be gained at this point.
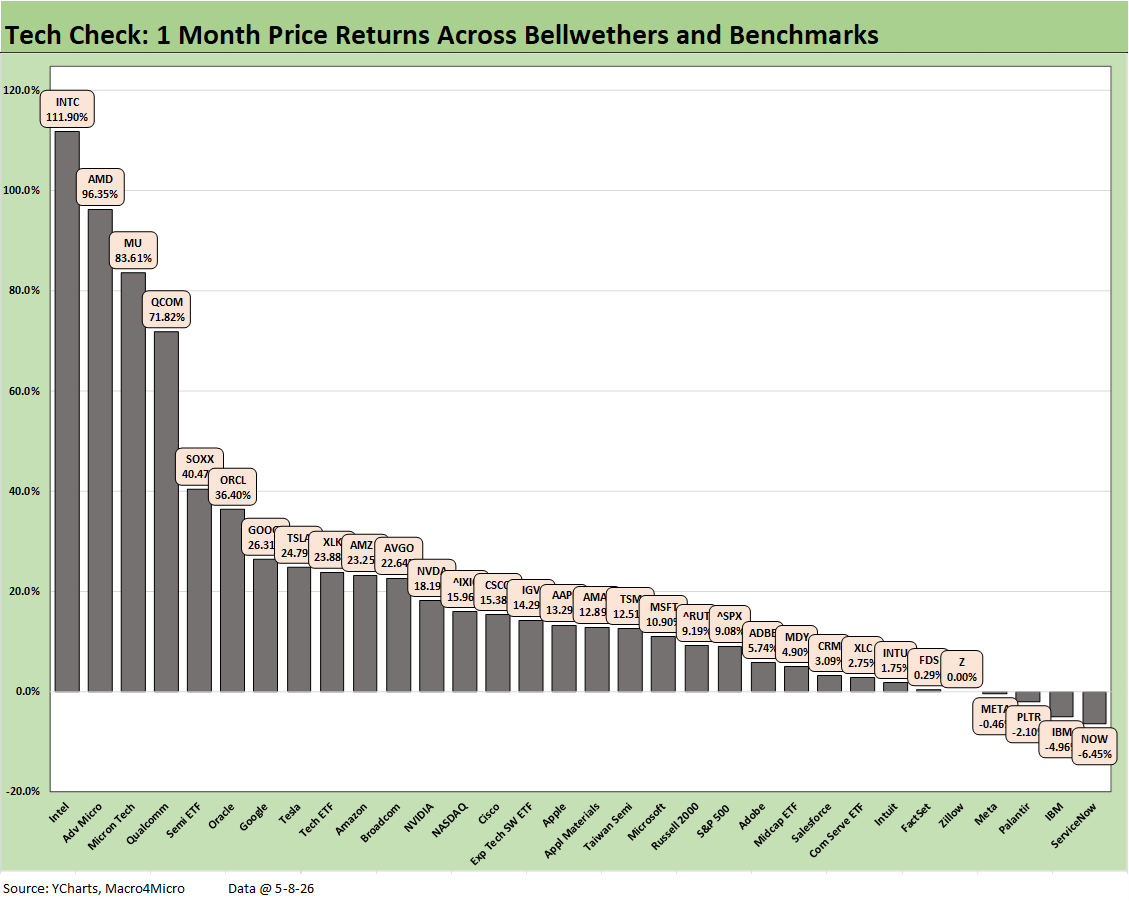
The 1-month Tech Check is consistent with the trends discussed in various charts herein and in recent weeks, but the past week was especially impressive right up to the rally on Friday as discussed earlier. The score for this mix over the past 1-month timeline was 28-4.
The bottom 3 are familiar names in the bottom tier in negative with ServiceNow (NOW), IBM, and Palantir. We discussed Meta in other charts herein. The weakest performers on this list are consistent with what we see YTD with software getting pounded and SaaS business models being revalued.
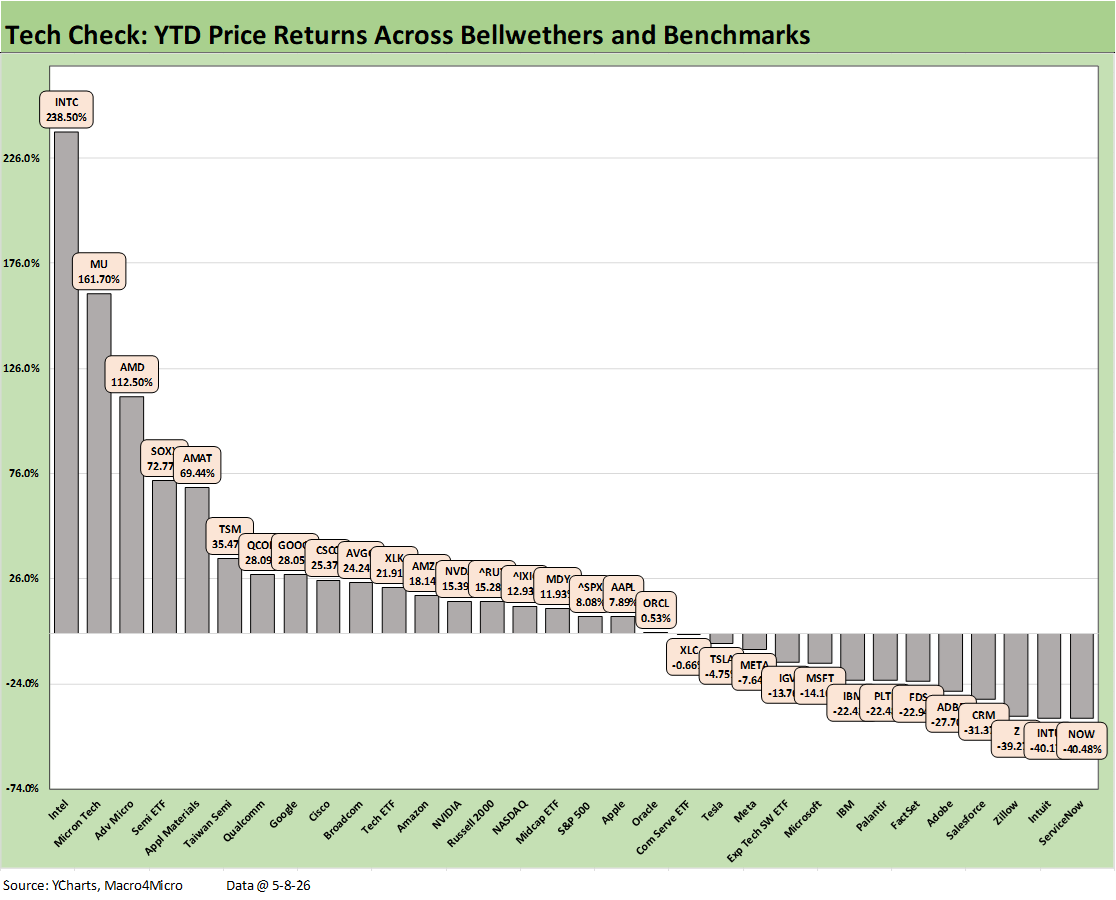
The YTD Tech Check continues to be an eye opener with the software and SaaS service slaughterhouse very much in evidence on the right side of the chart. The positive vs. negative score of 19-13 also brings an outsized Hi-Lo differential of 279 points. Throw out the Hi and Lo and you still get 202 points. That is over less than 5 months of returns. It took 28% to make the top quartile YTD. The median return YTD in this group is 10% and then drops off sharply.
The bottom quartile runs from IBM at -22.4% down to ServiceNow (NOW) at -40.5% as the AI panic has hit software companies and SaaS-based service operators hard and even business viability questions have been raised even beyond just price, volume and margin challenges. Those sell-offs are as speculative as some of the multiples and growth rates applied to AI and the supplier chain. The pain for software et al. is the flip side of the AI optimism.
We have already looked at the return home runs for semiconductor names that dominate the top quartile. The run rates right now are impressive as evident in the latest quarterly earnings reports, so that part of the equation is not speculative and is very much in the “now” category.
For the Mag 7, we see Alphabet (GOOGL) in the top quartile. Amazon (AMZN) and NVIDIA (NVDA) are in the 2nd quartile, and the remaining 4 (AAPL, TSLA, META, MSFT) in the 3rd quartile.
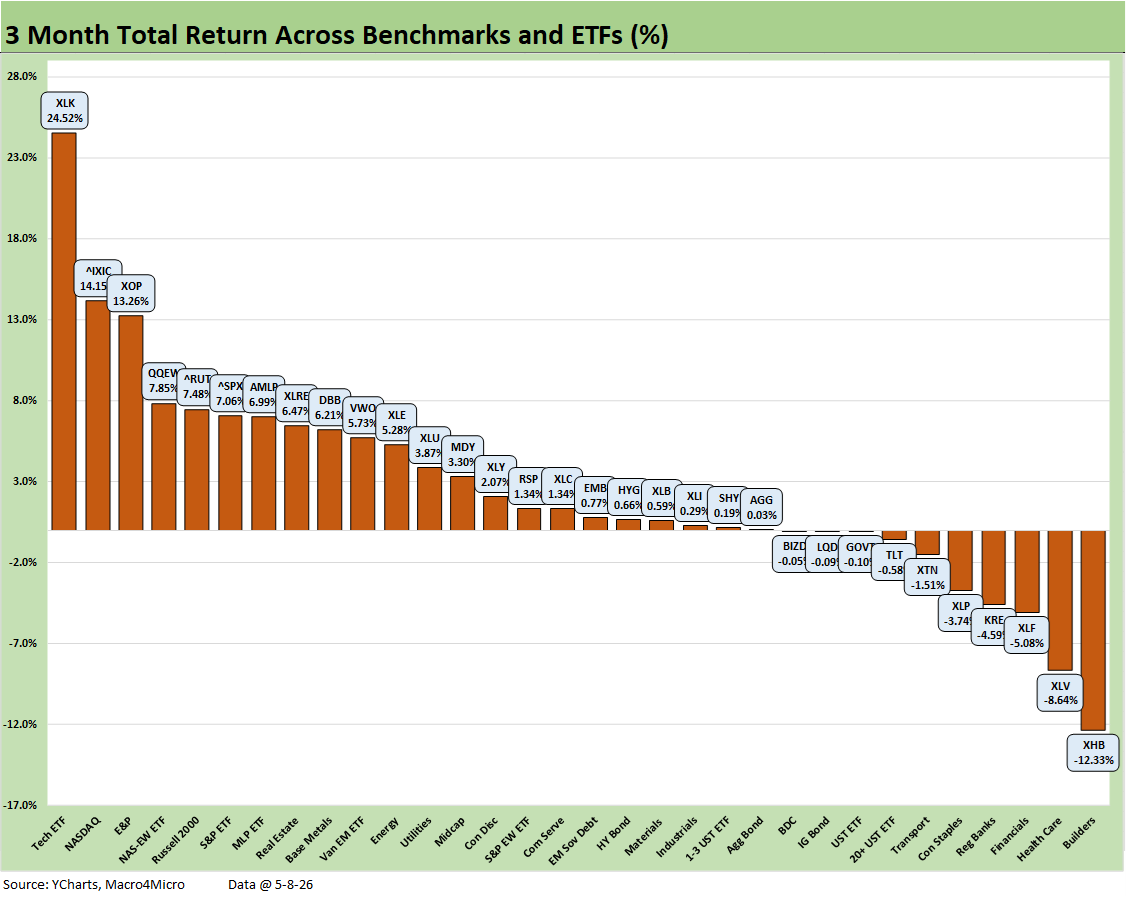
The 3-month return timeline above covers the broader range of 32 benchmarks and ETFs, and we see a score of 22-10. The 3-month horizon starts before the Iran War. Interest rate sensitive assets took a hit. Adverse duration impacts saw negative return for the UST ETF (GOVT), the long duration 20+Y UST (TLT), and IG Corp ETF (LQD). Homebuilders (XHB) suffered on mortgage rates shifting into a range over and under the 6.5% line (using Mortgage News Daily surveys).
Financials (XLF) and Regional Banks (KRE) have had mixed results and are negative in the chart. The market could be experiencing a mix of doubts on the direction of interest margins (FOMC easing) and be considering questions on asset quality (notably private credit but also consumer loans and mortgages). Some in the market could feel a sense of cyclical worry that can come with the Iran War fallout and raise legitimate questions on future loan demand and consumer spending.
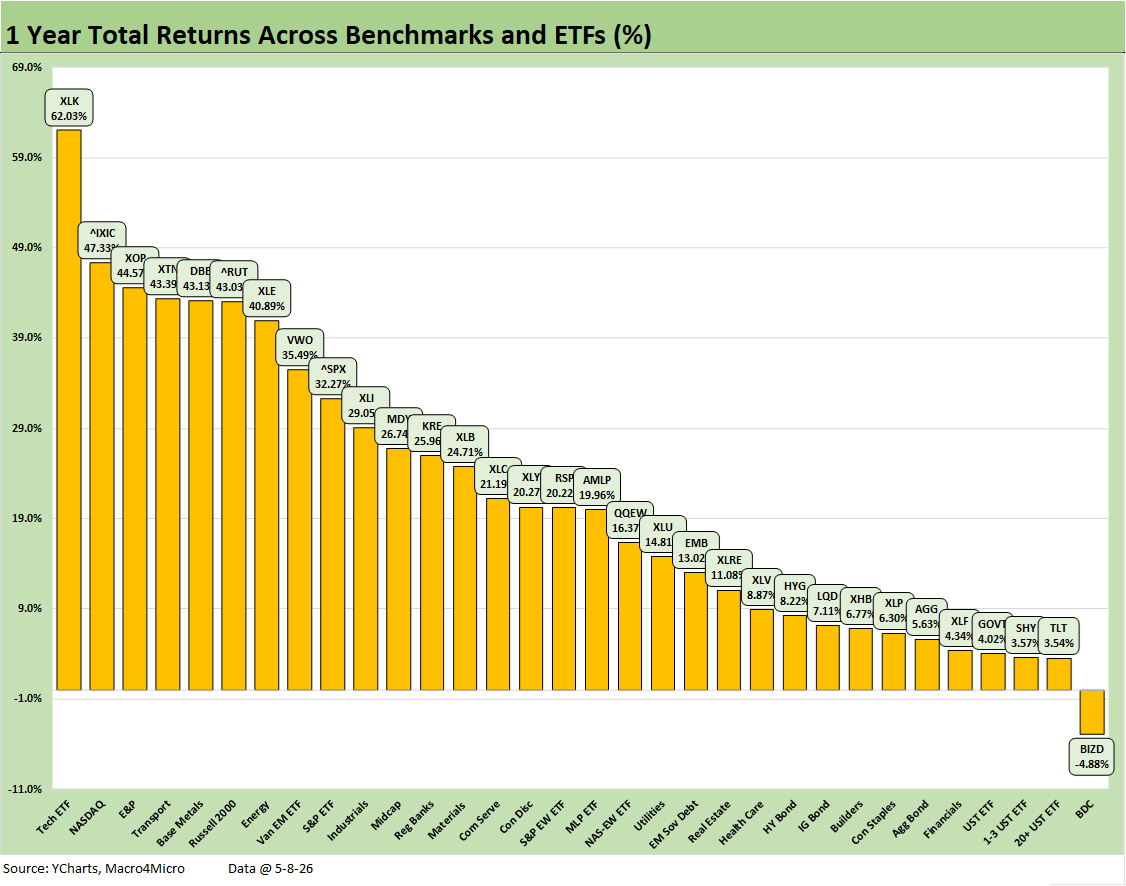
The 1-year timeline remains uninterrupted at 31-1 with only the BDC ETF (BIZD) in the red. We see 4 of the 7 bond ETFs in the bottom quartile but posting positive numbers. The credit-based bond ETFs (LQD, HYG, EMB) made it into the 3rd quartile.
The strength of equity markets the past year is evident in the fact it took 35.5% to make the top quartile. The median return across the 32 asset lines is 20% and that is around 2x the long-term return on the equity asset class.
The valuation debates (excess or fair value), “calling the top,” and discussing breadth (tech domination, etc.) will stay busy, but there is no denying a strong trailing year. The fact that the S&P 500 back in 2007 pushed right through the summer 2007 credit paralysis (with hedge funds starting to blow up and Countrywide starting to spiral in need of a rescue) and the NASDAQ posting up +86% in 1999 are there for past vs. prologue debates that always unfold.
Many have pointed out that “credit leads” and that is also clear in past blowups. That is why the more bearish are looking to private credit as the signal. The pushback on credit theories is the current credit strength of the tech sector names and also dramatically less derivative excess and credit counterparty exposure this time around and a sound financial system.
For our part, we do not view private credit as the “pin in the grenade” despite the usual sloppiness when demand for assets exceeds the ability to properly price and evaluate assets in the context of fee hunger and “business building” to maximize AUM. That is a well-traveled trail and at least partly the case now. “Revenue line syndrome” is a constant across emerging asset classes and credit cycles. Dodd-Frank did not eliminate that; it just moved to a new home away from the banks. Those are discussions for other days.
See also:
Employment Situation: April 2026 5-8-26
New Home Sales March 2026: Favorable Volume, Weaker Prices 5-5-26
JOLTS March 2026: Openings Down, Hires Up, Layoffs/Discharges Up 5-5-26
Market Commentary: Asset Returns 5-4-26
PCE Inflation, Income & Outlays March 2026: Inflation Anxiety Level? 5-3-26
1Q26 GDP Advance Estimate: Consumer Fade, Investment Boom 4-30-26
Market Commentary: Asset Returns 4-26-26
Synchrony Financial: Favorable Consumer Credit Signals 4-24-26
Industrial Production March 2026: Mixed Picture, Big Questions Ahead 4-16-26
Existing Home Sales March 2026: New Beginnings or New Ends? 4-15-26
Producer Price Index March 2026: Heater or Curve Ball? 4-14-26
CPI March 2026: The CPI Cycle Could Prove Maddening 4-12-26
4Q25 GDP: More Adverse Revisions in the Golden Year 4-9-26
The US as an Aspiring Emerging Market: Fiscal SNAFU, Political FUBAR 4-6-26
Employment Situation March 2026 4-4-26
Payroll Focus: ADP Highlights March 2026 4-1-26
JOLTS Feb 2026: Openings Down, Hires Down, Layoffs Up 3-31-26
UST Deltas: Elevation Realities 3-29-26
Market Lookback: Confusion Reigns, Dislocation Pours 3-22-26
New Homes Sales Jan 2026: The Nays Carry 3-19-26
Market Lookback: The Gulf of Cause and Effect 3-15-26
Housing Starts Jan 2026: Total Starts Up, Completions Up, Permits Down 3-12-26