
Market Commentary: Asset Returns 4-26-26
Other than the risk of hot wars, cold wars, trade wars, and domestic election violence there is little to worry about.


Hormuz negotiating team. Plan B.
Another oil spike this past week is tied to “blockading the blockade” as it sent WTI back above $94 by Friday close from below $83 the prior Friday close. The supply shock and supplier chain fallout now are open-ended with no defined deadline and a stalemate that keeps the lag effects of the supply shock stacking up.
The focus on “record NASDAQ” and “record S&P 500” on Friday led the headlines with a mixed tech rally favoring semiconductors vs. SaaS/software names that left numerous subsectors still in a negative zone for software and SaaS services.
The week ahead tees up the advance estimate for 1Q26 GDP after a very weak set of 4Q25 numbers and growing uncertainty around how long the consumer sector can absorb the headwinds (see 4Q25 GDP: More Adverse Revisions in the Golden Year 4-9-26).
The market will see 5 of the Mag 7 report this week (AMZN, GOOGL, MSFT, META, AAPL) with the Personal Income and Outlays report bringing a read on PCE inflation and how aggregate consumer spending is holding up vs. disposable income. Ford and GM as auto bellwethers will bring some color on the spring selling season, tariff impacts, expected fallout from Iran, and any updated color on EV strategies in the new world of Trump policies.
The FOMC meeting is likely to be the swan song press conference for Powell after Pirro (of Fox personality fame who was appointed by Trump to the Washington DOJ) “sort of” dropped the investigation of Powell in her usual dubious fashion. The statement included a veiled threat to reopen the case. Given the lack of evidence, a competent DOJ could clear up the case now. The judge already found “essentially zero evidence.” As we go to print, Tillis has indicated over the weekend that Pirro’s questionable statement cleared the bar and he will advance Warsh.
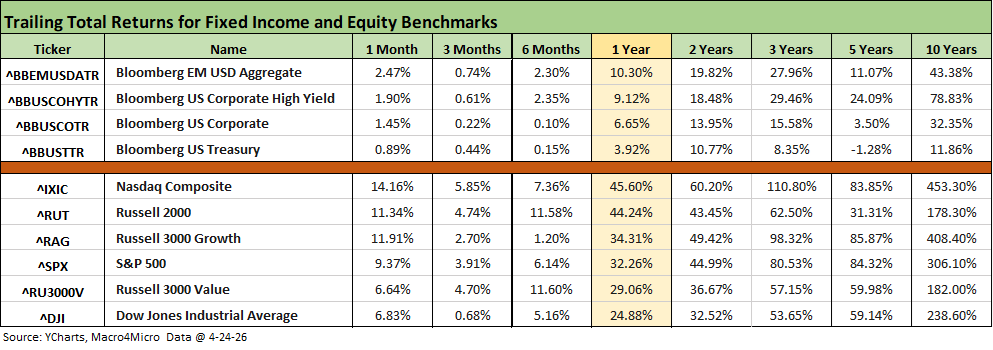
The above table breaks out the various timeline returns for the high level equity and bond benchmarks we monitor. Equities show a very strong month on the way to all positive numbers for 1, 3, and 6 months after some earlier rough patches post-Iran that generated a wave of negative numbers in March (see Market Commentary: Asset Returns 3-30-26).
The equity market rebound was capped off with record highs Friday for the S&P 500 and NASDAQ as the market is looking past the Hormuz stand-off and putting the bombing and Iranian wildcard in the rear-view mirror. That is a leap of faith embracing a rational and constructive outcome during a period of the irrational and destructive.
The rolling return visual
In the next section, we get into the details of the 32 ETFs and benchmarks for a mix of trailing periods. Below we offer a condensed 4-chart view for an easy visual on how the mix of positive vs. negative returns shape up. We see it as a useful exercise in looking for signals across industry groups and asset classes.
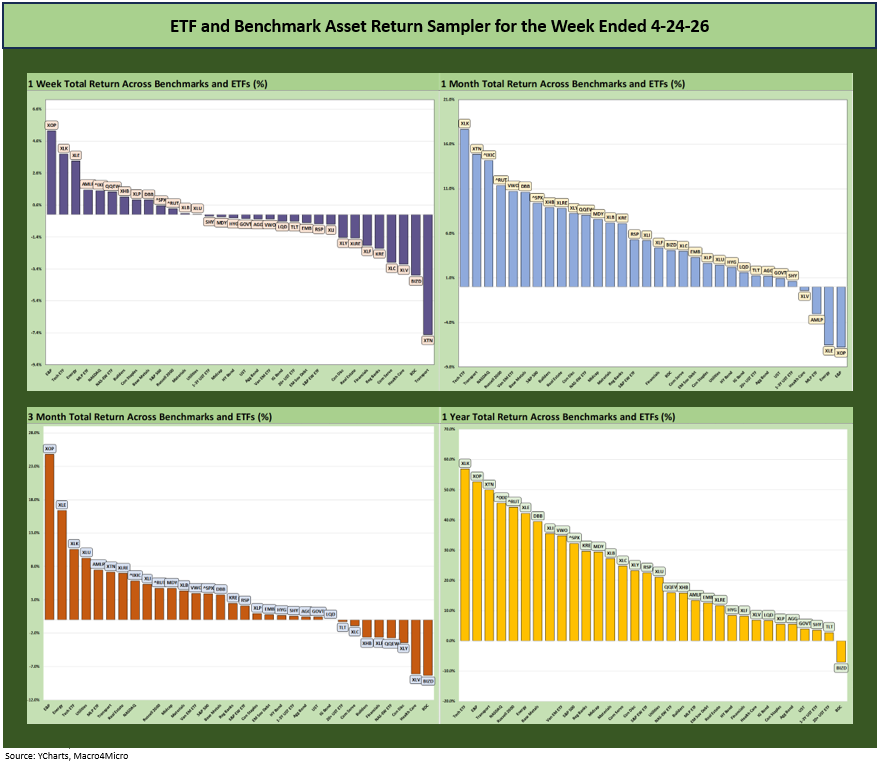
The symmetry of benchmark and ETF returns across the above time horizons showed a week biased to the negative side as covered further below. The 1-month, 3-month and LTM periods show a much healthier mix with tech still strong on balance in 2026 and some benefits of sector rotation after tech multiples went to such lofty levels. The market then saw a combination of cyclical comfort or at the very least “recession avoidance” despite lower GDP and soft payroll. Solid earnings expectations in 1Q26 narrowly and 2026 overall has been a tailwind.
The Magnificent 7 heavy ETFs…
Some of the benchmarks and industry ETFs we include have issuer concentration elements that leave them wagged by a few names. When looking across some of the bellwether industry and subsector ETFs in the rankings, it is good to keep in mind which narrow ETFs (vs. broad market benchmarks) get wagged more by the “Magnificent 7” including Consumer Discretionary (XLY) with Amazon and Tesla, Tech (XLK) with Microsoft, Apple, and NVIDIA, and Communications Services (XLC) with Alphabet and Meta.
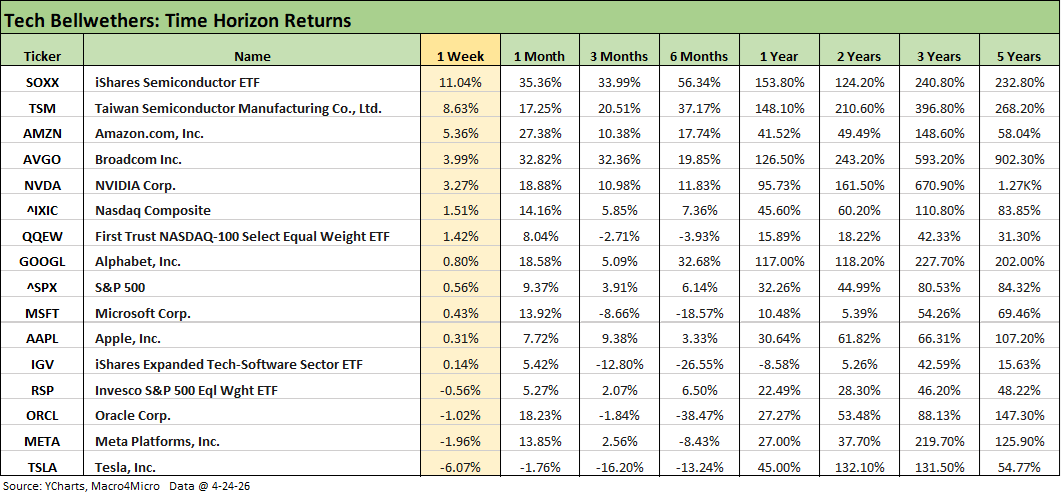
The above chart updates the tech bellwethers and useful broad market indexes and ETF comps across a wide range of time horizons. We cover more single tech names and subsectors in our “Tech Check” charts further below, but these names include the Mag 7+3 (the “3” being Broadcom, Oracle and Taiwan Semi).
The Semi ETF (SOXX) took the top spot by a comfortable margin led by big numbers from a range of chip players on the week as broken out in the “Tech Check” returns below. Among big winners this week were Intel (INTC), Taiwan Semi (TSM), Texas Instruments (TXM), and Advanced Micro (AMD) among others.
The commentary below is mostly a cut-and-paste from an earlier post on LinkedIn on Saturday with some additional input:
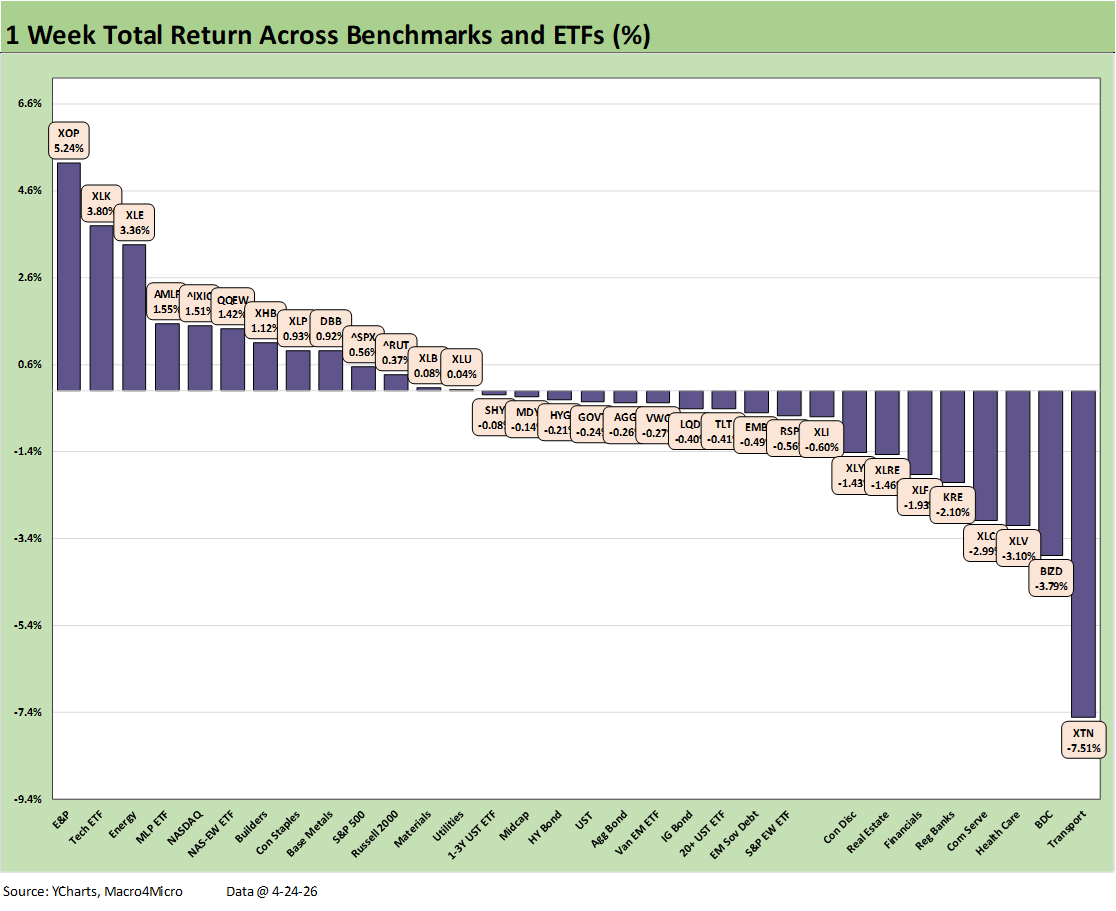
The weekly return chart for the 32 benchmarks and ETFs we track are more mixed than might be assumed with headlines citing all-time highs for the S&P 500 and NASDAQ to close Friday. The chart shows 13 positive and 19 in negative range for the week.
A good start to the earnings season was not enough to fully offset setbacks in the Strait of Hormuz. The S&P 500 hit a record on a modest weekly gain that saw 5 of the 11 S&P sectors positive and 6 negative. Tech excitement bolstered the large caps as we cover in the separate weekly Tech Check review.
There is no end in sight for crude oil uncertainty, and the reverberating supplier chain disruptions linger from chemicals (e.g., fertilizers) to base metals (notably aluminum) and numerous other key supplier chain links.
The carefully crafted (sarcasm alert) blockade response to the blockade is getting bad reviews in the world of geopolitics and in domestic politics (sycophants excluded). More significantly, the open-ended closure is getting a bad review in the world of supply and demand as threatening lag effects loom. WTI moved from $82.59 last Friday to $94.40 this Friday. Energy ETFs made the top quartile with the E&P (XOP) at #1, the Energy ETF (XLE) at #3, and Midstream (AMLP) at #4.
The Tech ETF (XLK) held down the #2 spot with the NASDAQ at #5 and the Equal Weight NASDAQ 100 ETF (QQEW) at #6. The Friday move in Intel (INTC) of +23.6% ($415 bn market cap) was a headliner with Advanced Micro (AMD) outperforming Intel for the week as both posted 20% handle returns.
In what might have been a surprise, the Homebuilder ETF (XHB) made the top quartile despite weakness in housing markets. We get housing starts released this week, but the industry backdrop did not preclude a strong performance by numerous building suppliers in the XHB. Large homebuilders were mixed, but bellwether names such as DR Horton and Taylor Morrison were both positive in what will be a mixed earnings season for builders.
Sitting on the bottom of the returns was the Transports ETF (XTN), which is the flip side of the strong energy performance. For XTN, diesel costs and jet fuel will remain major problems that will hit airlines and challenge freight and logistics companies. Volume fears also weigh on cyclical sentiment. The Transport ETF (XTN) company mix posted a wide range of returns across the various business line concentrations.
We saw the BDCs (BIZD) post another negative week as the forward calendar will bring a lot of BDC reporting details to the market to help frame where the generalizations end and more nuanced details begin on private credit risks. Financials had a slow week with the Financials (XLF) and Regional Banks (KRE) both negative as the UST curve backed up and oil risk remains a recurring drag. All 7 bond ETFs were in the slight negative range.
The FOMC story line on easing is mixed. The Warsh hearings appeared to be a net perception negative on a lack of responsiveness and evasive, ambiguous answers. His refusal to answer simple questions like “Did you have any investments with Epstein?” or “Who won the 2020 election?” colored his partisan commitment. It would have been easier to say “no” (if it was “no”). That said, Warsh brings stellar qualifications even if it is clear to many that he will be a Trump servant. UST bulls hope that Warsh is smoother and more open and convincing with his FOMC voting peers than he was in his rubber stamp hearings. He will need to win over economists to get the easing votes. As we go to print, the FedWatch Oct FOMC meeting date shows a 68.9% chance of unchanged fed funds and 26.9% chance of 1 cut. The odds have been whipping around since Iran.
The commentary below is mostly a cut-and-paste from an earlier post on LinkedIn on Saturday with some additional input:
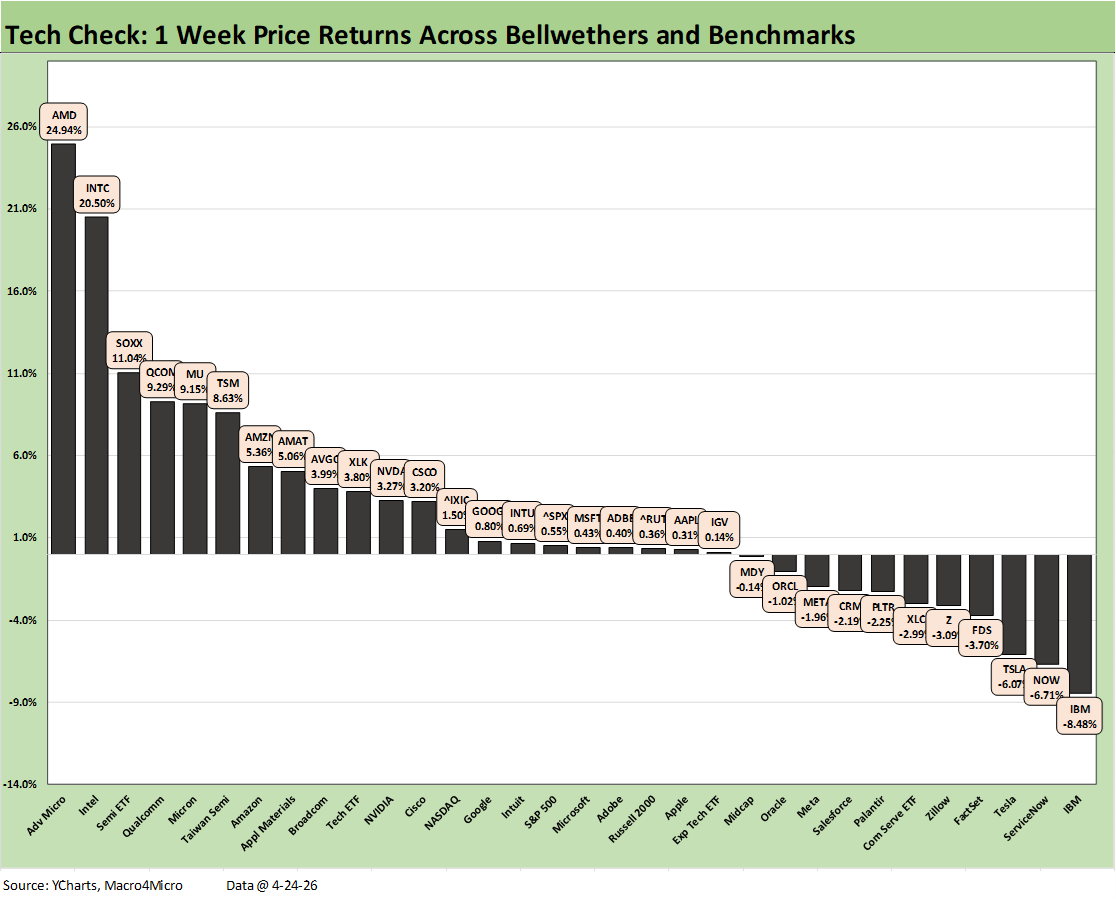
The weekly price return chart for the 32 market benchmarks and tech bellwethers show semiconductor names experienced an outsized rally week. We see a positive to negative score of 21-11 with semis leading the top quartile and software-related names clustered in the bottom quartile.
We see the Mag 7 names spread across the 4 quartiles with Amazon (AMZN) in the top quartile and Tesla (TSLA) in the bottom tier. The “Mag 7+3” posted 7 with positive returns and 3 negatives with TSLA, Meta (META), and Oracle (ORCL) in negative return range. The top performers across that group of 10 were Taiwan Semi (TSM) and AMZN in the top tier.
The big news on the week was Intel (INTC) earnings, which drove a monster rally on Friday of over 23%. As of Friday, that puts the INTC return for the trailing 1 year at +284% or over 9x the S&P 500. As a frame of reference, INTC’s struggle from May 2021 to 2Q25 saw around a -61% return vs. +48% for the S&P 500. INTC’s comeback is obviously impressive.
Headlines around massive layoffs at Amazon and Meta will keep payroll anxiety high in the tech sector after a serious bout of AI displacement jitters had been rising around the SaaS-heavy service operators. There is still a lot of concerns around how their business models will hold up under an expected AI onslaught that has richly rewarded the semiconductor names. The Semiconductor ETF (SOXX) was #3 on the week while the Software ETF (IGV) was able to edge into a slight positive return in the lower half of the 3rd quartile.
Software returns have presented a stark contrast with semis. Software faces a lot of bearish commentary from the equity markets and over in private credit. This week saw ServiceNow (NOW), FactSet (FDS), Zillow (Z), and Salesforce (CRM) in negative range in the bottom quartile. The bottom quartile of the “Tech Check” list for the YTD period is dominated by the SaaS-heavy services names with YTD returns running from -19% to -41% for the bottom tier. We detail that trend further below.
IBM reported earnings this week and returns were hurt again. IBM is an iconic legacy name cutting across a range of subsectors. IBM had a decent 1Q26, but IBM equity still ended up sitting on the bottom for the week at a -8.5% return. The market color was still more about the general anxiety effects the market has seen in services companies tied to potential AI fallout. IBM is in the bottom quartile for the week and over 1-month is in the red with the same for the YTD timeline.
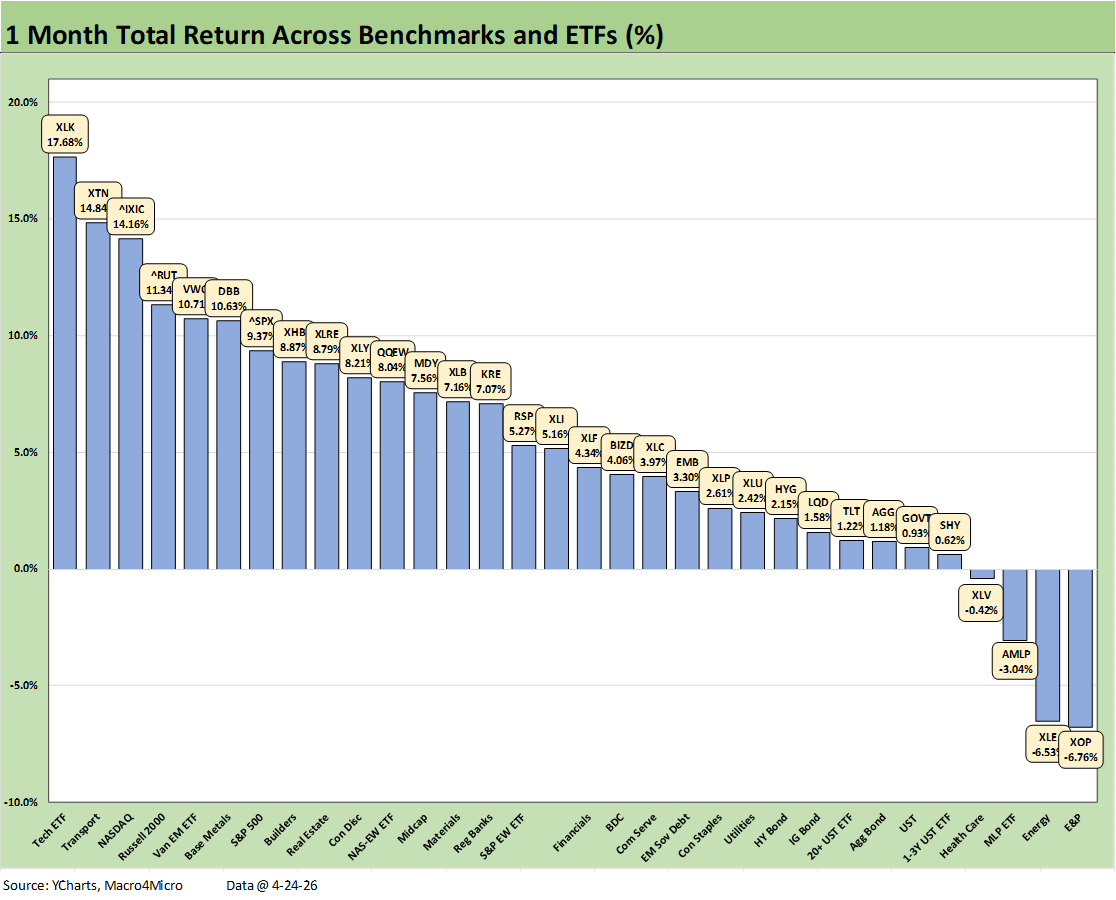
The 1-month score of 28-4 was a solid rally off the initial beating on Iran fears that spread to bonds, inflation risk, the consumer, and the cycle. FOMC second guessing gave way to some mild optimism that easing was more likely than tightening. We see the 3 energy ETFs on the bottom, as oil prices are lower now over that 1-month period even if still materially above the $67 WTI of late Feb 2026.
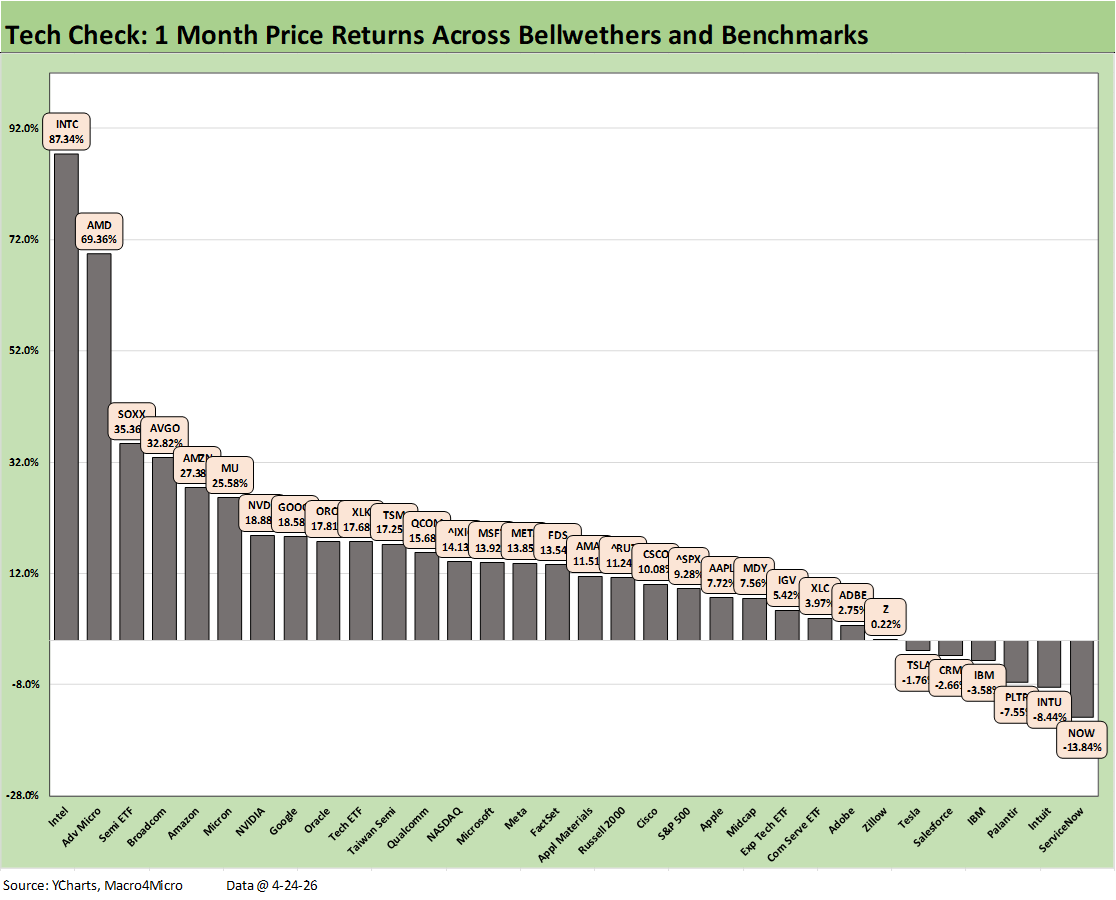
The 1-month Tech Check weighs in at 26-6. The bottom tier is dominated by SaaS-centric services operations and software exposure. The top quartile shows 5 semiconductor names and the Semiconductor ETF (SOXX) with Amazon and Aphabet. We see 3 of the Mag 7 in the top tier. Intel (INTC) and Advanced Micro (AMD) were off the charts followed by the SOXX and Broadcom (AVGO).
The worst performers again were comprised of the SaaS-based services and software names along with TSLA. The Software ETF (IGV) was back in positive return range but in the bottom half of the 3rd quartile.
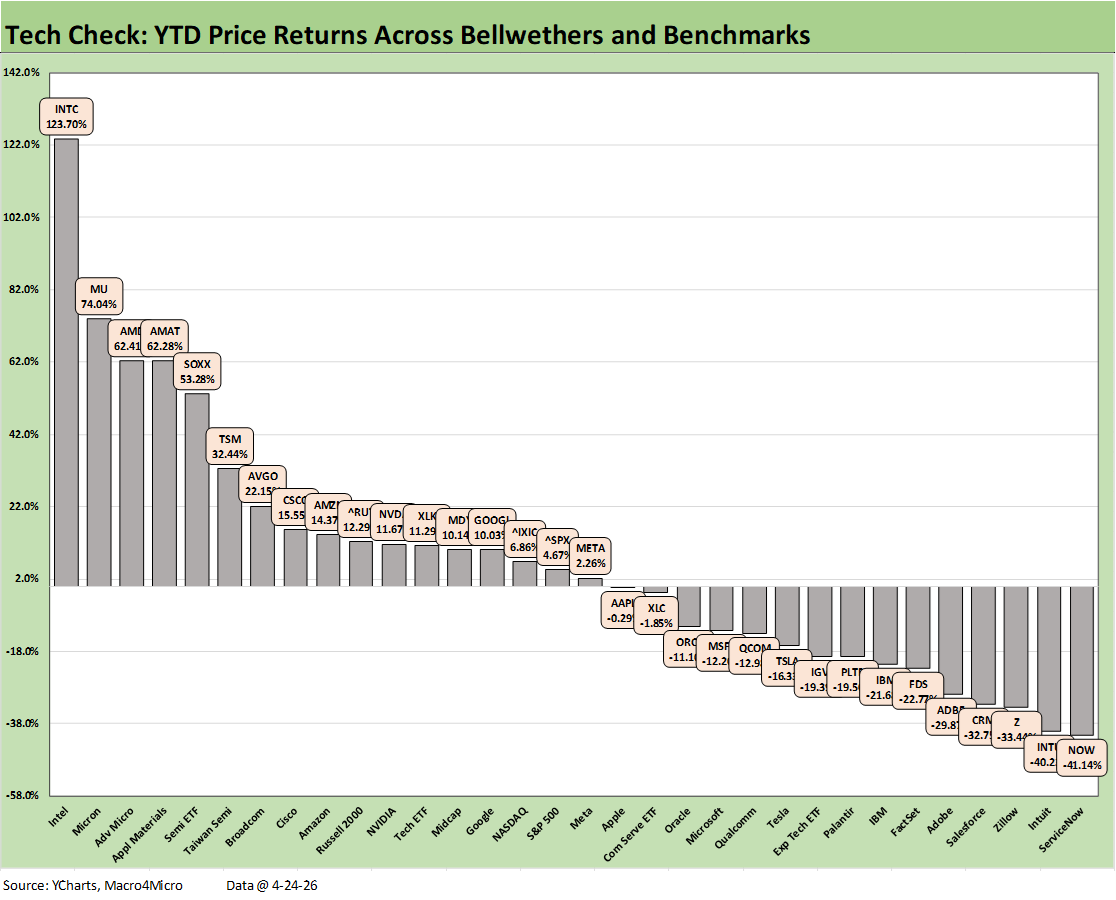
The YTD story in the Tech Check mix is staying the course of where we have been in recent weeks with Semis big winners and Software and SaaS names big losers. The overall score is 17-15. If we remove the broader market ETFs (S&P 500, NASDAQ, Midcaps, Small Caps), the score is 13-15.
The bottom quartile is dominated by names victimized by the AI mini-panic and threats to those business models. The bottom quartile is bracketed by a -19.5% return on PLTR to a low of a -41.14% return on NOW.
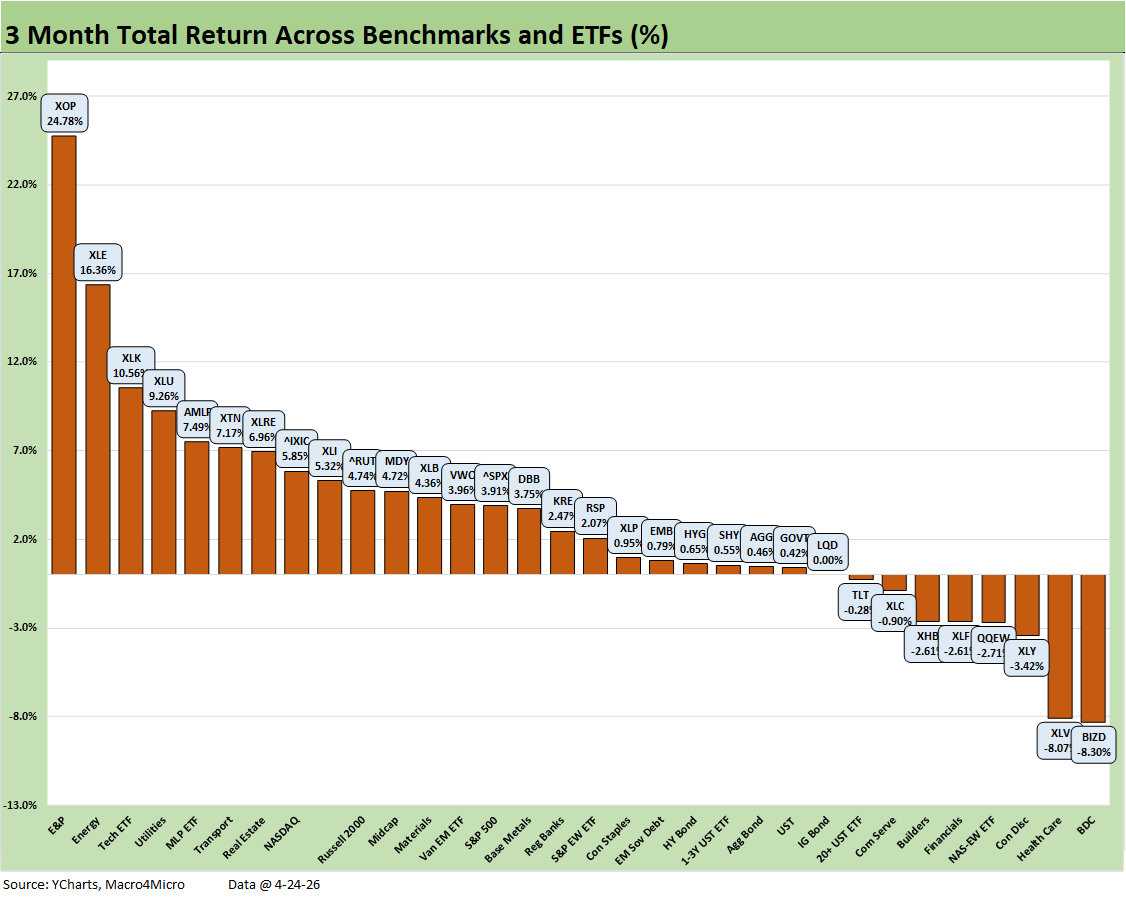
The 3-month timeline includes around 7 weeks of post-Iran turmoil with a score of 24-8. The bottom tier includes weaker performances by BDCs (BIZD) on the bottom and weakness in Financials (XLF) and Health Care (XLV). Homebuilders (XHB) also struggled while the long-duration UST ETF (TLT) was in the red. Some of the mixed tech equity behavior is seen in the weak numbers from Communications Services (XLC) and the Equal Weight NASDAQ 100 ETF (QQEW).
The winners were naturally led by energy assets and power (XOP, XLE, AMLP, XLU) with the Tech ETF (XLK) and NASDAQ in the top tier. We see 6 of 7 bond ETFs in positive range. While NASDAQ was the winner over 3 months, the Russell 2000 small caps ranked higher than the S&P 400 Midcaps and the S&P 500.
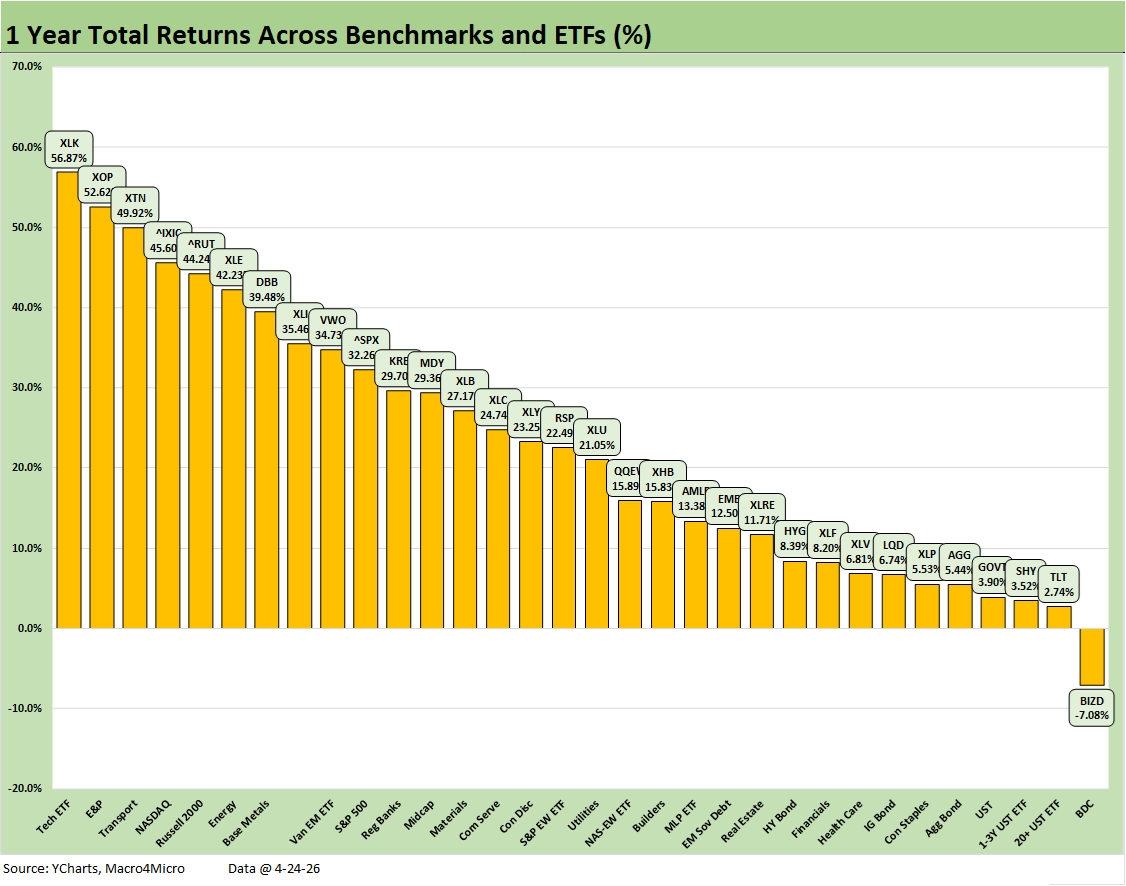
The LTM returns score of 31-1 drives home what a good run it has been for equities with the secular boom in some large cap emerging growth areas in tech (AI, Semis). The solid corporate sector earnings overall have been reassuring despite tariffs and weak GDP growth. An easing cycle and expectations of more Fed support has helped. The risks of tariffs and energy turmoil will test Fed policy direction and global growth.
Trade war risks loom larger now with so much enmity fostered with the EU and Canada tied to Trump policies. The Middle East and economic risks are the worst since 1973 when the main event was Israel vs. the “Arab nations.” This time the US is the critical driver of the next steps in the war (a blockade of Iran is an act of war under international law).
There are no easy solutions at this point. The choices of escalation or sustained energy and supplier chain chaos both could bring economic damage. Blaming the EU and/or NATO is absurd and only sets off more chain reaction economic risks. This one will be taught in the future in history classes and military academies around “what not to do” if you want an easy way out.
Nationalism looms large from China to Russia to North America at a time the NATO foundation is crumbling, and the US defense budget is rising by 50% with budgets already stretched. Financing it requires demand for dollars and UST, which is not an easy assumption.
Event-driven handicapping is never easy when geopolitical conflict is on the menu. For now, the markets just assume “we will get past this.” Iran, the Gulf “partners,” China, Russia, Ukraine, and trade partners like Canada and Mexico may see the world differently.
See also:
Synchrony Financial: Favorable Consumer Credit Signals 4-24-26
Market Commentary: Asset Returns 4-19-26
Industrial Production March 2026: Mixed Picture, Big Questions Ahead 4-16-26
Existing Home Sales March 2026: New Beginnings or New Ends? 4-15-26
Producer Price Index March 2026: Heater or Curve Ball? 4-14-26
CPI March 2026: The CPI Cycle Could Prove Maddening 4-12-26
4Q25 GDP: More Adverse Revisions in the Golden Year 4-9-26
The US as an Aspiring Emerging Market: Fiscal SNAFU, Political FUBAR 4-6-26
Employment Situation March 2026 4-4-26
Payroll Focus: ADP Highlights March 2026 4-1-26
JOLTS Feb 2026: Openings Down, Hires Down, Layoffs Up 3-31-26
UST Deltas: Elevation Realities 3-29-26
Market Lookback: Confusion Reigns, Dislocation Pours 3-22-26
New Homes Sales Jan 2026: The Nays Carry 3-19-26
Market Lookback: The Gulf of Cause and Effect 3-15-26
Housing Starts Jan 2026: Total Starts Up, Completions Up, Permits Down 3-12-26