
Employment Situation: April 2026
We look at April payrolls, which exceeded expectations, but the quality mix was subpar. Unemployment rate held at 4.3%.


Technically, it is still a ceasefire.
The better-than-expected payrolls in the Establishment Data show a status quo waiting game for higher value-added and multiplier effect industries that are at the core of the Trump tariff strategy. Manufacturing was down again MoM and even more in the negative delta range YoY.
The payroll additions show a services-heavy concentration posting a +113K MoM increase with goods-producing at +10K and government at -8K, adding up to the +115K payroll adds in April. The fact that Manufacturing was -66K YoY with both durables and nondurables lower does not send great signals that the golden age of reshoring or onshoring is at hand.
Looking back over the trailing year, total additions to total payroll of +251K YoY is materially lower than the additions to the “health care and social assistance” line, where over +656K were added YoY. If we add in the “leisure and hospitality” payroll additions of +142K, that means those two lines alone (health care + leisure) are 3x the total additions to payroll YoY.
In the Household Survey, the report details an additional +134K unemployed for a total of 7.37 million and a 4.3% unemployment rate (7.37 unemployed/170 mn labor force). The number employed declined by -226K to 162.6 million.
The average hourly earnings increase of 3.6% is not stacking up well vs. the 3.3% CPI in March (April CPI release this coming week).Real earnings are looking even worse vs. PCE inflation of 3.5% for March (3.2% Core) and 4.5% for headline PCE for 1Q26 (4.3% Core PCE).
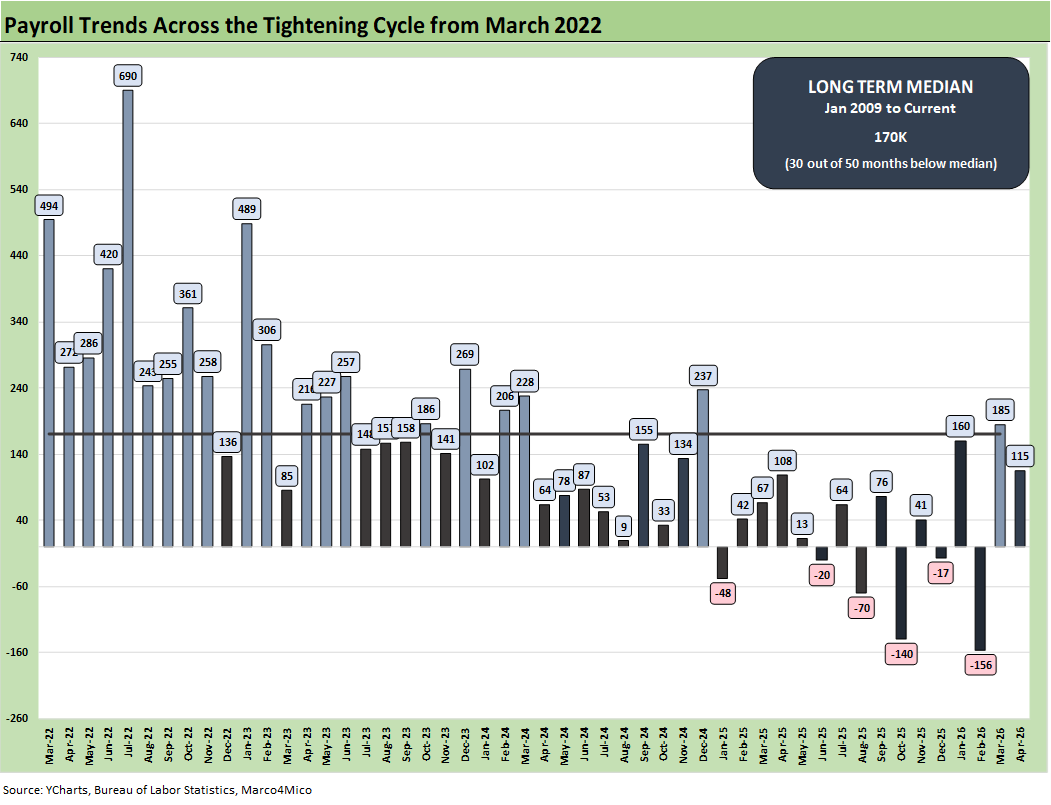
The monthly payroll adds/declines chart above starts in March 2022 with the end of ZIRP and the start of the tightening cycle. The bar chart tells an objective data story. The +185K as revised for March and +115K for April along with the 4.3% unemployment rate are not “easing friendly” for the FOMC and especially with inflation rising. This coming week we get April CPI and PPI.
The numbers in 2025 and 2026 above include the only negative deltas on the chart with 6 months in the red during Trump 2.0. Furthermore, the 2025-2026 months were all below the post-Jan 2009 median of 170K until March 2026 when it moved above the median with +185K. April’s +115K is back below it.
That long-term median of +170K includes a slice of the longest recession since the Great Depression, so it is not a high bar to clear.
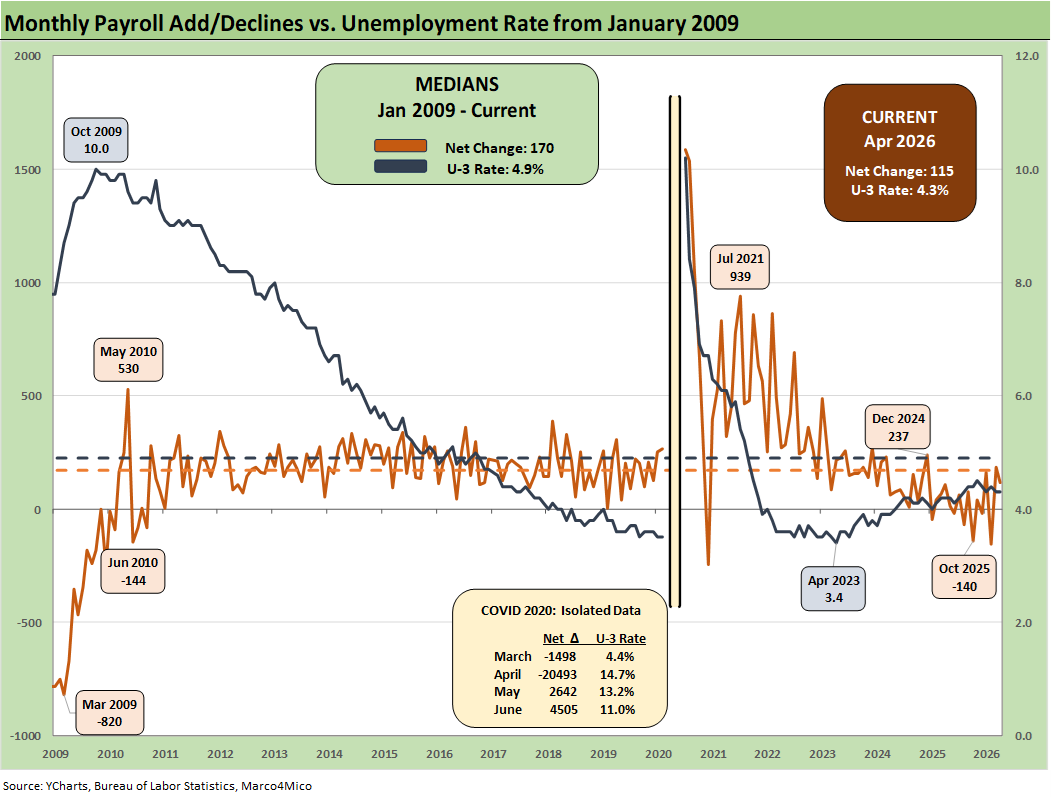
The above chart plots the running job adds/declines since Jan 2009 against the unemployment rate, which at 4.3% would be considered full employment in past cycles. In the chart, we isolate the worst months of the COVID dislocations in the box for better visuals to capture the other periods.
The 4.3% U-3 is below the long-term median of 4.9%. Payroll has been struggling somewhat in relative terms, but history is very kind to 4.3%. If the 2025-2026 frame of reference for payroll addition is 2024 (not a good jobs year) then the 2025-2026 numbers are not so bad. If we compare 2025-2026 monthly adds to the 2022-2023 period, the current job adds run rates are grim.
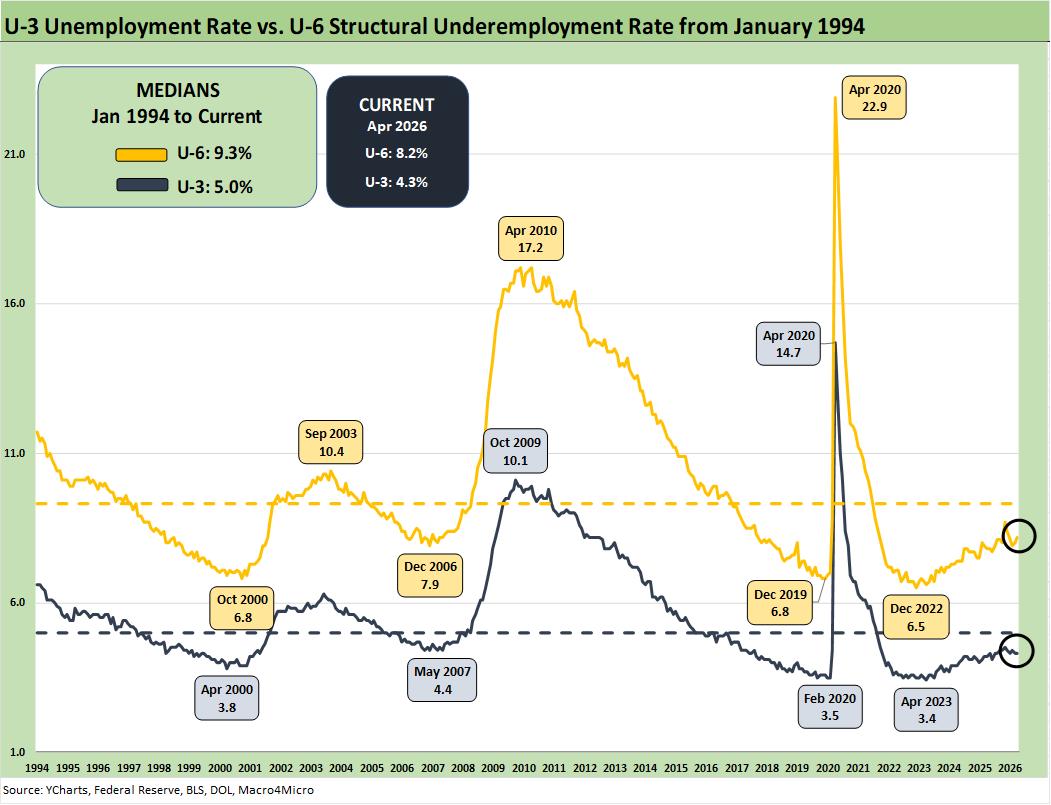
The above chart updates the time series for the U-3 unemployment rate and U-6 structural underemployment rate across the years from 1994.
As a reminder, the U-6 metric is defined with the numerator as “total unemployed + persons marginally attached to the labor force + total employed part time for economic reasons.” The denominator is “civilian labor force + workers marginally attached to the labor force.”
The U-6 is the structural underemployment metric that is always useful to watch. To start 2025, the U-6 rose sharply in Feb 2025 to 8.0% from 7.5% in Jan 2025. The U-6 jumped to 8.7% in Nov 2025 from 8.1% in Sept 2025.
The current 8.2% marks an increase from 8.0% in March and 7.9% in Feb and is well above the 6% handles seen in spring of 2023. The U-6 is still below the median from 1994 of +9.3%, which notably includes the post-crisis shock and the longest recession since the Great Depression.
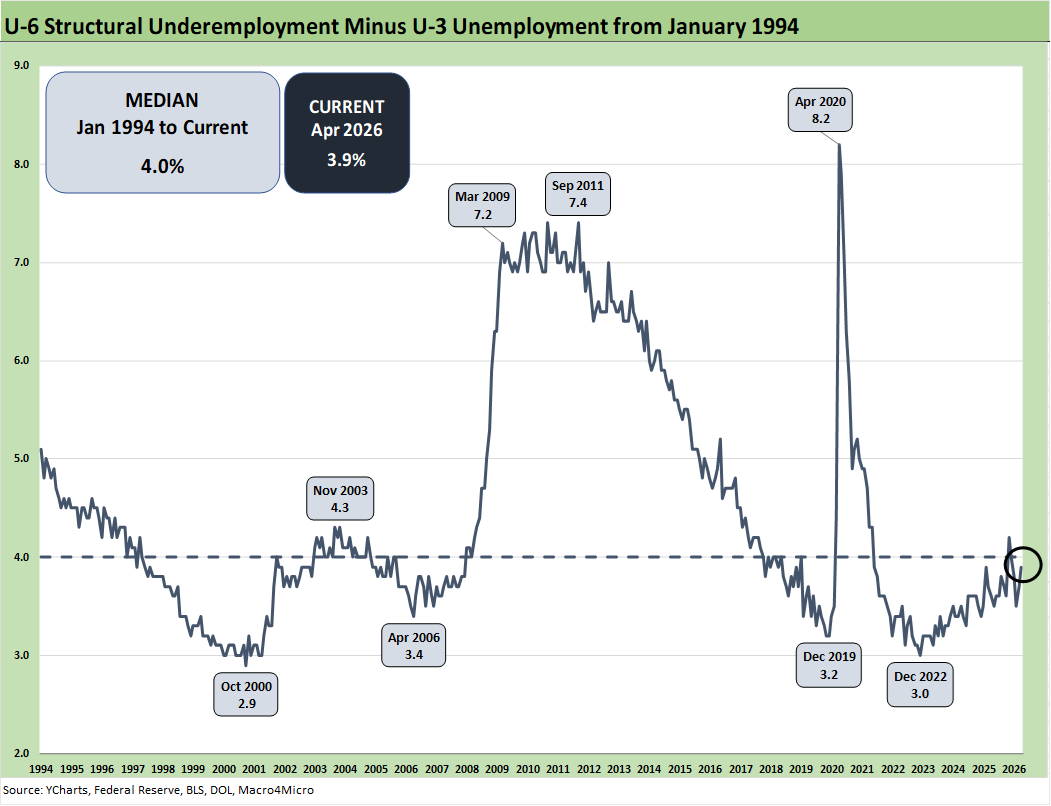
The time series above updates the U-6 minus U-3 differential as a measure of relative employment quality and to flag risks of major dislocations in large swaths of the economy (think oil patch collapse in the late 1980s, tech bubble imploding into a weak 2001-2003, financial services and automotive meltdown in 2009).
The current 3.9% differential is just below the long-term median of 4.0%. The job ranks are still vulnerable now with the Iran war effects flowing into hiring decisions, industry fundamentals, and FOMC policy planning.
Many questions will be getting answers with respect to how tariffs and the oil spike will flow into hiring, investment, working capital cycles, and new capacity planning. The wide range of potential outcomes is clear enough in that “boots on the ground” cannot be ruled out until those boots and bodies return home.
There is every reason to assume that Trump desperately wants to extricate himself and US troops from the currently untenable stalemate. That in theory would send oil prices dramatically lower. That could also arm Warsh to fulfill his FOMC easing bias if he can convince a very skeptical Fed voting group. Another bad CPI and PPI print next week will not help the situation.
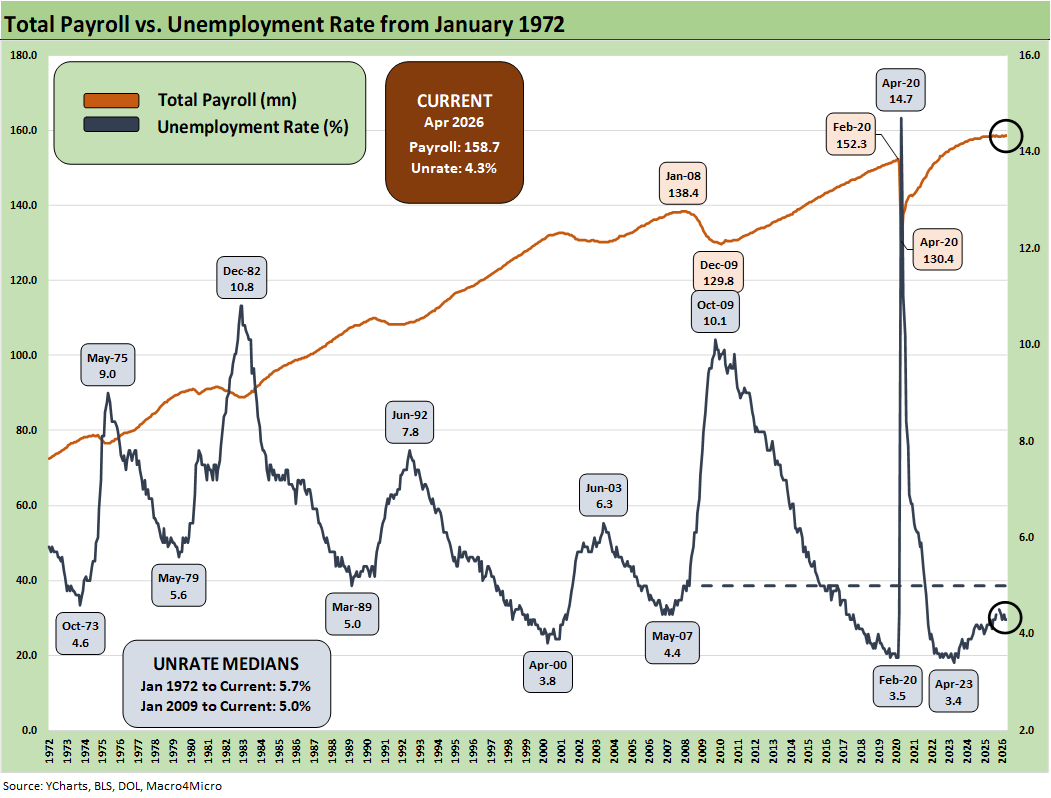
The above chart updates total payroll vs. the unemployment rate. The trend needle has not moved much in 2026. More bodies with more paychecks are always a good thing. The trick from here is how the consumer deploys that paycheck and whether the zero-sum realities of household budgets undercut spending.
The need for defensive spending habits in light of impaired household discretionary cash flow could become a bigger headwind in the aftermath of the Iran fallout. As noted in the bullets at the top, the total employed in April 2026 moved lower from March 2026 by -226K and show a decline of -1.28 million YoY vs. April 2025 (household survey). That flunks the “more bodies, more paychecks” rule.
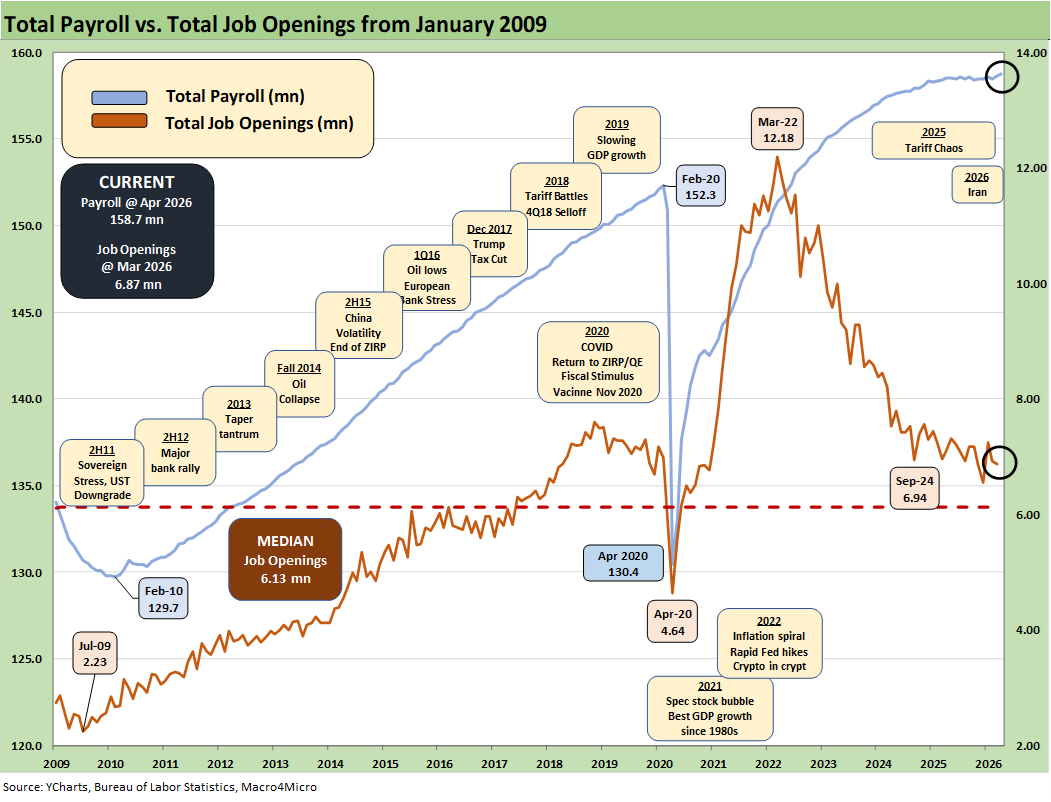
The above chart updates the total payroll number vs. job openings. JOLTS data analysis had been slowly recovering from the shutdown and is now back into the lineup with its usual 1-month lag (see JOLTS March 2026: Openings Down, Hires Up, Layoffs/Discharges Up 5-5-26).
Management teams have a lot of moving parts to factor into planning whether quantitative or qualitative. The final IEEPA decision from SCOTUS came in against Trump, but he was prepared to start slapping on tariffs under Section 122, 232, and 301. They will create more trade partner strife. Trump just faced more setbacks in court this week, but his pledge is to get tariff revenue even higher than it was.
The USMCA review is up for midyear while the EU diplomatic setbacks and trade relations are downright ugly at this point. The trade flows have been looked at in many past commentaries (see Meanwhile…Back in Economics and Tariffs 3-2-26, US Trade with the World: Import-Export Mix 2-25-26).
The latest trade disruptions from the Gulf and the related supply chain problems (oil, LNG, helium, aluminum, etc.) have been getting a lot of headline time. The disruption could get much worse via the Red Sea if the Iran War escalates and the Houthis pile on. There are also the contingent threats of Iraqi Shiite militia.
The FOMC and the market both have much to digest, and Trump is making it clear to the domestic audience that there is a ceasefire and the “war is over.” This is hard to reconcile with a full blockade (an act of war by international law) and recurring bombing threats that do not lack for extremist, violent rhetoric.
The fallout in consumer spending from health care premium increases now are joined by energy price stress and $4.55+ regular gasoline (per AAA as of 5-8-26) as peak driving season approaches in the summer. Home heating oil bills could get much worse later in the year if the crisis has lag effects and remains a challenge.
The retrenchments in SNAP spending and eligibility criteria challenge promise household stress and could signal trouble ahead in the lower part of the “K” household mix. Trump’s latest budget plan offers little relief to the lower part of the K recovery and in fact piles on with cuts to many programs. Health care costs are rising alongside myriad CPI lines and borrowing costs.
Inflation reports had generally brought good news relative to expectations given the scale of the forward threat from tariffs and lagging effects to be seen across working capital cycles. That just changed in dramatic fashion and threatens to get worse on Iran War effects (see PCE Inflation, Income & Outlays March 2026: Inflation Anxiety Level? 5-3-26).
The headlines around multiple supplier chains have been more than amply covered but fertilizer is one that aims directly at food while oil aims at just about everything from the gas pump to delivery costs, raw materials, and leisure and travel (airfare). The headlines highlight the threat to semiconductor production while customers could see IT budgets slammed. So that means the consumer sector and tech market both have their share of risks.
The overall economic impact of tariffs had been far less than feared given the reality that most trade partners backed down in 2025. That could change in 2026 with many more battles on the table such as a threatened embargo of Spain that would pull in the EU (Anti-Coercion bazooka?) and the USMCA review.
The USMCA review will inevitably create a lot of tension with Canada despite the US goods trade surplus the US posts ex-crude oil. Trump needs a cheat sheet on who are the best export markets with around 3 dozen states seeing Canada as the #1 export market.
Trump is back again talking about “taking money in” when he talks about his threatened increase of EU tariffs. The buyer writes the check. It is not “money taken in.” It is money transferred within the US. He has even gone so far as to accuse SCOTUS and their IEEPA decision as allowing sellers and selling nations to get refunds. It was in one of his “Truth” Social rants, and he may have forgotten it by his next Big Mac. “Refunds to sellers” is just the flip side of his “seller pays” nonsense. Refunds go to US based importers.
Stay tuned for EU trade and USMCA review fallout.
See also:
New Home Sales March 2026: Favorable Volume, Weaker Prices 5-5-26
JOLTS March 2026: Openings Down, Hires Up, Layoffs/Discharges Up 5-5-26
Market Commentary: Asset Returns 5-4-26
PCE Inflation, Income & Outlays March 2026: Inflation Anxiety Level? 5-3-26
1Q26 GDP Advance Estimate: Consumer Fade, Investment Boom 4-30-26
Market Commentary: Asset Returns 4-26-26
Synchrony Financial: Favorable Consumer Credit Signals 4-24-26
Industrial Production March 2026: Mixed Picture, Big Questions Ahead 4-16-26
Existing Home Sales March 2026: New Beginnings or New Ends? 4-15-26
Producer Price Index March 2026: Heater or Curve Ball? 4-14-26
CPI March 2026: The CPI Cycle Could Prove Maddening 4-12-26
4Q25 GDP: More Adverse Revisions in the Golden Year 4-9-26
The US as an Aspiring Emerging Market: Fiscal SNAFU, Political FUBAR 4-6-26
Employment Situation March 2026 4-4-26
Payroll Focus: ADP Highlights March 2026 4-1-26
JOLTS Feb 2026: Openings Down, Hires Down, Layoffs Up 3-31-26
UST Deltas: Elevation Realities 3-29-26
Market Lookback: Confusion Reigns, Dislocation Pours 3-22-26
New Homes Sales Jan 2026: The Nays Carry 3-19-26
Market Lookback: The Gulf of Cause and Effect 3-15-26
Housing Starts Jan 2026: Total Starts Up, Completions Up, Permits Down 3-12-26