
JOLTS Feb 2026: Openings Down, Hires Down, Layoffs Up
We await more current March payroll info this week, but Feb JOLTS offers little room for optimism with declines.


No joy in jobsville. Still waiting for those manufacturing jobs.
An almost 500K decline in sequential Hires is the main metric, but we see a decline in Job Openings in Feb 2026 of -358K with a rise in layoffs of a more manageable 61K.
The Feb activity largely predates Iran (bombing started Feb 28) and related shock waves across energy and supplier chains, so the March payroll data to be released on Friday will offer some more timely context.
The consumer spending swing factor from Iran could be more concentrated in Leisure and Hospitality payrolls in coming periods after a -213K decline in openings for that sector from Jan to Feb 2026. With health care premiums soaring, mortgage rates just under 6.5% after this week’s rally, retail gasoline materially higher, CPI lines very mixed, and consumer inflation expectations rising, it is fair to say economic growth faces a cloud after such a poor 4Q25 (see GDP 4Q25 Second Estimate: Sharp Move Lower 3-13-26).
Manufacturing is always a focal point in the context of the tariff story lines from the White House, but manufacturing hires MoM were down by -24K YoY even if only down by -4K sequentially from Jan 2026. Layoffs in manufacturing were down by -21K MoM in a signal of some stabilization before the Iran mess. Sequential job opening trends posted -71K in Manufacturing from Jan 2026 but with +39K YoY. The manufacturing openings are supposed to be higher under the tariff theory.
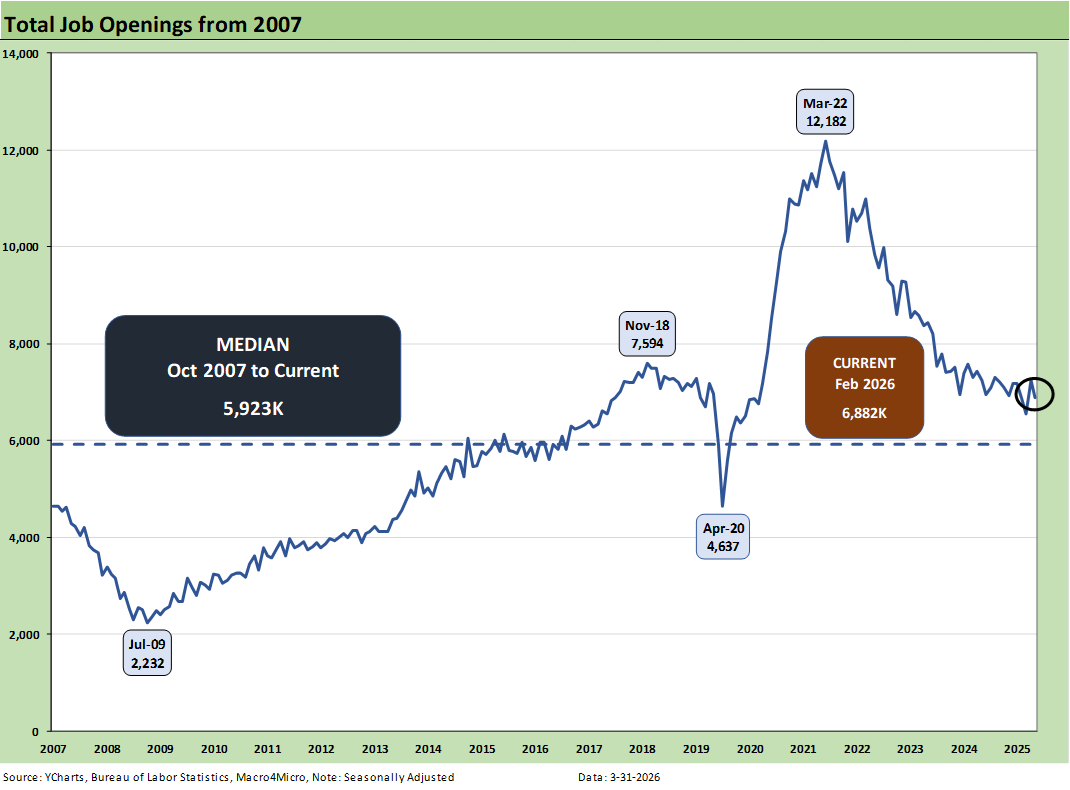
The above time series plots job openings across the timeline from 2007 to current. The sharp, downward trends from the end of ZIRP and start of the tightening cycle in March 2022 show little to celebrate. The high of 12.2 million off the lows of 4.6 million at the peak of the COVID panic are pretty dramatic, but recent periods are sot. Opening are at least running above the long-term median (5.92 million). The 5% decline YoY in job openings in Feb 2026 is bad news no matter how you slice it.
The above-median openings number comes in a market where secular growth and demographics need more job openings. That is especially the case to justify the tariff strategy. The strains on affordability in so many end markets since COVID (housing, health care, autos) combined with the threat of even more inflation tied to the Iran mess means even more jobs and higher salaries will be even more crucial.
The conversations will continue to focus on how many new job openings can be avoided through the deployment of AI tools and technology. The tariff cost mitigation strategies also do not help in budgeting for higher headcount.
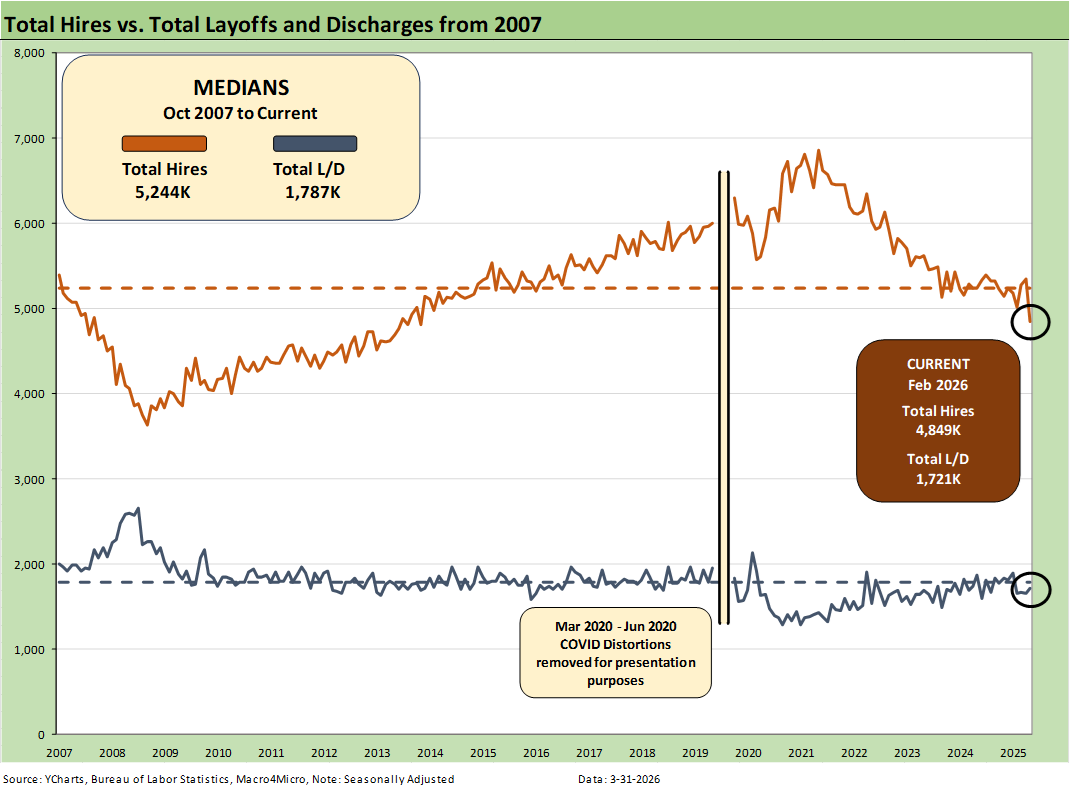
The above chart plots Hires vs. Layoff/Discharges on a SAAR basis. Note: we remove the COVID numbers from several charts to support the visual value for “normal” periods. We comment on COVID history at the end of the note.
Hires declined by -498K sequentially from Jan 2026 while layoffs/discharges rose by 61K. The hires YoY declined by -387K or by 7.4%. No joy there in an expanding economy even if annual GDP growth of 2.1% lagged 2024’s 2.8% (just don’t tell Hassett). The numbers clearly signal negative payroll trends.
The biggest MoM decline in Hires occurred in Leisure and Hospitality at -185K with Professional and Business Services at -154K. The biggest increase in layoffs was Retail at +72K.
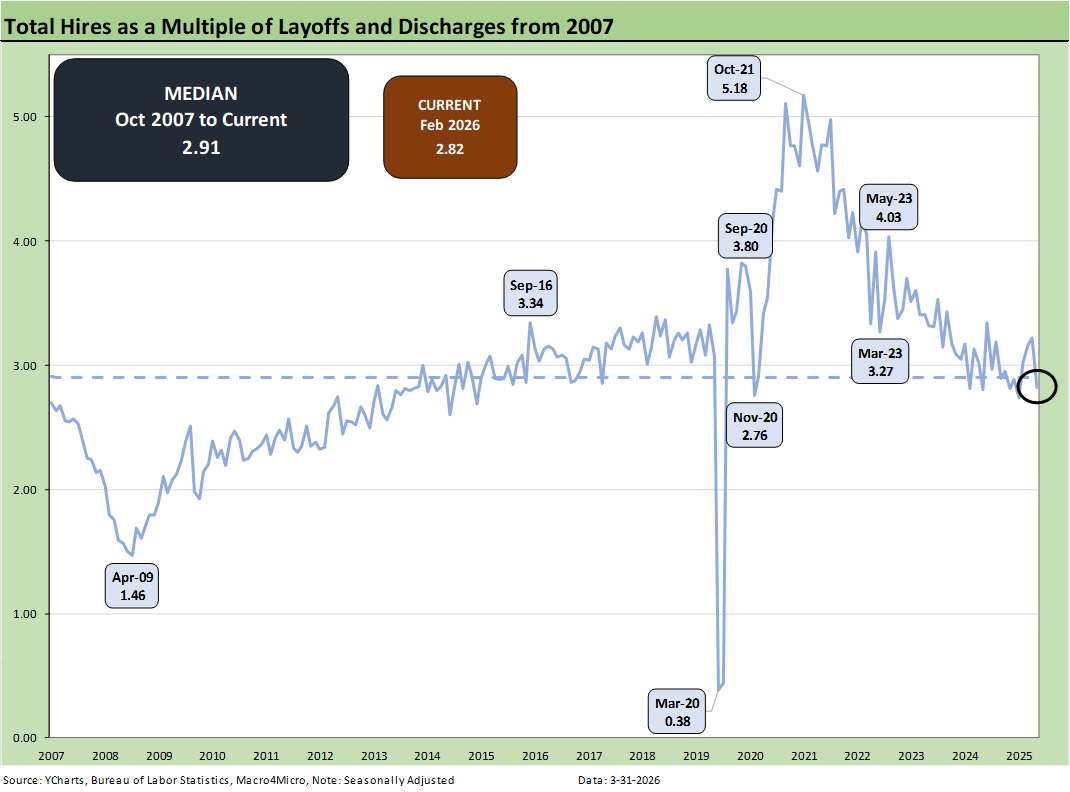
The above chart updates the ratio of Hires to Layoffs/Discharges. The relationship stands at 2.82, below the long-term median of 2.91 from 2007. The post-2007 period includes the effects of longest recession since the Great Depression (Dec 2007 – June 2009) followed by the longest expansion in history from June 2009 to COVID (Feb 2020).
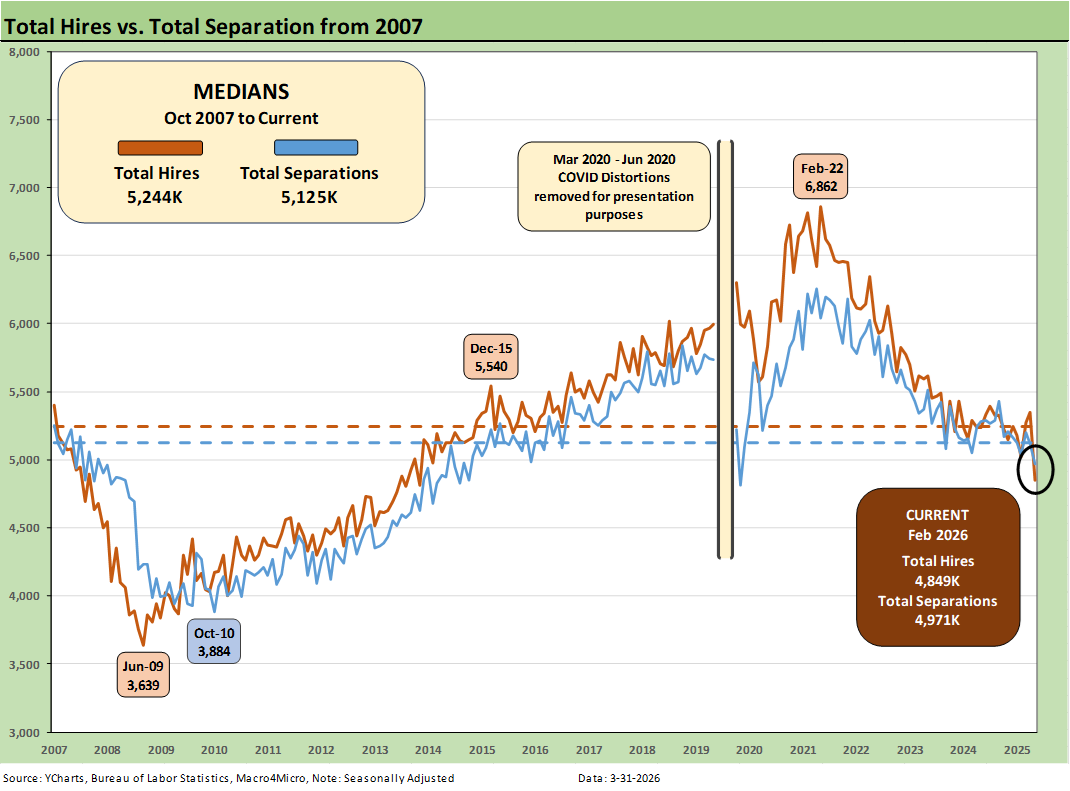
The above chart plots Hires vs. Total Separations on a SAAR basis. Separations include Quits, Layoffs/Discharges, and “Other Separations.” Total Separations moved lower by -173K in Feb 2026 and were down by -314K YoY.
We typically do not find “Total Separations” particularly interesting as a multi-line net number. Much of the decline in Separations can be attributed to a -153K MoM decline in “Quits.” One theory is that trend signals lower confidence in finding a job on the other side of quitting.
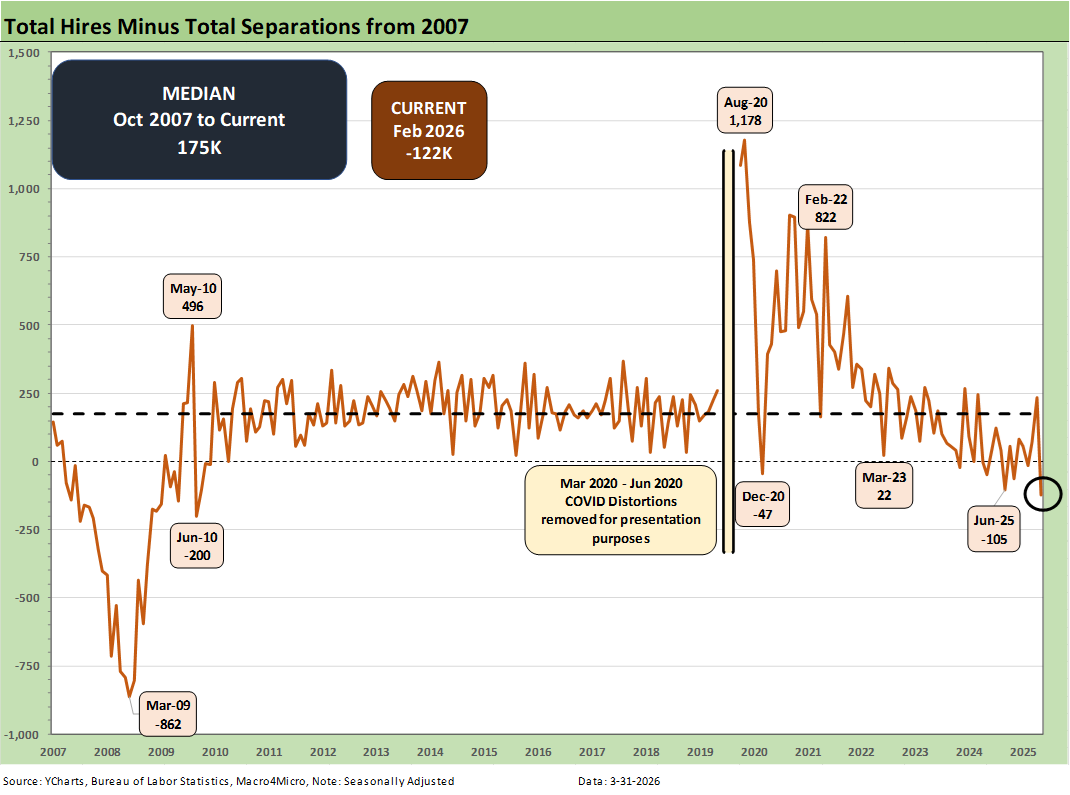
The Hires minus Total Separations differential is plotted above. We recently had some major revisions. As covered above, the sharp decline in Hires is the main event. Separations also had a decline on lower Quits.
The net number above has moved notably lower in recent months and is in the negative range now. The differential is starkly below the long-term median of +175K.
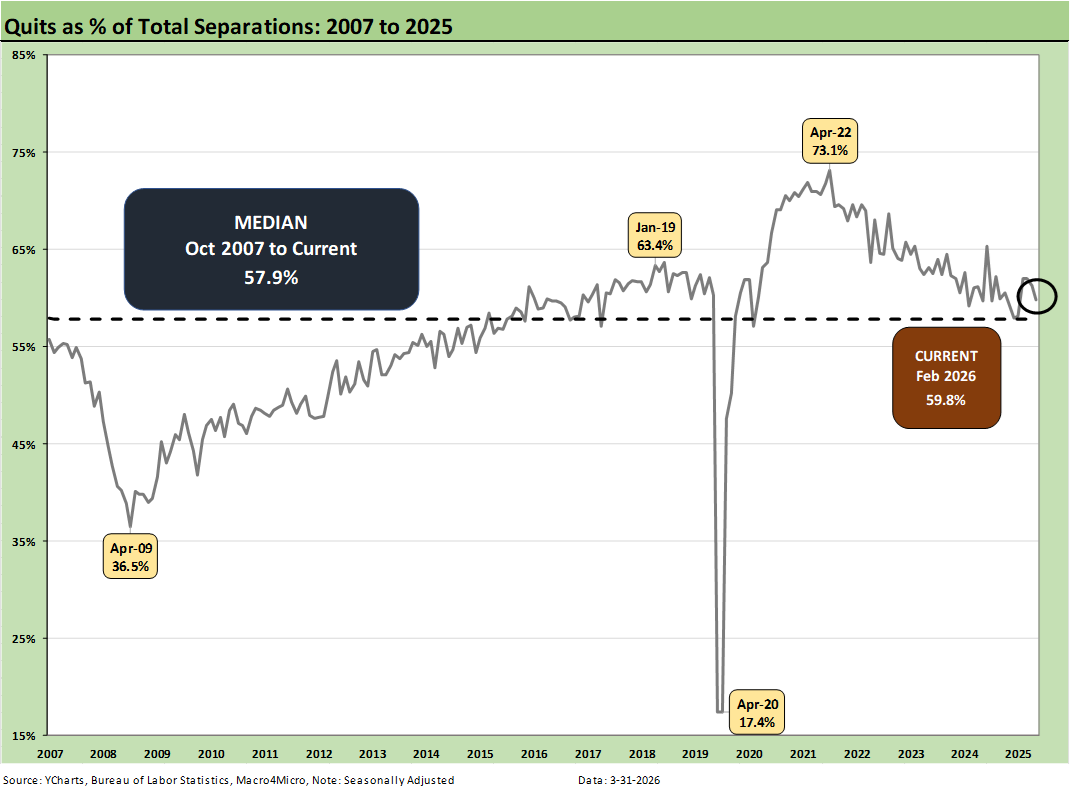
The time series for Total Quits as a % of Separations (SAAR basis) was 59.8%, slightly above the long-term median of 57.9%. The classic “Quits Rate” is measured by Total Quits as a % Total Employment, and that metric moved slightly lower on the month to +1.9%, down from 2.0%. The Quits rate is also down slightly YoY from 2.0% to 1.9%.
The bottom line on the JOLTS numbers is that it was one that UST bulls might grasp onto for hopes of easing improving and the same for the long-suffering bull flattener advocates. The oil price wildcard has plenty of history, but this scale has more in common with the Iranian crisis if 1979.
While the US is a powerhouse in energy (oil, natural gas, and LNG) and has Canada as a neighbor (as badly as Trump treats them) and largest oil importer into the US by far, that backdrop takes useful comparisons to 1974 off the table. The Arab Oil Embargo of late 1973 and “odd-even license plate” rationing in the recession is being experienced by many nations at this point. Just not the US. That impacts global growth. Asia is especially vulnerable.
NOTE ON COVID DISTORTIONS
The Hires vs. Separations time series make for interesting numbers but tough charts to plot visually given how much the spike in Separations/Hiring during COVID distorted the numbers from March 2020 to June 2020. The swings literally were off the charts. For presentation purposes, we adjust the charts above to exclude the raw data for those months to get a better vantage point on somewhat more normal times. Compared to COVID, the credit crisis seems “normal” in terms of the job count moves.
For disclosure purposes, Separations across March 2020 (16.3 million), April 2020 (11.6 million), May (4.7 million), and June (5.2 million) were running against Hires in March (5.2 million), April (4.0 million), May (8.1 mi/lion), and June (7.4 ml/lion). We remove those from the charts to get better scale visuals on the periods that precede and follow as the market saw 50-year lows in unemployment in 2022. Wild swings were had by all as industries saw shutdowns and layoffs in the COVID recession. The long-term medians from 2007 to 2022 for Hires and Separations were very close.
Almost 28 million Separations combined in March-April 2020 was a brutal reminder of that period.
See also:
Market Commentary: Asset Returns 3-30-26
UST Deltas: Elevation Realities 3-29-26
Market Commentary: Asset Returns 3-23-26
Market Lookback: Confusion Reigns, Dislocation Pours 3-22-26
New Homes Sales Jan 2026: The Nays Carry 3-19-26
Producer Price Index Feb 2026: Getting Warmer 3-18-26
Industrial Production Feb 2026: Capacity Utilization 3-16-26
Market Lookback: The Gulf of Cause and Effect 3-15-26
PCE Inflation Jan 2026: Personal Income & Outlays 3-13-26
GDP 4Q25 Second Estimate: Sharp Move Lower 3-13-26
Housing Starts Jan 2026: Total Starts Up, Completions Up, Permits Down 3-12-26
CPI Feb 2026: It’s Making You Wait… 3-12-26
Existing Home Sales Feb 2026 3-10-26
Payrolls Feb 2026: Into the Weeds 3-8-26
Employment Situation Feb 2026: Payrolls Get Ugly 3-8-26
VIX: Market Still Not Getting the Vapors 3-6-26