
Housing Starts Jan 2026: Total Starts Up, Completions Up, Permits Down
Housing starts for Jan 2026 were more mixed than the headline number with single family lower.


The shortage of affordable homes remains a secular reality.
The Jan 2026 new residential construction numbers were set against a backdrop of decent consumer spending and more optimism around mortgage rates and the UST curve in January. The world has changed a lot since then.
For Jan 2026, starts rose by +7.2% MoM and YoY by +9.5%. However, single family starts were -2.8% MoM and -6.5% YoY. Total permits declined by -5.4% MoM and -5.8% YoY. Single family permits were -0.9% MoM and -11.6% Y0Y.
Privately owned completions were up by +4.8% MoM but down by -7.5% YoY. Single family completions were down by -1.0% MoM and down by -3.3% YoY.
Multifamily starts posted big numbers at +29.1% MoM and +56.9% YoY, and these headline numbers masked some of the relative weakness of single family in the total starts numbers.
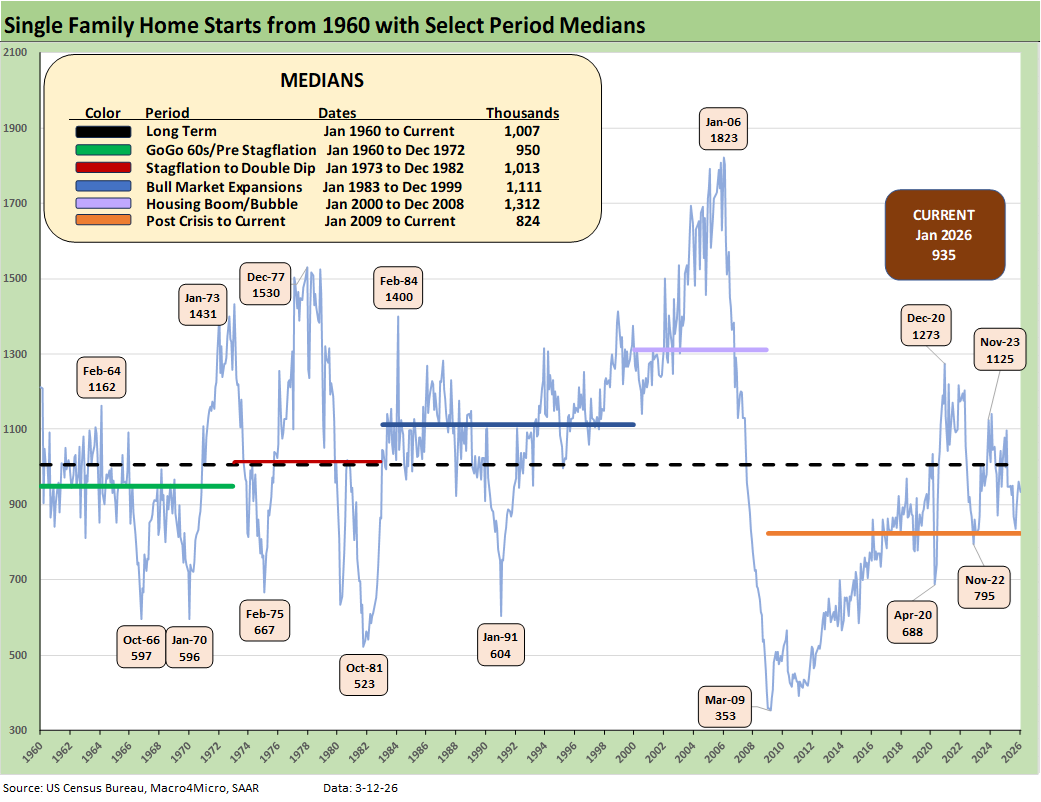
The single family home starts time series shows a wild ride across the cycles. However, the current volumes are low when considering the intrinsically high demand for housing tied to demographics. The headwind has been affordability with the main swing factor there being the monthly payment burden (see Home Starts Dec 2025: Wrapping a Weak 2025 2-18-26).
Home prices have clearly soared since COVID, but mortgage rates drive the monthly payment burden more than price. As of last night close, the Mortgage News Daily Survey posted 6.24% 30Y, which marks a setback after the recent drop into the 5% handle range. The Iran backdrop and dramatic swings in oil ($96 handle as we go to print) has put some pressure on the 10Y UST that drives the 30Y mortgage.
The yield curve damage after the onset of the 2022 tightening cycle and inflation with ensuing volatility drove a 200 bps Hi-Lo range for 30Y mortgages since the fall of 2023 through early 2026. The struggle continues and the FOMC handicapping on rate cuts has turned in an unfavorable direction. As we go to print, the odds of a June cut has plunged per FedWatch. The odds of “unchanged” fed funds after the June Fed meeting is up to over 77% from under 38% a month ago. The odds also favor “no cut” for the July and Sept Fed meetings.
We need to keep in mind that 100 bps of easing in late 2024 saw a major mortgage rally initially before the market saw a bear steepener unfold into 2025 (see The Curve 12-15-25). So that bull UST flattener to bring down mortgage rates did not play out for long. That steepening sent mortgages higher again after Sept 2024 even if well below the 2023 mortgage peak.
The current run rates for new home volumes remain weak in multi-cycle context despite the recurring theme of inadequate supply for what should be exceptional demand. For now, affordability struggles trump demand. The Iran turmoil could now add a new round of lower cyclical confidence and concerns around payroll trends (job safety and buyer confidence).
As noted in the bullets, permits are in a fade, but single family starts were also weak in relative terms with the total starts numbers pumped up by a massive increase in multifamily (detailed further below).
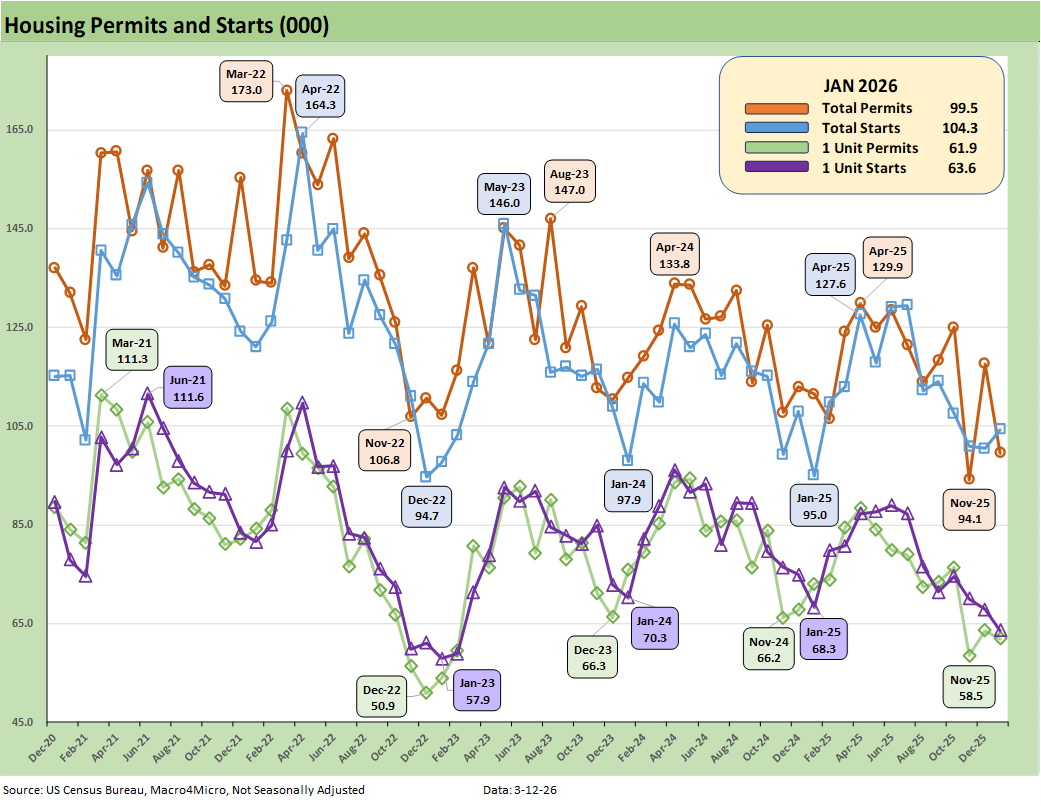
The above chart plots total permits and total starts on a Not Seasonally Adjusted (NSA) basis. NSA is viewed as closer to what is going on in the trenches without the SAAR model assumptions. For January 2026, we see NSA total permits notably lower (-10.7%) YoY and single family permits down by -15.3% YoY. For MoM, total permits were down by -15.4% with single family permits down -2.7% MoM.
For total starts and single family starts on an NSA basis, we see total starts up by +3.8% MoM and single family NSA starts lower by -6.3% MoM.
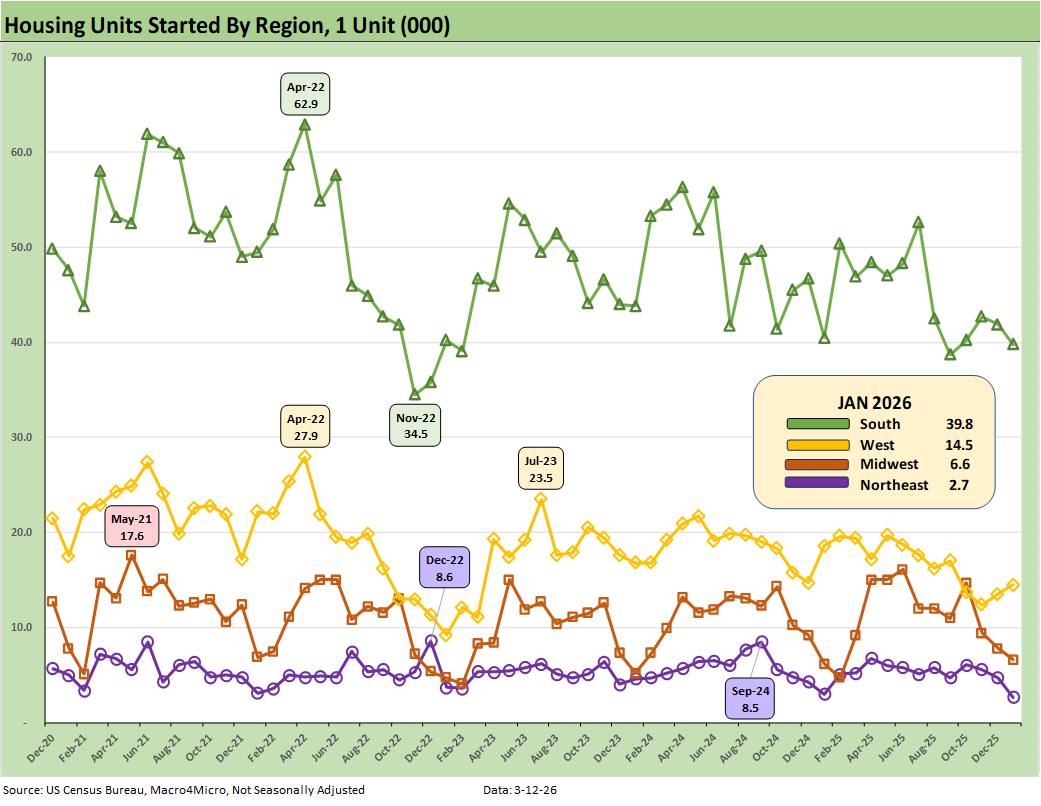
The above plots the single family starts by region (NSA). On a MoM basis, the critical South region (totals 54% of total NSA starts) was higher by +10.1% MoM and by +15.6% YoY. The West as the #2 market was down MoM by -6.9%. The Midwest region MoM was down by 31% with the small Northeast market +40% MoM. The YoY NSA starts were mixed with the South higher and West lower among the big two regions. The Midwest was lower YoY and Northeast higher YoY.
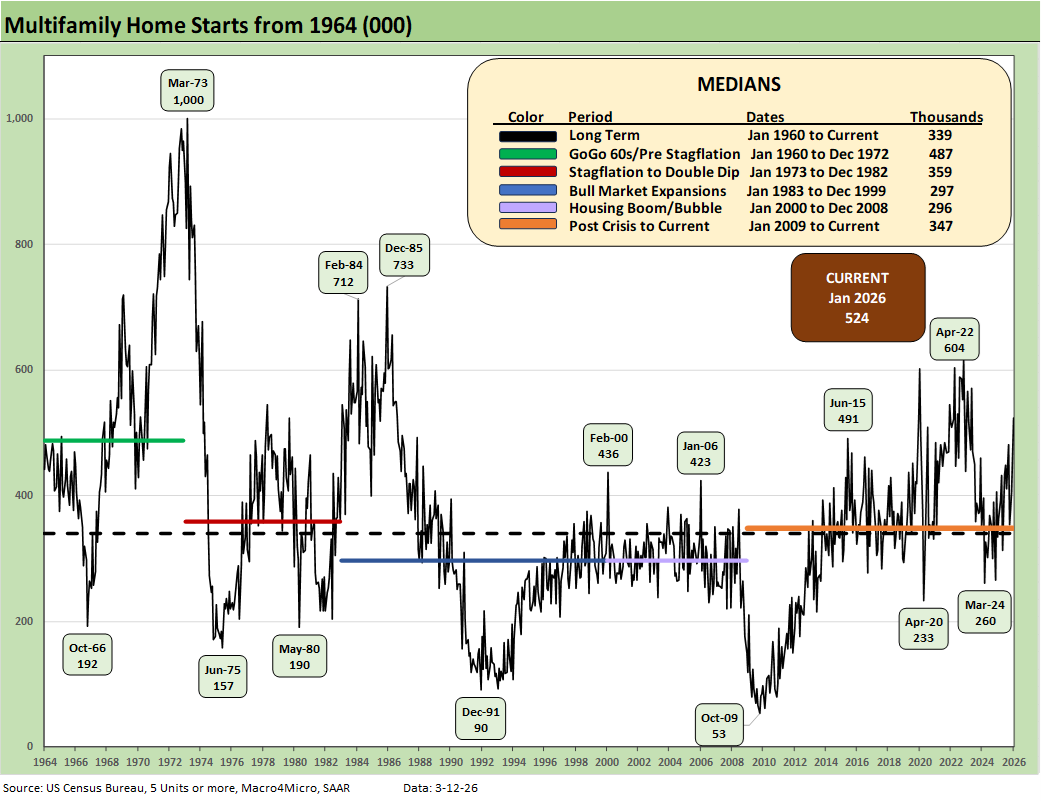
The above chart updates running multifamily starts. At +524K (SAAR), Jan 2026 rose by +29.1% MoM and by 56.9% YoY. The 524K is well above the long-term median of 339K, above the median from Jan 2009 to current (347K), and above the median from 2000 to 2008 (296K). Jan 2026 even exceeded the median of the 1960s boom (487K).
The 1960s was a period of explosive growth for multifamily with the back end of the baby boom, the postwar rise of urbanization, and the high racial migration from the south to the north.
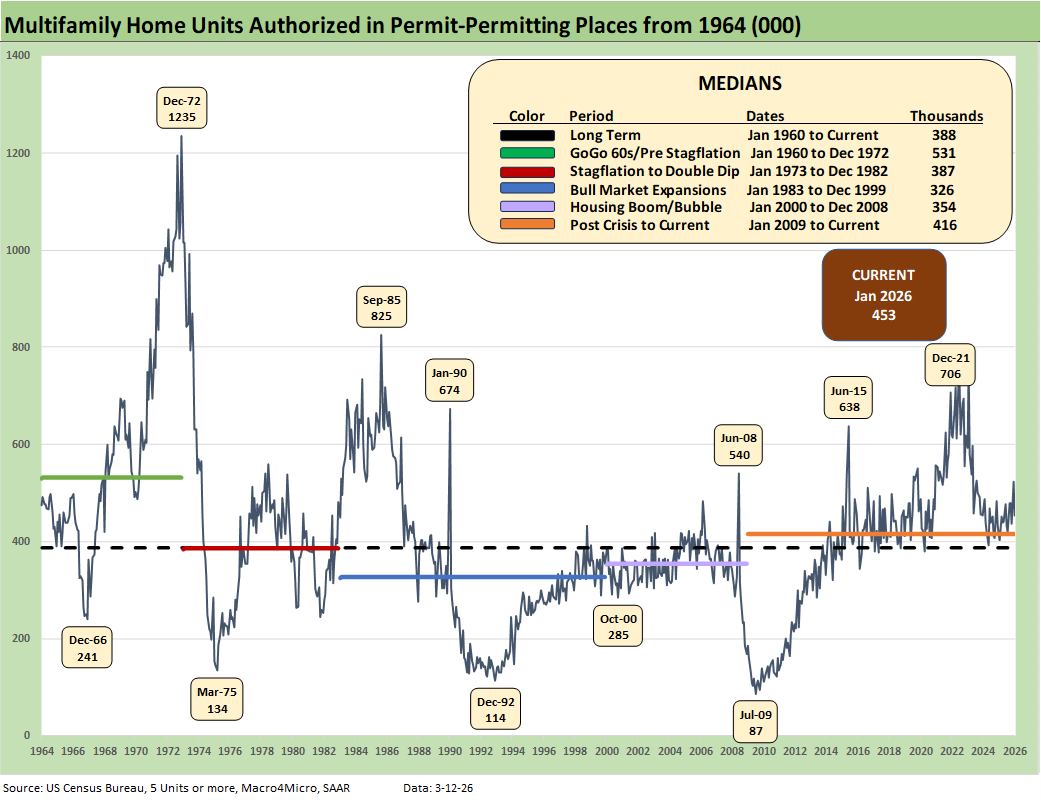
The above chart updates Multifamily permits (SAAR). The 453K in Jan 2026 multifamily permits declined by -13.4% MoM but rose by +8.9% YoY.
See also:
CPI Feb 2026: It’s Making You Wait… 3-12-26
Existing Home Sales Feb 2026 3-10-26
Market Commentary: Asset Returns 3-8-26
Payrolls Feb 2026: Into the Weeds 3-8-26
Employment Situation Feb 2026: Payrolls Get Ugly 3-8-26
VIX: Market Still Not Getting the Vapors 3-6-26
Meanwhile…Back in Economics and Tariffs 3-2-26
PCE Income & Outlays Dec 2025: Inflation Reversal? 2-20-26
4Q25 GDP (Advance Est.): Less Distortion This Time 2-20-26
2025 trade Deficits: Reality vs. Rhetoric 2-19-26
Industrial Production Jan 2026: Capacity Utilization Trends 2-19-26
Home Starts Dec 2025: Wrapping a Weak 2025 2-18-26
Market Lookback 2-17-26
CPI Jan 2026: Reassuring Numbers, Missing Pieces 2-13-26
2025 Spread Walks and Multicycle Return Histories 1-5-26
Annual Return Differentials: HY vs. IG Across the Cycles 1-3-26