
Market Lookback: The Gulf of Cause and Effect 3-15-26
We update rising UST rates and higher spreads that do not mesh well with an energy crisis slamming stocks.


Chaos blurs the line of sight.
The above visual showed up under a search for the Greek God of Chaos, so we ran with this one instead of a scantily clad glowering God. With the Strait of Hormuz setting the stage for material escalation of the Iran war, there are many scenarios to spin. On the “brighter side,” we already see rumored deals with Iran and India and France and Italy that offer separate pathways from more military escalation.
Trump asked for (demanded?) more military and naval support from “allies” (a tricky term these days) while issuing threats to the future of NATO (at first, he was confused and threatened to primary them). Meanwhile, Trump had just derided and rejected offers from the UK almost two weeks ago. Trump’s request for naval support from Asia and the EU could also set the stage for a fresh round of ugly rhetoric if they do not comply.
Asset performance is feeling stress, and Sunday night initial saw WTI over $100 after trading opened. It is now back under $98 as we go to print. We already looked at the asset return volatility, the equity beatdown, spiking oil, the UST setbacks of recent weeks with duration taking a hit, and mortgages moving higher. FedWatch odds are pushing the “no action” timeline out to the late fall (see Market Commentary: Asset Returns 3-15-26).
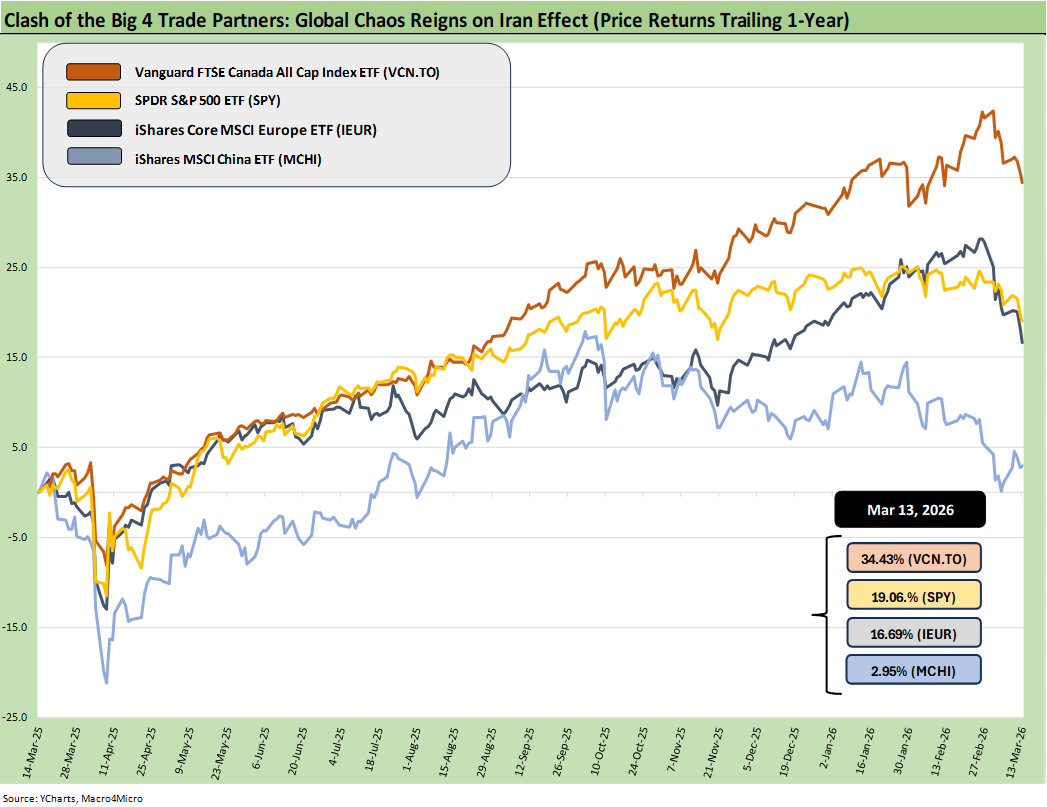
In case anyone wondered whether the Iran issue was a global macro risk, the benchmark index ETFs (with currency effects) answers that question. The trend is clear. Everyone loses from the Iran War effects.
In this case, the US has been doing better recently relative to the big 4 trading partners after spending most of 2025 in last place. We tracked that across the year and the weak dollar was a big part of it (see Market Lookback 2-17-26).
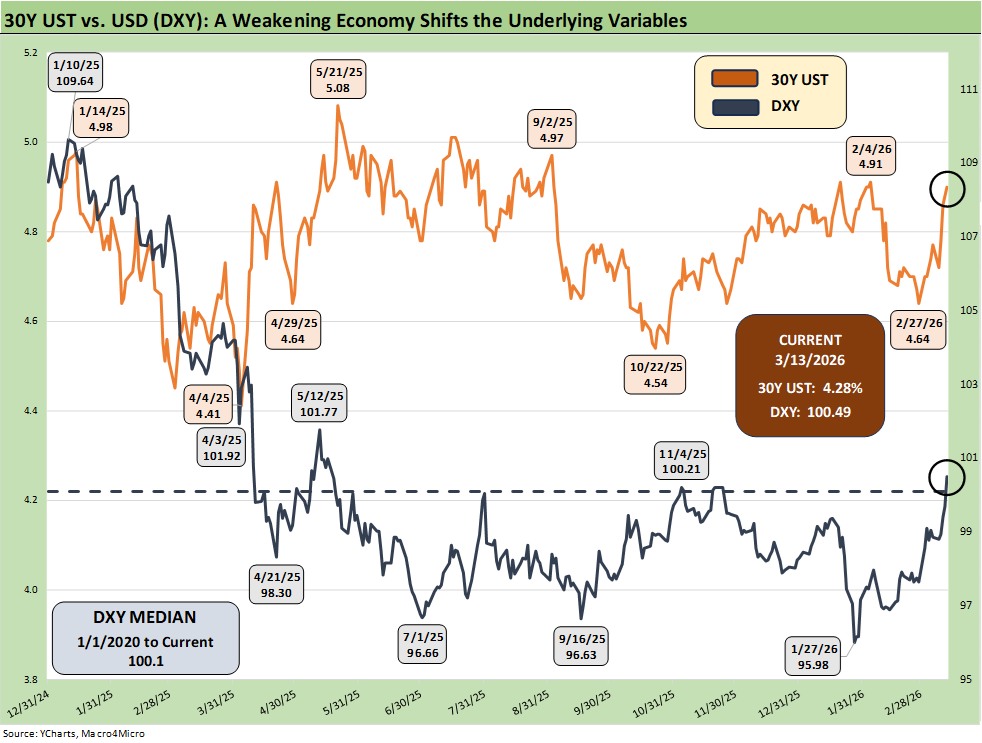
The above chart updates our UST 30Y vs. DXY time series. The dollar is mounting a comeback with the recent developments, but the UST is going in the wrong direction with budget deficits set to explode for many reasons. While “war is hell” for budget deficits, the fiscal actions and fraying global investor relationships will keep UST supply and demand as a negative factor in the overall picture.
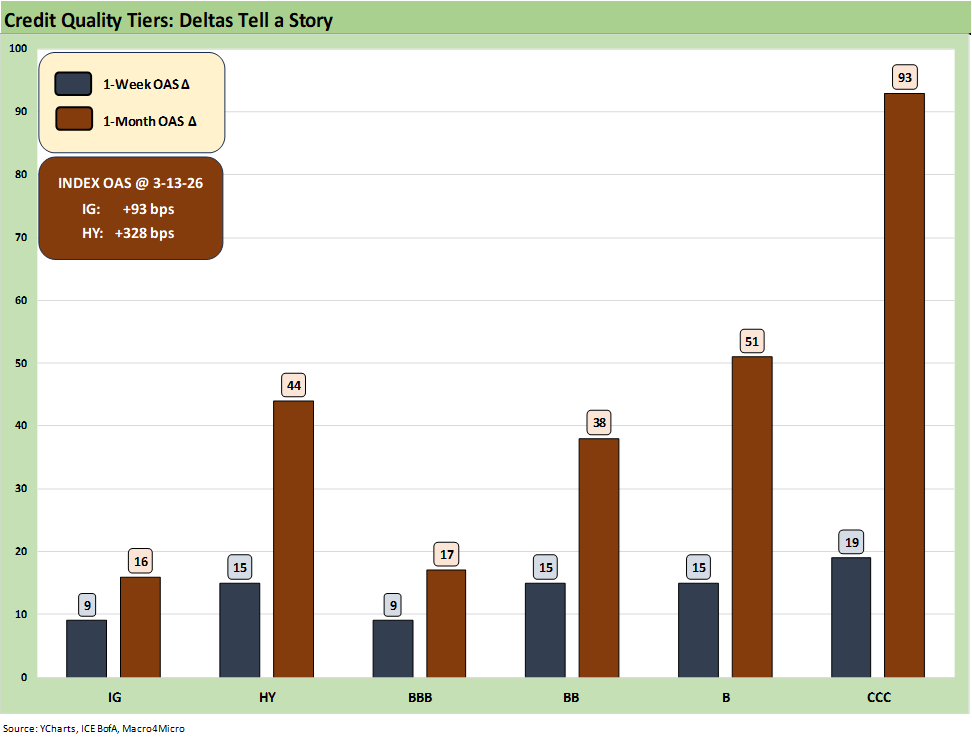
The above chart updates the 1-week and 1-month spread deltas for IG and HY and for the BBB tier down to the CCC tier. A rising UST curve plus widening credit spreads make for unfavorable bond return math (see Market Commentary: Asset Returns 3-15-26).
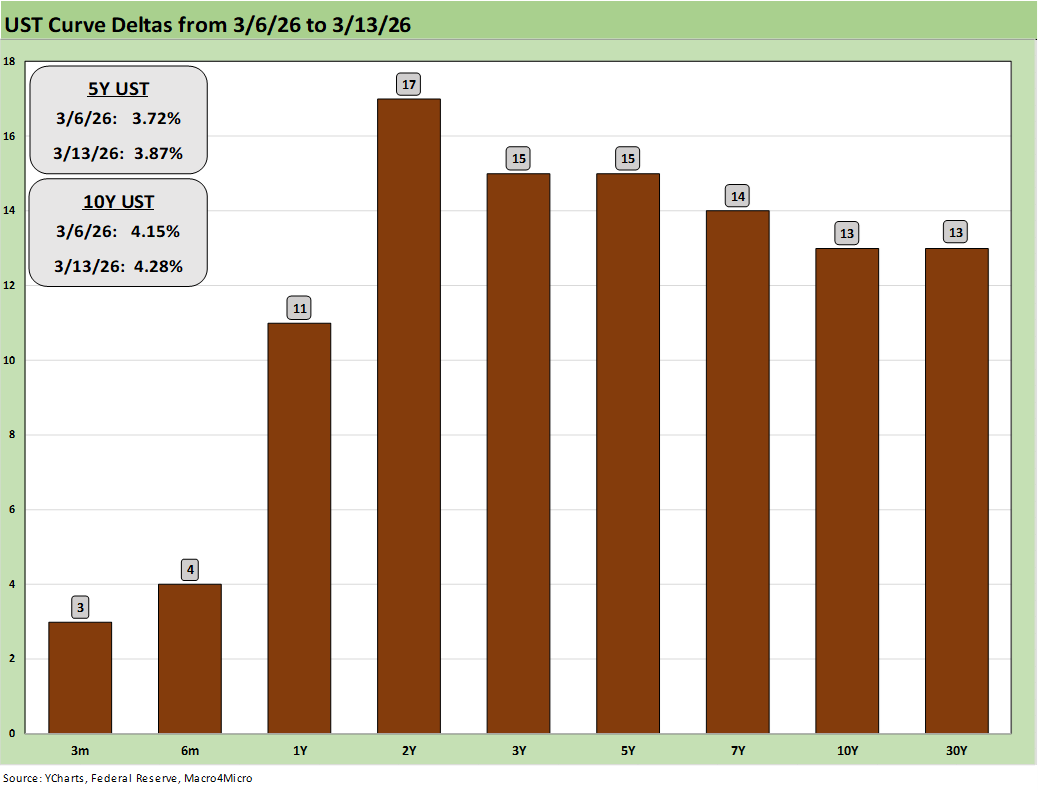
The past week brought some notable moves higher along the UST curve with the 2Y UST leading the double-digit pack but with a relatively uniform rise from 2Y to 30Y.
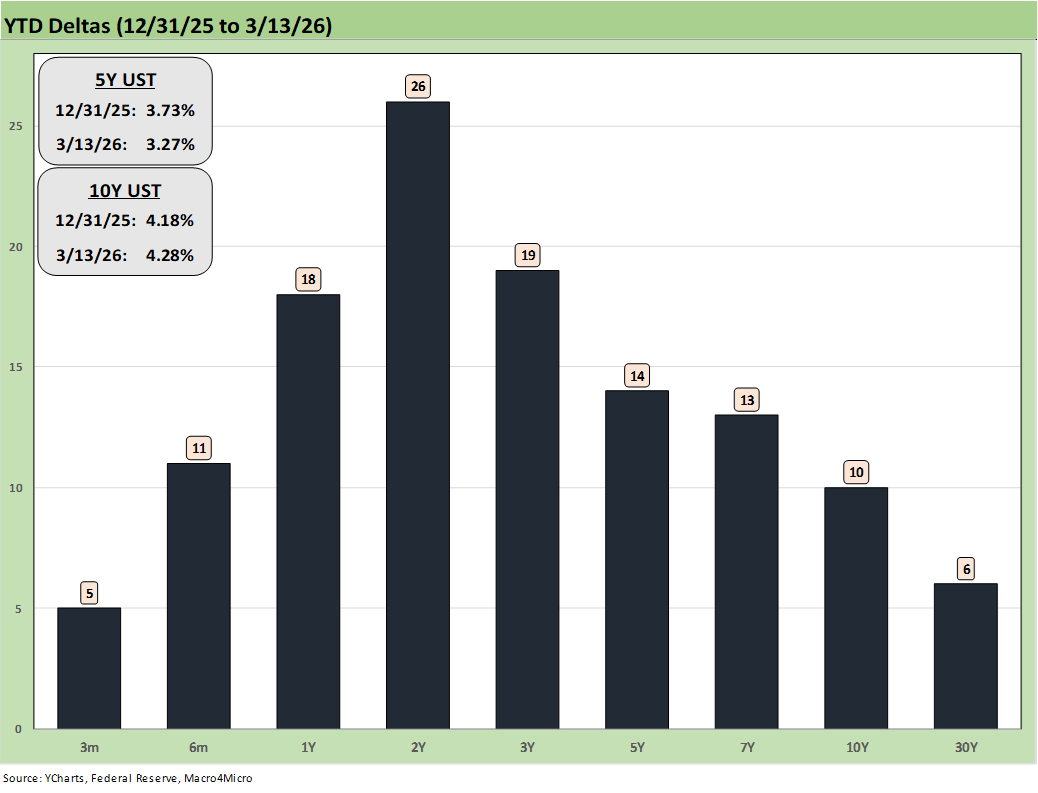
The YTD UST has been so far delivering a bear flattener with the 2Y UST at +26 bps with the 10Y UST at +10 bps. The eroding odds of easing this year could create some interesting dialogue in the FOMC meeting this week with some veiled digs and the ability of Warsh to execute on a Trump-dictated auto-easing regime when he takes the helm in May. The Iran adventure (war? excursion?) has certainly complicated the FOMC rates picture.
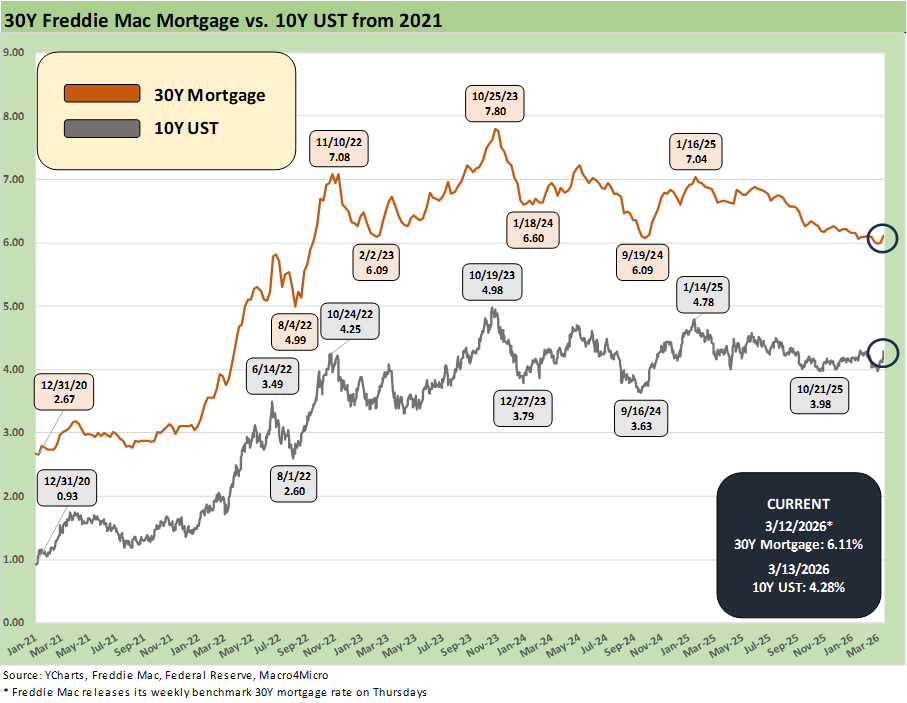
The above time series updates the 10Y UST vs. Freddie Mac 30Y mortgage timeline. Freddie is set on Thursday midday, and we saw some wild action in the broader mortgage markets with the Mortgage News Daily survey at 6.41% by late Friday.
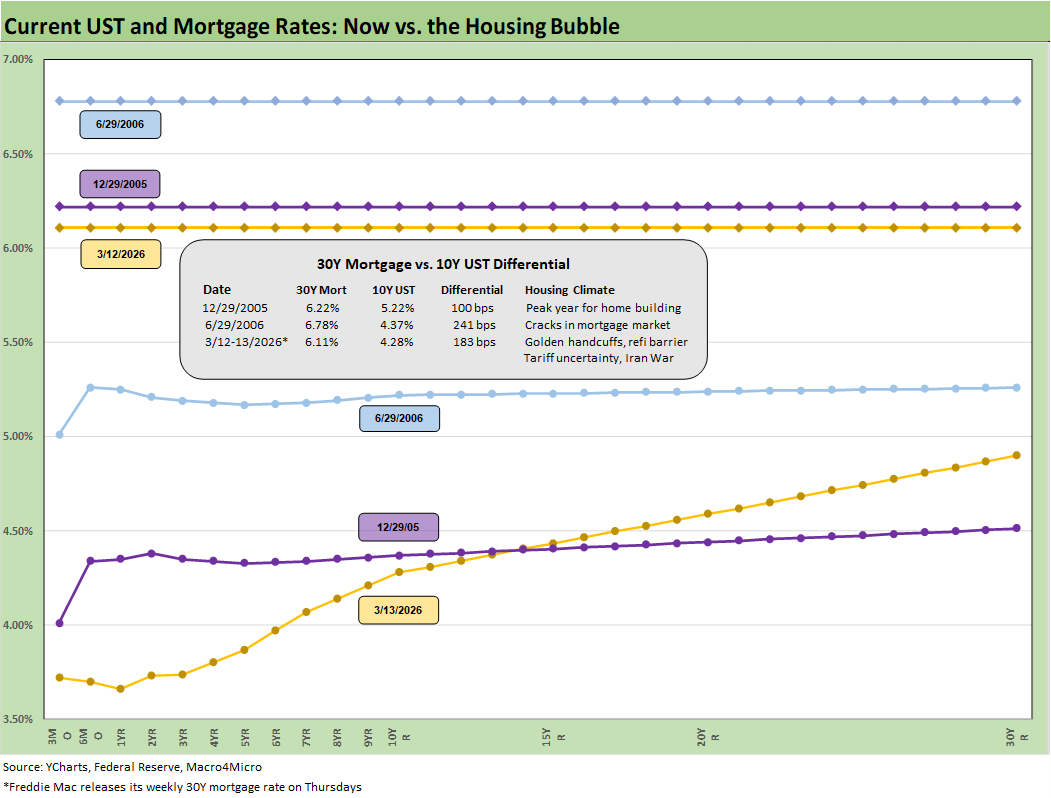
The above chart frames the current UST curve and Freddie Mac 30Y and compares it to what was in place at the end of the peak homebuilding year (2005) and the mid-2006 time frame as the RMBS quality problems were starting to surface. We also frame the differential of the 30Y mortgage and the 10Y UST.
We could start to see the 30Y mortgage rate and 10Y UST both moving higher, and the question will be whether that will drive any pricing adjustments (lower?) in the housing sector. The housing supply-demand dynamics do not signal that as likely, but we are seeing more pricing pressures in the homebuilding sector. We are not seeing that in the existing home sales reporting (see Existing Home Sales Feb 2026 3-10-26). New home sales report this week.
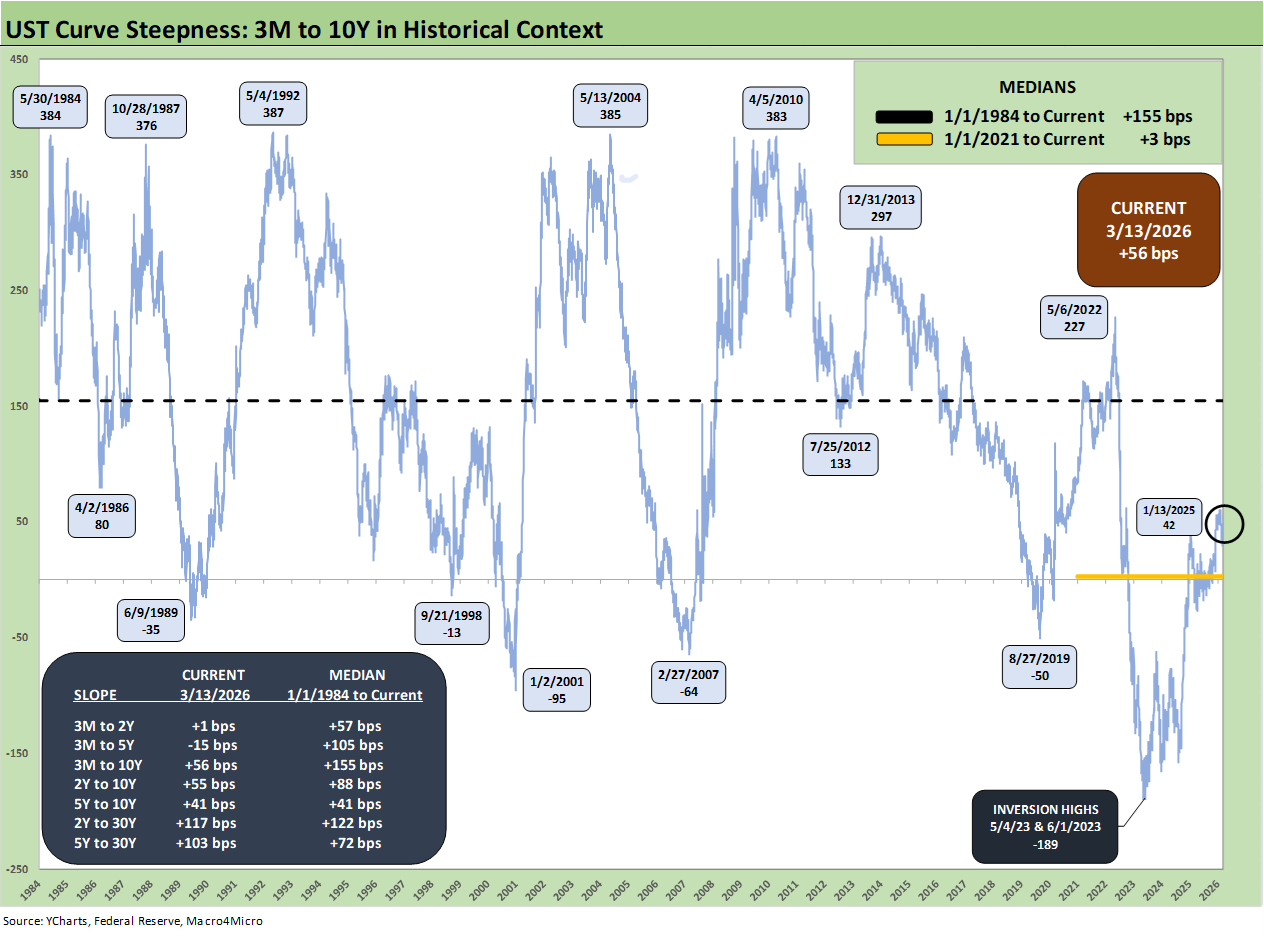
As noted in the UST deltas above, the UST curve is shifting higher with the 2Y UST moving more in light of the declining odds of FOMC easing. We include a number of UST segment slopes in the box within the chart and plot the longer term 2Y to 10Y in the time series line.
The upward sloping curve at +55 bps for 2Y to 10Y is inside the long-term median of +88 bps. The expectation of a bull flattener from UST bulls looks to be disappointed again, but the steepener trade will require some Fed support from the front end. The Iran events are diminishing those easing odds of late with stagflation now showing the highest risk of unfolding since the 1980-1982 double-dip years.
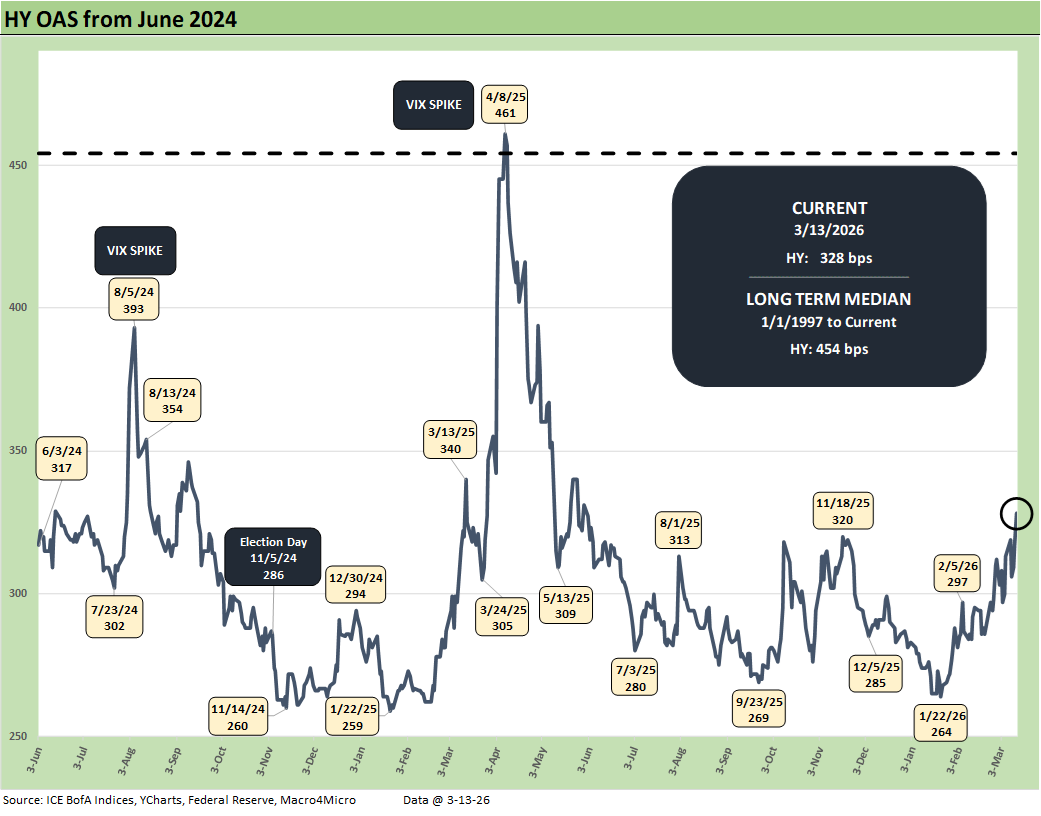
The above chart updates the time series for HY OAS from mid 2024, and we see the upward climb back to +328 bps from the +264 lows of Jan 2026. That remains well below the long-term median of +454 bps and post-Liberation Day spike to +461 bps in early April 2025.
While we are now comfortably above the June 2007 bubble levels where the markets have been hovering, the current +328 bps is in the neighborhood of two cyclical low points from bygone years such as in June 2014 when HY spreads hit +335 bps (6-23-14) and early Oct 2018 when HY hit +316 bps (10-3-18). Dec 2021 saw lows of +301 bps during the ZIRP period.
That history and risk-reward symmetry leaves a lot of room for HY spreads to go wider.
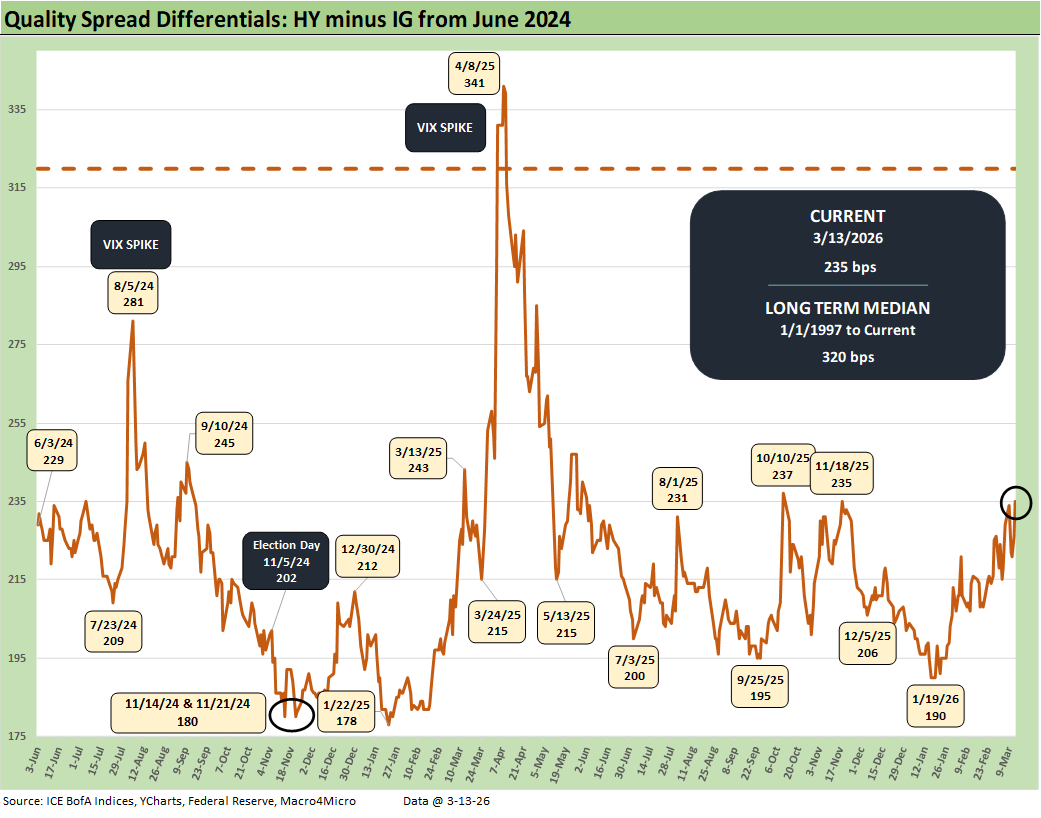
The above time series updates the quality spread differential for IG vs HY (HY OAS minus IG OAS). Quality spreads are trending wider but with the current +235 bps much tighter than the long-term median of +320 bps.
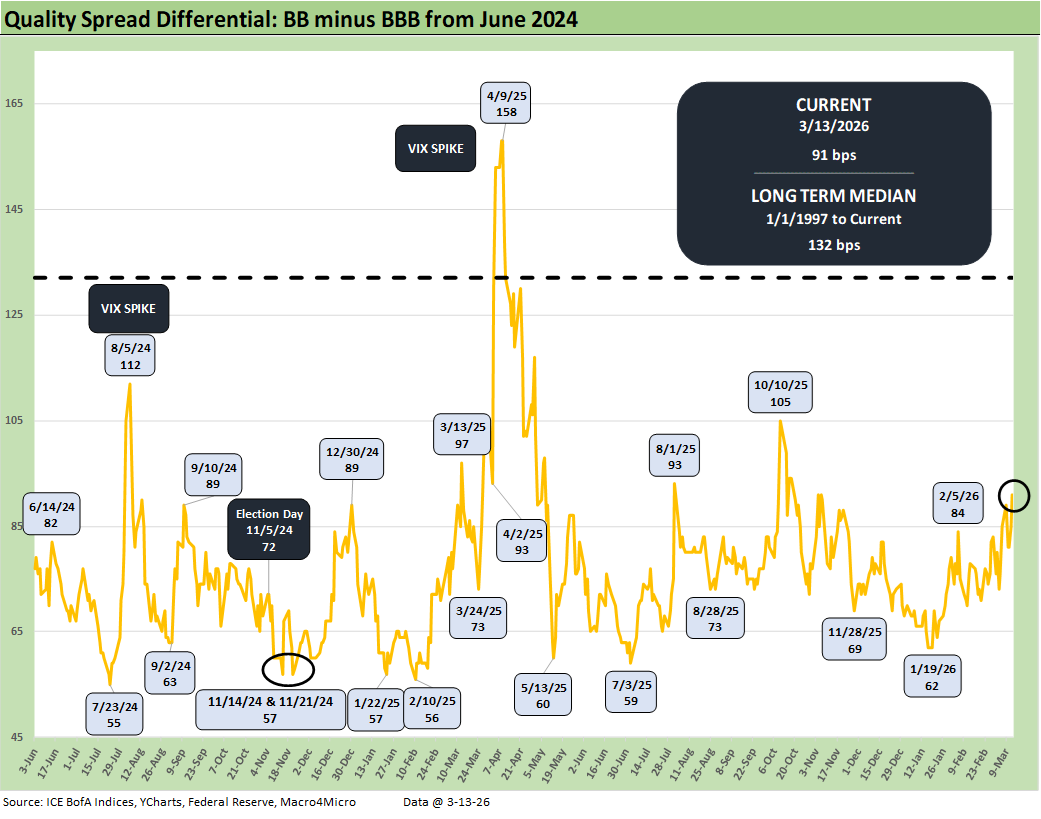
The above time series updates the quality spread differential between the BB and BBB tier (BB OAS minus BBB OAS). The differential of +91 bps is well inside the +132 bps long-term median and materially wider than the high 50+ bps and low 60s bps seen from mid-2024 through early 2026.
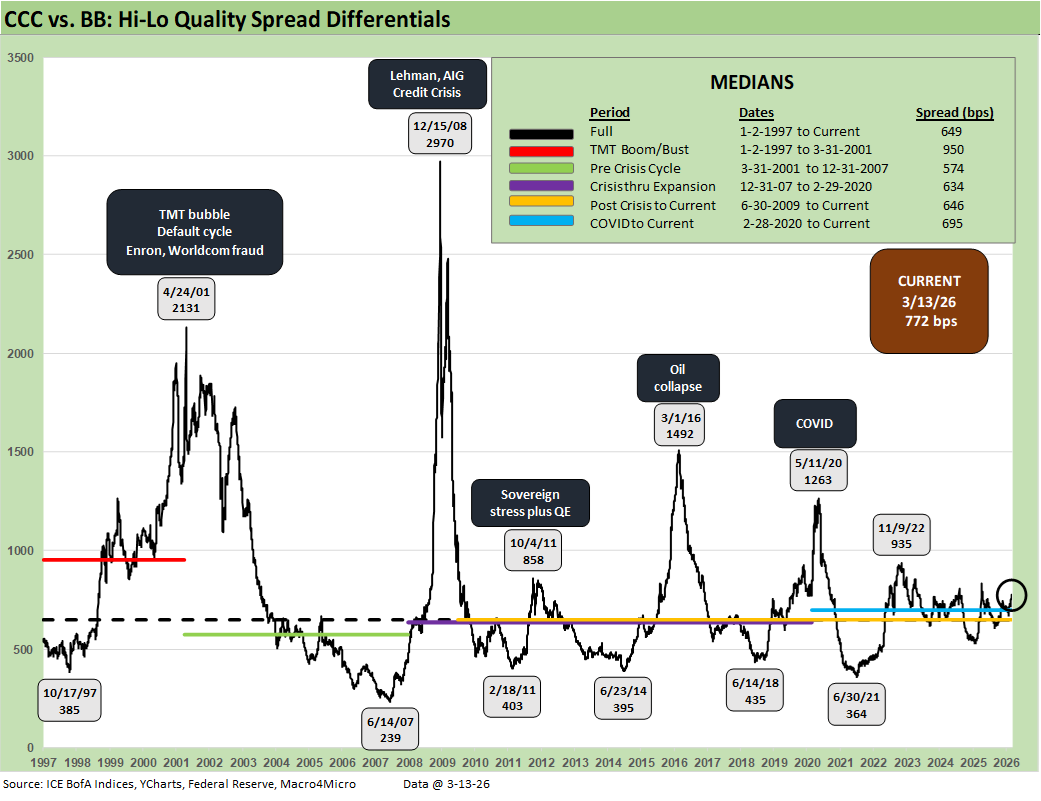
The Hi-Lo quality spread differential frames the upper HY tier BB OAS levels vs. the high risk CCC tier. The current +772 bps is wide to the +649 bps long-term median OAS. With the BB tier tight and a high mix of BBB tier investors who have dropped down into being BB tier buyers across the years, there is a different demand dynamic.
There is a different supply mix flavor in the CCC tier this cycle since the most leveraged deals, and the late cycle crazy deal flow of past cycles are not in the HY bond index in scale this time but in private credit. The stress in private credit will necessarily impact CCC tier HY bond pricing as investment alternatives, but the origination cycle and borrower profile this time is a departure from the past.
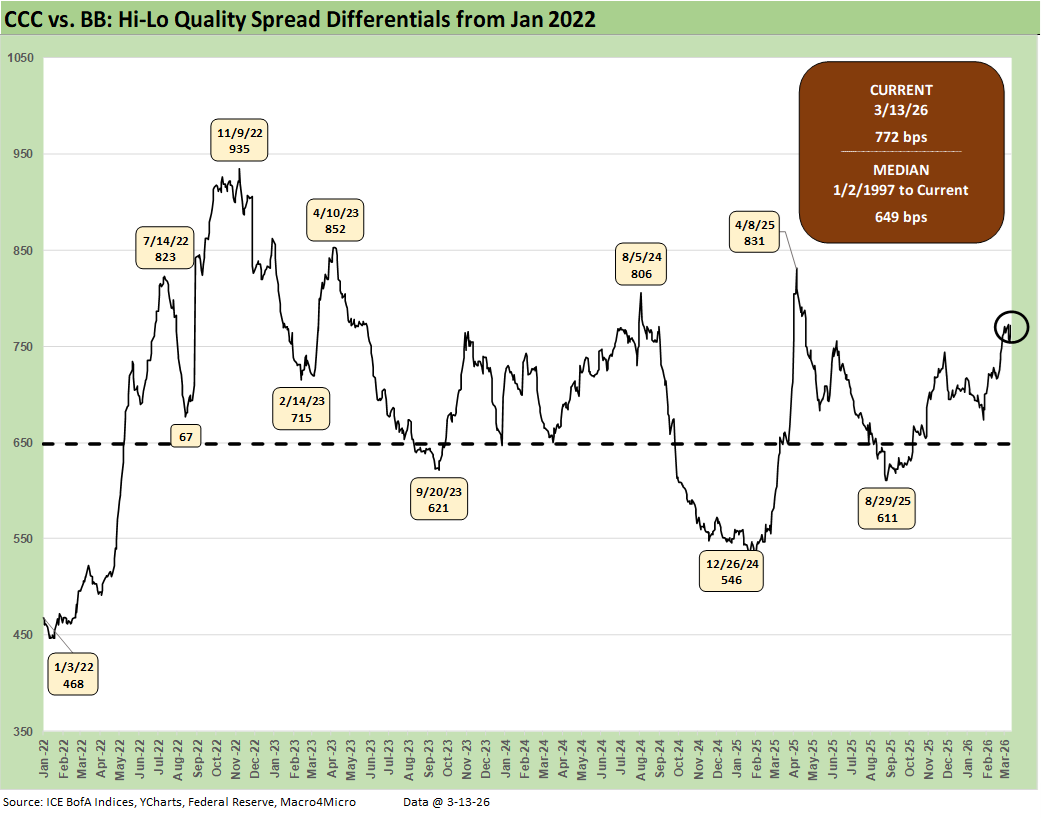
The above time series shortens up the Hi-Lo, BB vs. CCC tier timeline to a start date in early 2022 just ahead of the tightening cycle. The spike from +468 bps in Jan 2022 to a wide of +935 bps in Nov 2022 offers a reminder of how credit volatility can turn on quickly and with material pricing impacts.
See also:
Market Commentary: Asset Returns 3-15-26
PCE Inflation Jan 2026: Personal Income & Outlays 3-13-26
GDP 4Q25 Second Estimate: Sharp Move Lower 3-13-26
Housing Starts Jan 2026: Total Starts Up, Completions Up, Permits Down 3-12-26
CPI Feb 2026: It’s Making You Wait… 3-12-26
Existing Home Sales Feb 2026 3-10-26
Market Commentary: Asset Returns 3-8-26
Payrolls Feb 2026: Into the Weeds 3-8-26
Employment Situation Feb 2026: Payrolls Get Ugly 3-8-26
VIX: Market Still Not Getting the Vapors 3-6-26
Meanwhile…Back in Economics and Tariffs 3-2-26
2025 trade Deficits: Reality vs. Rhetoric 2-19-26
Industrial Production Jan 2026: Capacity Utilization Trends 2-19-26
2025 Spread Walks and Multicycle Return Histories 1-5-26
Annual Return Differentials: HY vs. IG Across the Cycles 1-3-26