
Industrial Production March 2026: Mixed Picture, Big Questions Ahead
The Industrial Production and Capacity Utilization numbers show a light fade but are steady overall across 1Q26.


Automotive chain sputtering a bit with EV upheaval and tariffs
The modest decline in Industrial Production saw a -0.5% drop, but 1Q26 grew at +2.4% ahead of the March fade. Capacity Utilization ticked slightly lower for March in Manufacturing, Durables, and Nondurables.
Manufacturing capacity utilization for 1Q26 ticked up from 4Q25 but was below 3Q25 as the industrial sector waffles. Manufacturing is struggling to show a clear trend in the midst of tariff pressures and the Iran War fallout. We have seen inflation in goods and some pricing power, so we know the demand side has not taken too much pain yet. Earnings expectations broadly for 1Q26 are also solid.
The market saw more notable sequential MoM weakness for Capacity Utilization in Mining and Utilities. The YoY numbers for Utilities come with the asterisk of +4.0% capacity growth while Mining capacity shrunk by -0.5%.
With respect to Industrial Production trends across Manufacturing “Market Groups,” we see Consumer Durables down by -3.4% YoY for March with Automotive products at -5.6% YoY. Business equipment showed strength at +4.6% YoY while Defense and Space Equipment posted +3.2%
Across “Industry Groups” (vs. “Market Groups”), “Aerospace and miscellaneous transportation equipment” generated a +6.2% increase with “Computer and electronics, electrical equipment, appliances, components” at +3.6%.
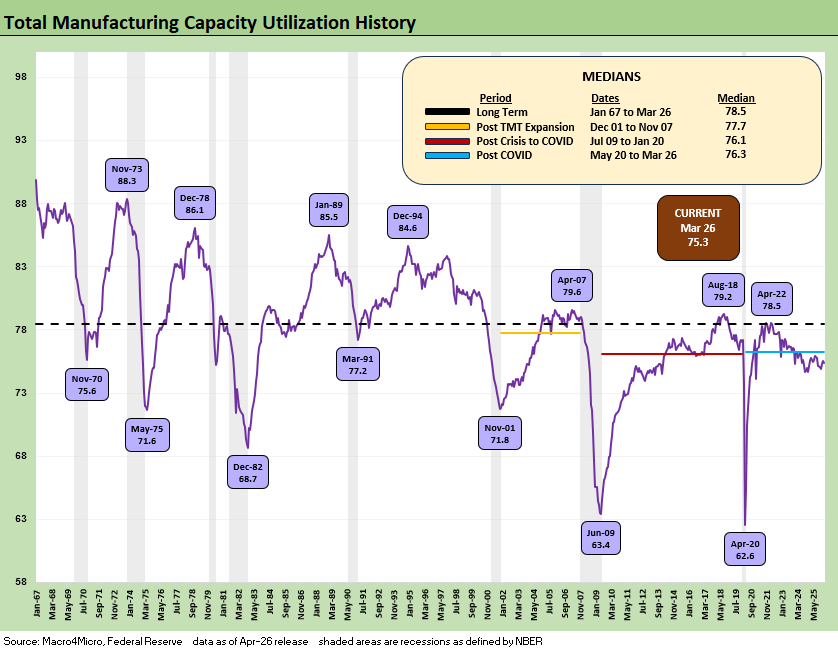
The above chart updates the running capacity utilization for manufacturing since 1967. The current 75.3% is well below the long-term median of 78.5% and below the post-COVID median of 76.3%. That is one of many metrics that take the label of “greatest economy in history” off the table.
We see the material swings across expansion booms and busts. That includes the aftermath of some highly damaging oil spikes that brought on cyclical weakness and later saw capacity utilization plunge. There were a lot more structural changes underway in those cycles than just oil and gas price pressures. That was notably the case in the 1980-1982 double dip as well as the recession of late 1973 to early 1975 when the Arab Oil Embargo set off chain reactions that turned the post-1973 period into an ebb-and-flow of macro nightmares for inflation and the consumer.
The May 1975 low of 71.6% was the first bout of severe stagflation that unfolded after the Arab Oil Embargo. The 1980-1982 double dip recession came after the 1979 inflation spike took off with the Iranian oil crisis.
Capacity utilization saw a 68.7% low in Dec 1982 as the economy was just coming off the recession trough. The first Gulf War came after the August 1990 invasion of Kuwait with capacity utilization hitting a low in March 1991 at 77.2%, which is comfortably above where capacity utilization stands now in 2026.
The age of tech and credit excess in the late 1990s brought some new swoons with 71.8% in Nov 2001 after the TMT meltdown and HY default wave rolled in. The Utilities and Power sector and Telecom capex all took a beating in that time frame.
Then came the post-credit crisis low of 63.4% at the recession trough in June 2009. Mortgages and derivative excess caused a very real systemic panic and deep risk aversion from the Lehman Sept 2008 period and well into 2009. That period was famous for the bankruptcy and bailout of GM and Chrysler. The credit contraction was very real, and the recovery in payrolls was slow to unfold with the consumer hammered by housing sector pain.
COVID edged out the June 2009 utilization bottom with a record low of 62.6 in April 2020 and a 2-month recession. That pandemic period saw ZIRP, supply-demand imbalances and later the Russian invasion of Ukraine and ensuing oil spike that set off inflation and a tightening cycle that still did not trigger a 2022 recession.
As we detail below in the recession histories, the idea of what is low or high for capacity utilization in the context of corporate sector profitability is not as direct as one might think. Breakeven volumes, cost structures and pricing power are key drivers of profits. The tariff excess as a core Trump policy only makes that unit cost analysis more complicated as we head into a new round of energy related cost pressures in 2026. Material costs, operating costs for companies, and consumer discretionary household cash flow headwinds make for a tricky set of moving parts shaped by erratic geopolitical decisions.
The AI fallout and related fears is also a new variable in the mix that cuts across both the services and goods sectors. What AI will mean for productivity improvement vs. payroll fallout will be an ongoing test of theories. Even if AI proves true to the valuation promises and brings a “revolution” of the economy, many will also pay the price. We have been getting a taste in the recent SaaS services panic. Those markets consume a lot of goods.
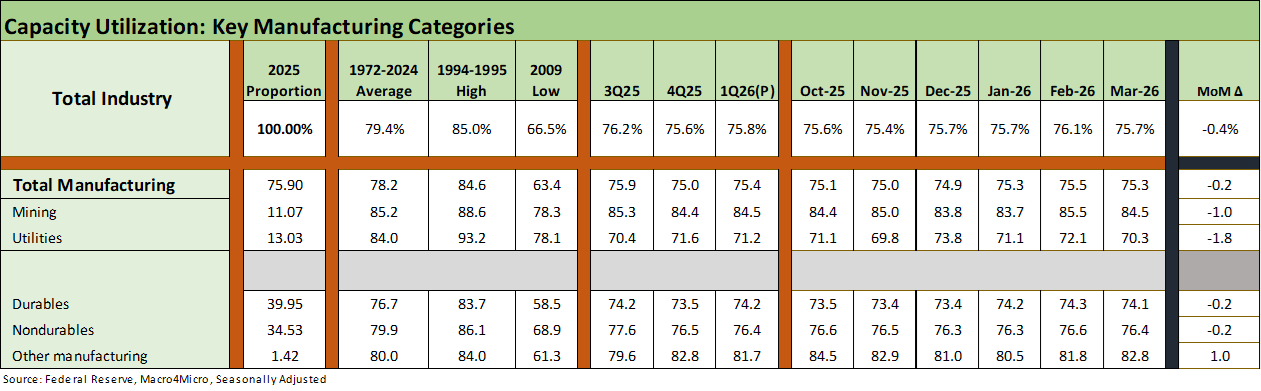
The above table breaks out the high-level groupings with total industry and total manufacturing declining. We include a “delta column” on the right. Mining and Utilities were down sharply for the month. We see Durables and Nondurables as the main events to track, and both are down. The Durables sector is especially important with all of the supplier-to-OEM multiplier effects. That also is the sector more meaningfully tagged by the Trump tariff policies.
Looking back from 2025 into early 2026, we see Manufacturing in a relatively narrow range and the same for Durables. Tariffs have not moved the production needle much at all so far, but that does not tell the profitability story on the tariff cost impact. Most people (outside the White House) know that buyers/importers write the check for the tariff, so that implies a higher breakeven volume or some offsetting action on other costs or pricing. Those impacts will only play out over time across working capital cycles. Pricing decisions were more likely to come at a lag given the White House pressures, so there is a lot more to play out in 2026 earnings seasons and company color.
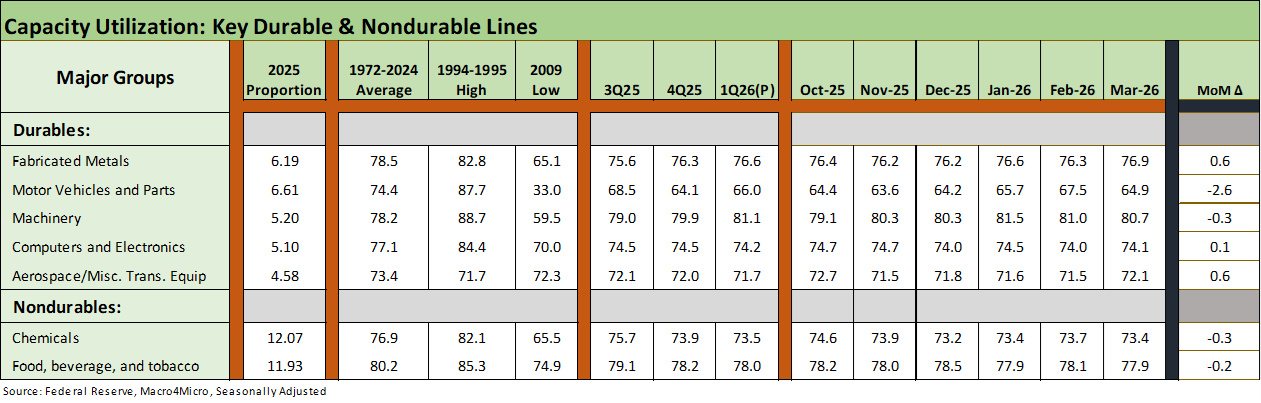
The above table breaks out the details for the top 5 Durables lines and the two largest Nondurables lines. We include the capacity utilization deltas in the column on the right. We see a mixed picture across these major industries with only Motor Vehicles and Parts making a notable move lower. We see 2 of 5 Durables lines tick lower with Machinery slightly lower and Motor Vehicles and Parts taking a bigger hit. The two major Nondurables lines also declined with Chemicals and Food & Beverage.
The consumer story and the corporate sector capex optimism will be important to watch in coming weeks and months as guidance gets updated and the Iran fallout starts to flow into strategies from global players to small and midsized enterprises.
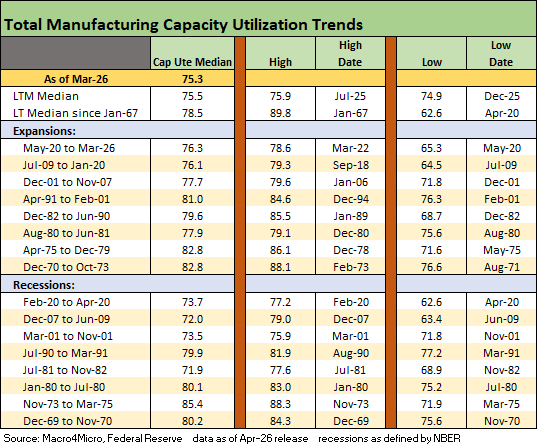
The above table updates the capacity utilization history for expansions and recessions. As we routinely discuss, the ability of companies to generate solid profits at lower capacity utilization in today’s markets relative to past cycles is tied to both automation and the evolution of low-cost global supplier chains.
Low-cost supplier chains are getting undermined by tariffs, so the demands to improve efficiency as tariff mitigation measures need to be monitored. We are also seeing some important low-cost suppliers in the Gulf, and that area is essentially in a multi-tiered blockade. The “AI story” and what it all means for productivity and headcount will be a big part of that theme.
The weakness in the dollar is not going to help supplier chain costs from offshore, and a weaker dollar has the effect of inflating the tariff cost in dollar terms depending on the import nation.
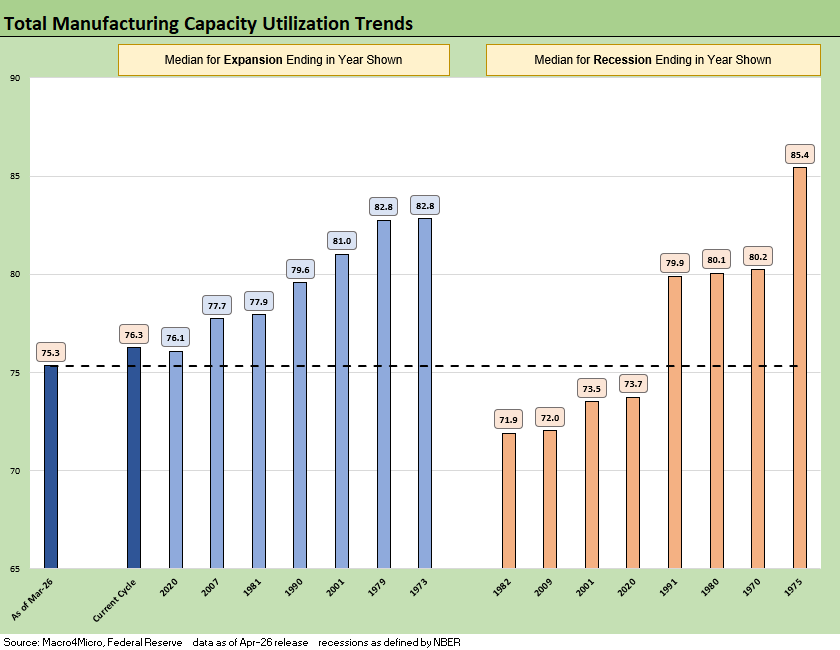
The above chart details economic expansion and recession averages and lines them up by height as a frame of reference. We see the current level on the left at 75.3%. The fact that the current capacity utilization is below numerous recession averages posted on the right side of the chart also scoffs at the recurring “Golden Age” and “hottest country” rhetoric.
In the context of the tariff priorities and reshoring ambitions, the slack capacity implied by the chart underscores the analysis is a lot more complicated than just “build more plants” and “keep tariffs high” to force reshoring. That is a story told on an industry-by-industry basis, and the weakness seen in auto sector production and utilization numbers is a sea level example of where an industry has arguably been hit the hardest by tariffs.
The multiplier effects are important, but the relocation of supplier chains and OEM relocation is by definition very slow to unfold given intrinsic lag times, tooling equipment and contracts in place. There is also the fact that the cost of relocation has also risen with all the tariff effects for materials, components, and qualified labor. Autos are the main relocation stories, but that is generally going to be tied to existing infrastructure and not a strategy of all-new greenfield plants. In the end, many companies can just wait for Trump to “move on.”
See also:
Existing Home Sales March 2026: New Beginnings or New Ends? 4-15-26
Producer Price Index March 2026: Heater or Curve Ball? 4-14-26
Market Commentary: Asset Returns 4-12-26
CPI March 2026: The CPI Cycle Could Prove Maddening 4-12-26
4Q25 GDP: More Adverse Revisions in the Golden Year 4-9-26
The US as an Aspiring Emerging Market: Fiscal SNAFU, Political FUBAR 4-6-26
Employment Situation March 2026 4-4-26
Payroll Focus: ADP Highlights March 2026 4-1-26
JOLTS Feb 2026: Openings Down, Hires Down, Layoffs Up 3-31-26
Market Commentary: Asset Returns 3-30-26
UST Deltas: Elevation Realities 3-29-26
Market Commentary: Asset Returns 3-23-26
Market Lookback: Confusion Reigns, Dislocation Pours 3-22-26
New Homes Sales Jan 2026: The Nays Carry 3-19-26
Market Lookback: The Gulf of Cause and Effect 3-15-26
Housing Starts Jan 2026: Total Starts Up, Completions Up, Permits Down 3-12-26
 |
|