
Synchrony Financial: Favorable Consumer Credit Signals
Synchrony is our favorite bellwether for a micro look at consumer credit quality and spending. The 1Q26 numbers were positive.


Diversity of sales platforms makes SYF a very useful consumer sector indicator.
Synchrony (SYF) posted a 1Q26 performance that sends favorable signals around the consumer sector and related spending trends while asset quality metrics held in quite well. A big test lies ahead in 2026 on a range of consumer headwinds and payroll worries that lurk. Household discretionary cash flow will be feeling the affordability pinch, as will many business lines, from the Iran fallout.
SYF has been our favorite bellwether to monitor given the mix of accounts, the scale of operations, and the disclosure granularity by sales platform. SYF’s narrow credit card focus offers more data to track across a range of subsectors in retail, health care, and other services. We covered the steadily expanding partner network in an earlier detailed report on SYF (see Synchrony: Credit Card Bellwether 10-30-25).
For 1Q26, we see charge-offs down YoY, 30-day and 90-day delinquencies essentially flat YoY, net interest margins higher YoY, and an allowance cushion that is almost double charge-offs.
Betting against the US consumer has typically been a bad idea even if occasionally betting against underwriting standards of various lenders is sometimes a good idea. Synchrony financial has not been one to bet against, however, even when consumer sentiment is at an all-time low, the affordability of the “household basket” is trending in a negative direction, and payrolls have been stagnant in cyclical context.
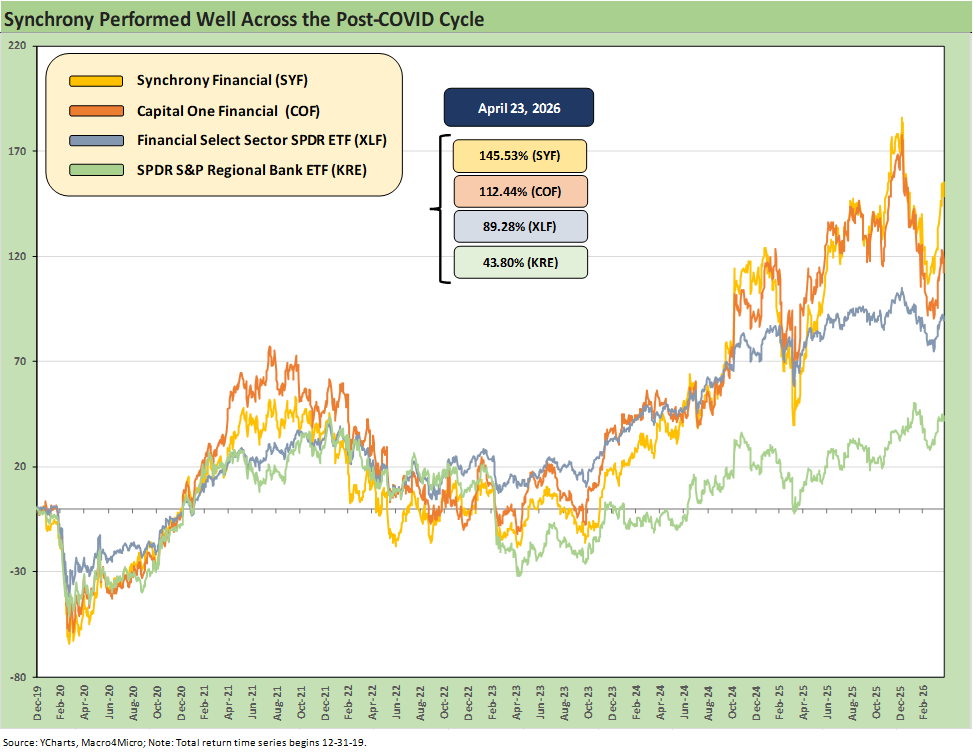
The above chart highlights the superior performance of Synchrony in the equity markets relative to other major consumer finance companies. We include Capital One in the chart as a good comp. We also include the Financials ETF (XLF) and Regional Bank ETF (KRE). We looked separately at a number of consumer finance operations and related asset quality metrics across the financials peer group. Each consumer lending operation can have its own flavor (credit cards, auto, instalment credit, etc.), but we see “cards” as one of the best gut checks on spending and asset quality.
For SYF, steady asset quality and very high net interest margins have brought rewards to shareholders across time. As detailed above, SYF has shown its resilience across the period from the end of 2019 and across a pandemic, an inflation spike, a Fed tightening cycle, and now into a low payroll and low consumer confidence stretch. From the end of 2019, SYF equity total returns soundly beat COF, the XLF ETF, and KRE.
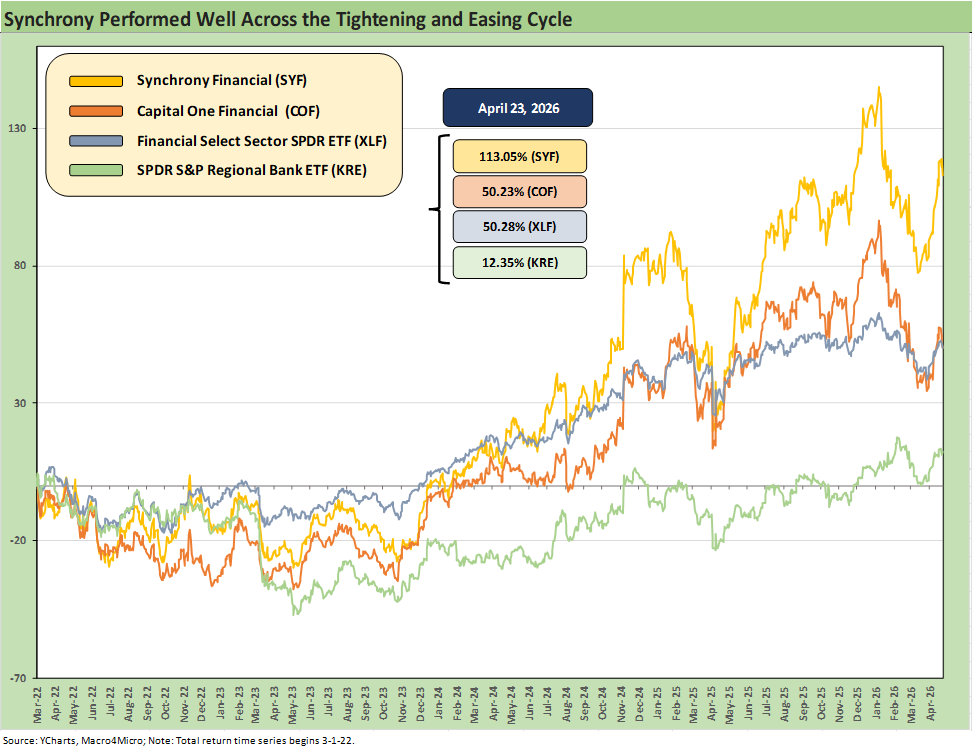
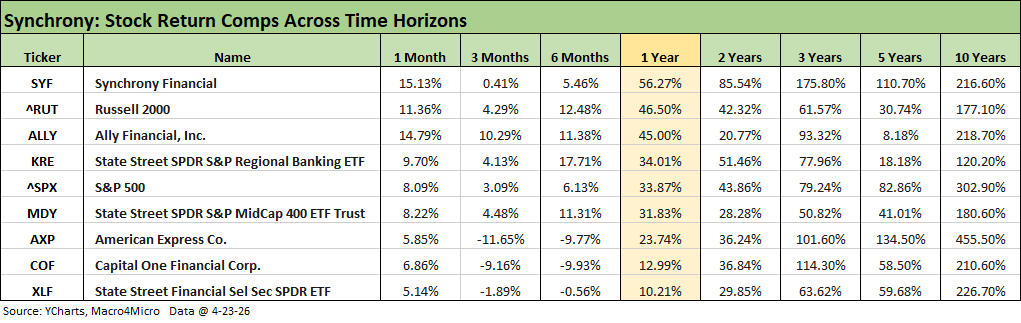
The above SYF stock return chart plots the performance from the start of the tightening cycle in March 2022. SYF materially outperformed the Financials ETF (XLF), Regional Bank ETF (KRE) and Capital One (COF). The table below cuts across more short term and longer term time horizons and we expand the universe of comps to include the broader equity benchmarks as well as dropping in American Express and Ally. We line them up in descending order of total returns for the trailing 1-year period.
For the most recent activity, the news out of 1Q26 and the related guidance was favorable. With 1Q216 earnings, SYF announced a dividend increase of 13% and a major upsizing of its stock repurchase program to $6.5 bn.
Our interest in SYF is mostly about its role as a bellwether for credit card trends in the “normal people” crowd and not the “black card” types. The spending in areas such as the Home & Auto platform and the Health & Wellness market reflect some of the more challenging and sometimes unpredictable spending buckets in the typical household experience. The market is facing the headwinds of rising costs. We break out those platform and sector trends further below.
Given the “all-time low” headline around consumer sentiment, low employment growth, AI and services fears hitting various stocks and flowing into layoffs (Meta and Microsoft), and the recent Iran War fallout, the next two quarters will be a test in asset quality and delinquency trends. For now, the asset metrics mix is holding in quite well. Iran damage, tariff cost mitigation actions (i.e., layoffs) and AI capex causing payroll expense offsets roll up into a complex set of moving parts for the consumer in 2026.
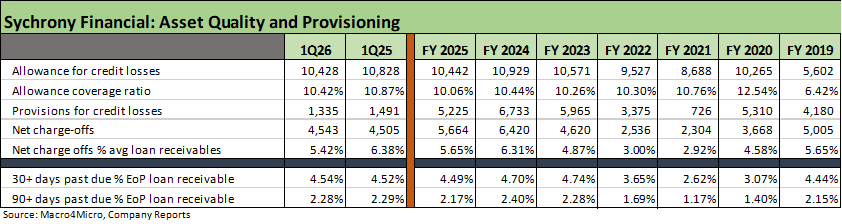
The above table updates the chart we introduced in the Oct 2025 report (see Synchrony: Credit Card Bellwether 10-30-25). We see steady trends overall across charge-off metrics, allowance adequacy, and 30-day and 90-day delinquencies. The 1Q26 period saw charge-offs as a % average loan receivables improve more notably from 1Q25. Delinquency metrics were essentially flat YoY. Allowance coverage improved.
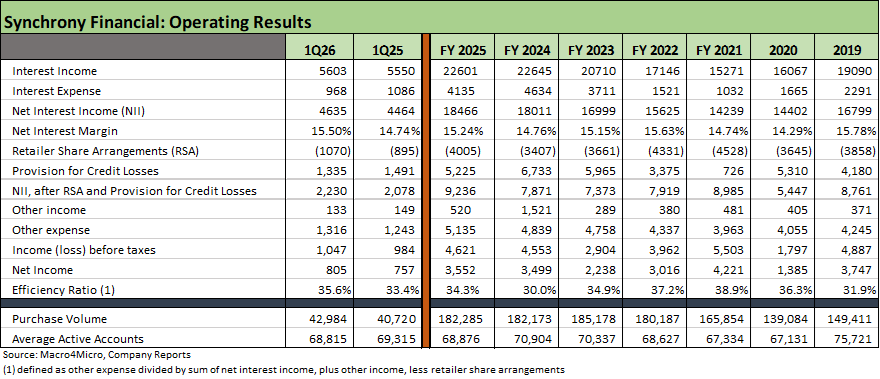
The above table highlights income statement line items and some key headline operating metrics such as purchase volume and average active accounts. SYF has shown discipline in its growth and is not chasing accounts at the expense of prudent risk management. The average active account numbers in 2025-2026 are below 2023-2024 with purchasing volume steady after a 2023 peak.
Net interest margins are an eye-opener at 15.5% with net charge-offs at a low 2% handle. The very brief threat earlier in the year by Trump to propose a10% cap on interest rates went away quickly. There were questions around whether it could even be done legally without legislation. Someone also more likely than not explained to Trump that such a move would damage the consumer finance sector, the banks, and in turn set off a wave of credit contraction that would crush the Personal Consumption Expenditure line (“PCE”) that contributes around 68% of GDP. That 10% cap threat briefly whipsawed some financial equities earlier in the year including SYF and COF (see Policy Mud on the Wall: Consumer Debt, Residential Mortgages 1-15-26).
Another key factor for the consumer finance companies and deposit heavy funders is the direction of FOMC policy and what it all means for funding costs and interest margins. The potential for easing has become more uncertain with the Iran War and how that could flow into Fed actions. The multiplier effects of inflation and energy cost fallout could also flow into consumer credit quality as well as spending appetites.
Other contingent threats ahead include AI multiplier effects into payrolls and distressed drawdown risks on credit cards. The 2026 consumer credit quality challenge is not straightforward. The good news for SYF security holders and lenders is a good track record across some wild macro backdrops even if just since 2020.
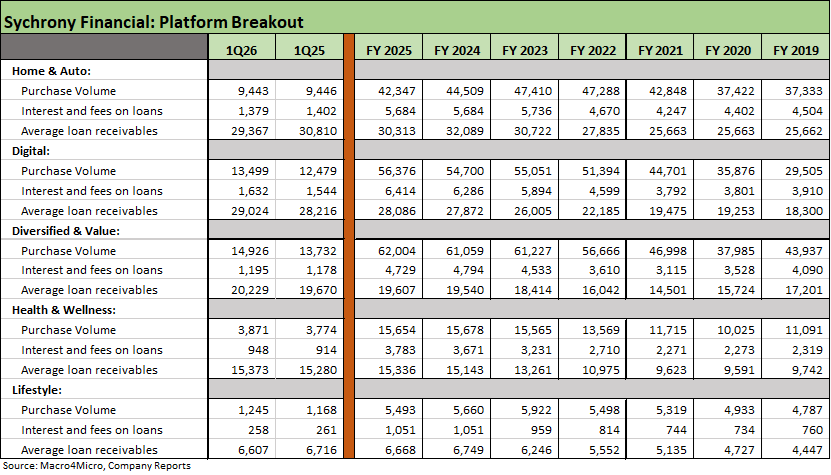
The above table breaks out the trends for the 5 sales platforms since 2019. The scale in each bucket is reflected in the purchase volume and relative receivables balance. A quick scan of the purchase volume and receivables columns comparing 2019 to 2025 tells the story.

The expansion of the partners and range of purchasing channels continues across everything from Health & Wellness (including dental groups and veterinarians) to the usual retail partner programs (Diversified & Value), and online marketplaces (Digital). Home & Auto is tied into demographics in a “driving country” and the rising cost of services and parts and merchandise.
As detailed on the 1Q26 earnings call, the expanded base of partners leaves SYF well positioned for growth in 2026:
We continue to expect accelerated growth in purchase volume and average active accounts without any further broad-based credit refinements as we move through the year. The outcome should more than offset the impact of elevated payment rates to drive mid-single-digit growth in ending loan receivables by year-end. The rate of receivables growth should follow seasonality and accelerate as we move into the back half of the year. This will be driven by growth in our core portfolio as well as a combination of both recently launched and soon-to-be launched programs, including Walmart OnePay, Bob’s Discount Furniture, RH and approximately $725 million of those commercial co-brand loan receivables, which was added in early April.
The new partners list keeps growing as SYF targets more retail product segments in each category across goods and services.

A quick balance sheet update…
Below we update the borrowing and leverage trend line. We wrote the commentary given SYF’s role as a bellwether for consumer asset quality, but the solid balance sheet, capital ratios and financial flexibility excite shareholders given the very favorable excess cash flow and capital ratios that allow SYF to rewards shareholders via dividends and buybacks.
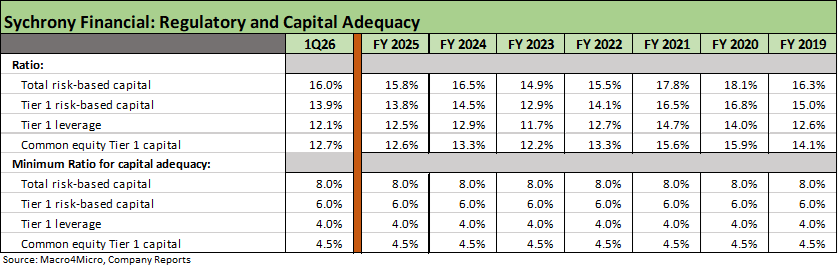
The above table updates the routine quarterly disclosure on SYF capitalization metrics. SYF is very well positioned.
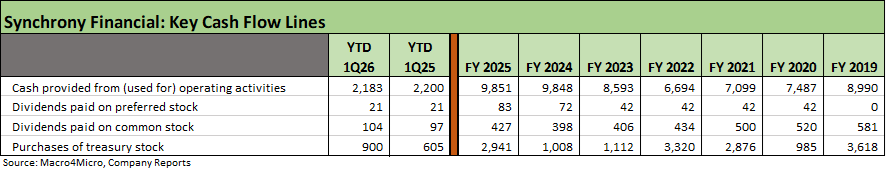
The above table drives home how cash generation has made life pleasant for shareholders as detailed earlier in the relative stock performance charts.
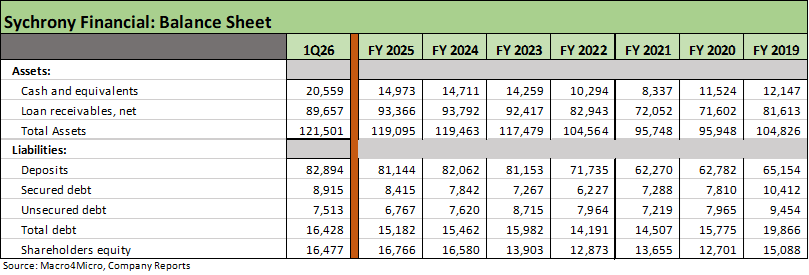
The above table breaks out the balance sheet line items with the most notable trends from 2019 being a larger earning asset base funded by a higher mix of deposits and a lower mix of total debt.
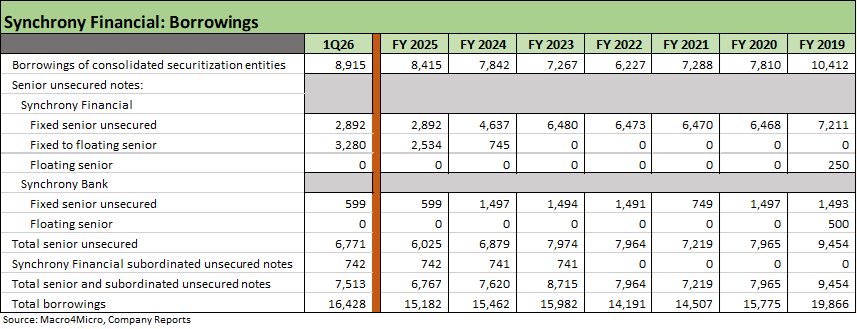
The above table details the mix of borrowings across the capital structure for the holding company and the bank level debt borrowing outside the much-enlarged deposit base detailed in the prior chart.
Synchrony gives some confidence to the market on credit quality with a lot of action to play out ahead with the payroll actions by large employers and small businesses wrestling with tariffs, the Iran War, and AI ramifications.
See also:
Market Commentary: Asset Returns 4-19-26
Industrial Production March 2026: Mixed Picture, Big Questions Ahead 4-16-26
Existing Home Sales March 2026: New Beginnings or New Ends? 4-15-26
Producer Price Index March 2026: Heater or Curve Ball? 4-14-26
CPI March 2026: The CPI Cycle Could Prove Maddening 4-12-26
4Q25 GDP: More Adverse Revisions in the Golden Year 4-9-26
The US as an Aspiring Emerging Market: Fiscal SNAFU, Political FUBAR 4-6-26
Employment Situation March 2026 4-4-26
Payroll Focus: ADP Highlights March 2026 4-1-26
JOLTS Feb 2026: Openings Down, Hires Down, Layoffs Up 3-31-26
UST Deltas: Elevation Realities 3-29-26
Market Lookback: Confusion Reigns, Dislocation Pours 3-22-26
New Homes Sales Jan 2026: The Nays Carry 3-19-26
Market Lookback: The Gulf of Cause and Effect 3-15-26
Housing Starts Jan 2026: Total Starts Up, Completions Up, Permits Down 3-12-26