
Existing Home Sales March 2026: New Beginnings or New Ends?
Existing Home Sales stayed in the low end of the cyclical range at below the COVID lows and under 4M.


Existing Home Sales volumes declined by -3.6% MoM and by -1.0% YoY as the bad news for sales volumes continues. The absolute volume level is more like what we saw in the fall of 2023 when mortgage rates peaked in the high 7% range. Oct 2023 saw the Freddie Mac 30Y benchmark hit a cyclical high of 7.8% with a range of other mortgage surveys and 30Y product offerings around 8%. Freddie is currently 6.37%. The median home price increases YoY have not helped the monthly payment math. The March median existing home sales price edged higher YoY to $408.8K
The mix of household variables in this economy have taken a turn for the worse with weak payroll performance and rising inflation that further eats into real wage growth. Consumer sentiment plunged this past month to an all-time low.
While economists can debate recurring inflation risk, there is no question that “purchasing power” for a given “household basket” has taken a beating and discretionary household cash flow feels the price pressure including at the gas pump and in goods pricing broadly with tariffs (see Producer Price Index March 2026: Heater or Curve Ball? 4-14-26, CPI March 2026: The CPI Cycle Could Prove Maddening 4-12-26).
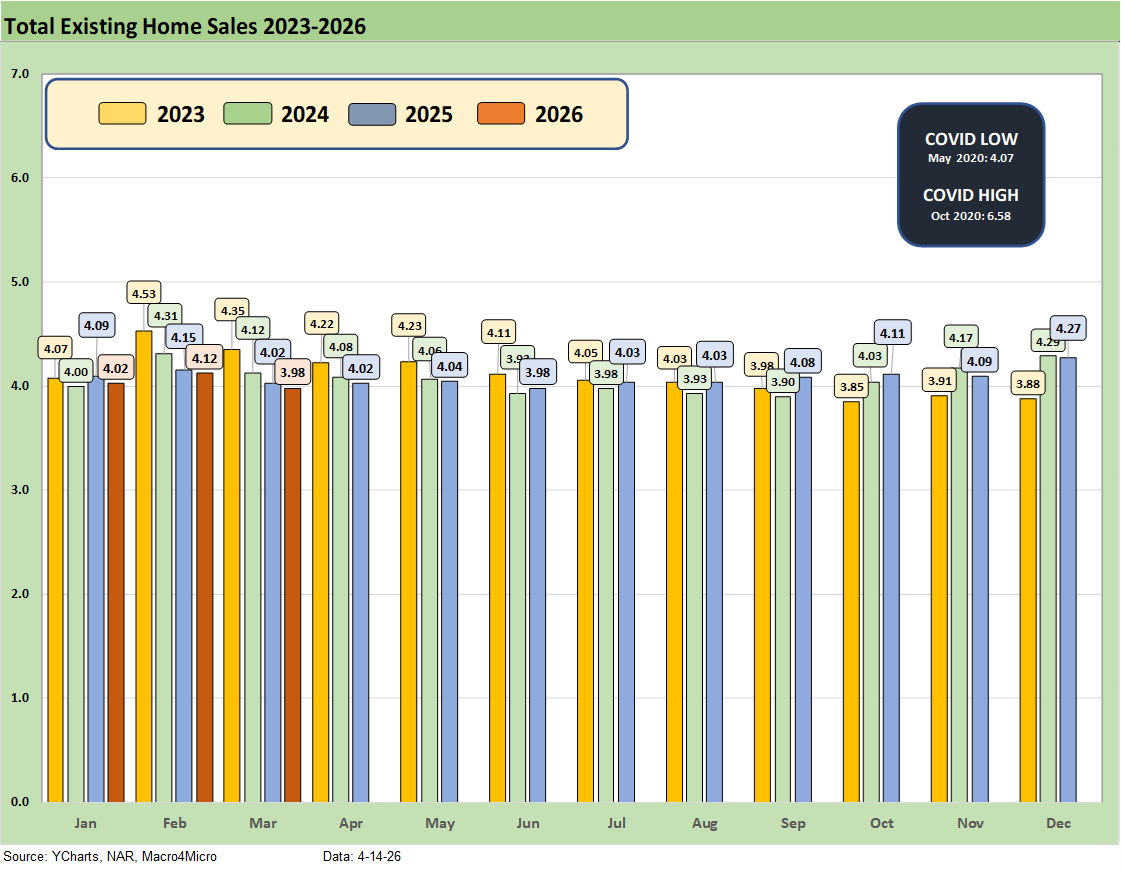
For this month, we moved the historical monthly chart to the top of the commentary as a reminder that the March numbers look more like the late 2023 period when mortgages had peaked (see Existing Home Sales Dec 2023: Rerun of Multi-Decade Low 1-19-24). The 30Y mortgage rates have moved within a 200 bps range since the Oct 2023 peak when Freddie Mac 30Y hit 7.8% and many mortgage offerings were near 8%.
The above chart updates the monthly existing home sales volume across the timeline from Jan 2023 through March 2026. In the interest of visual quality, we deleted the 2022 months when the market was posting 6 million and 5 million handle sales volumes in the first half of that year.
The March 2026 existing home sales number of 3.98 million is an obviously grim number and can be framed against the 3.85 million during the peak mortgage rates in Oct 2023 (see UST Deltas: Elevation Realities 3-29-26). The Freddie Mac 30Y is set on Thursday and posted 6.37% last week. We get an update tomorrow. The Mortgage News Daily Survey 30Y as of the latest close was 6.31%.
The above chart shows the sales volume delta by price tier for March 2026, and we see 4 of the 6 price tiers posting positive growth with only the two lowest price tiers posting declines. That was the same mix of deltas as last week. Note: We use “not seasonally adjusted data” for this chart so it clashes with the declines of overall sales discussed elsewhere in this commentary that use SAAR data (seasonally adjusted annual rate)
The volatility and disruption of the Iran War is undermining the rally we had seen in the mortgage markets with an uptick again in the post-Iran period. After a brief move below the 6.0% line into 5% handle range, the setbacks along the UST curve sent mortgages to 6.31% for the Mortgage News Daily survey as of the latest close. The range has been a tight one, but the recent pop above 6.4% after a brief drop below 6.0% reminds us that high oil prices are something the UST curve and the FOMC do not like. That is true of the bond market broadly. The current rates are still a relief from the 6.6% handles of March 2025 a year ago.
For existing home sales, the monthly payment math is still not working well for those looking to cash out, move up, or simply relocate. Expectations for a bull flattener in the UST market that would translate into low to mid 5% mortgage rates have been thwarted so far as we cover in other commentaries.
The three Fed cuts in the fall of 2025 (-75 bps) followed 3 actions (50, 25, 25) in the fall of 2024, in turn translated into UST curve steepening along the way. Back in the fall of 2024, the UST rally along the curve saw mortgage rates right around today’s level after easing. At that time, the 10Y UST dropped down to around 3.6% (current 4.27%) and mortgages were around 6.0% (current 6.3%). That Sept 2024 rally soon gave way to a steepening and tough road for mortgages into 2025 and now 2026.
Those expecting the 10Y UST to follow fed funds lower have been relatively disappointed since the easing cycle got underway, so the latest debates on how FOMC actions will play out under Warsh do not come with a sense of automatic bull flattening and lower mortgage rates.
Trump was also back on the rage fest today threatening to fire Powell and not supportive of dropping Pirro’s investigation (which Trump demanded). The theory on who could get dropped into a senior Fed role besides Warsh has included Miran, who never met a cut (or multiple cuts) he did not like. The effects of Iran as the dominant variable and the politics of rate bias have left the FedWatch handicapping all over the place in recent weeks as we have covered along the way.
The Iran oil spike and all the knock-on effects for CPI and PCE inflation that will come with energy pressure could make for a lot of frustration in the White House. We have seen the odds of cuts evaporate and hikes rise before falling back. As we go to print, if we look at the rate odds for the Oct 2026 meeting we see 80.3% chance of no change, 17.2% of 1 cut, and 1.3% odds of 1 hike. Looking back to 1 month ago, those October meeting odds of no action stood at 50.1% and the odds of 1 cut at 37.5%.
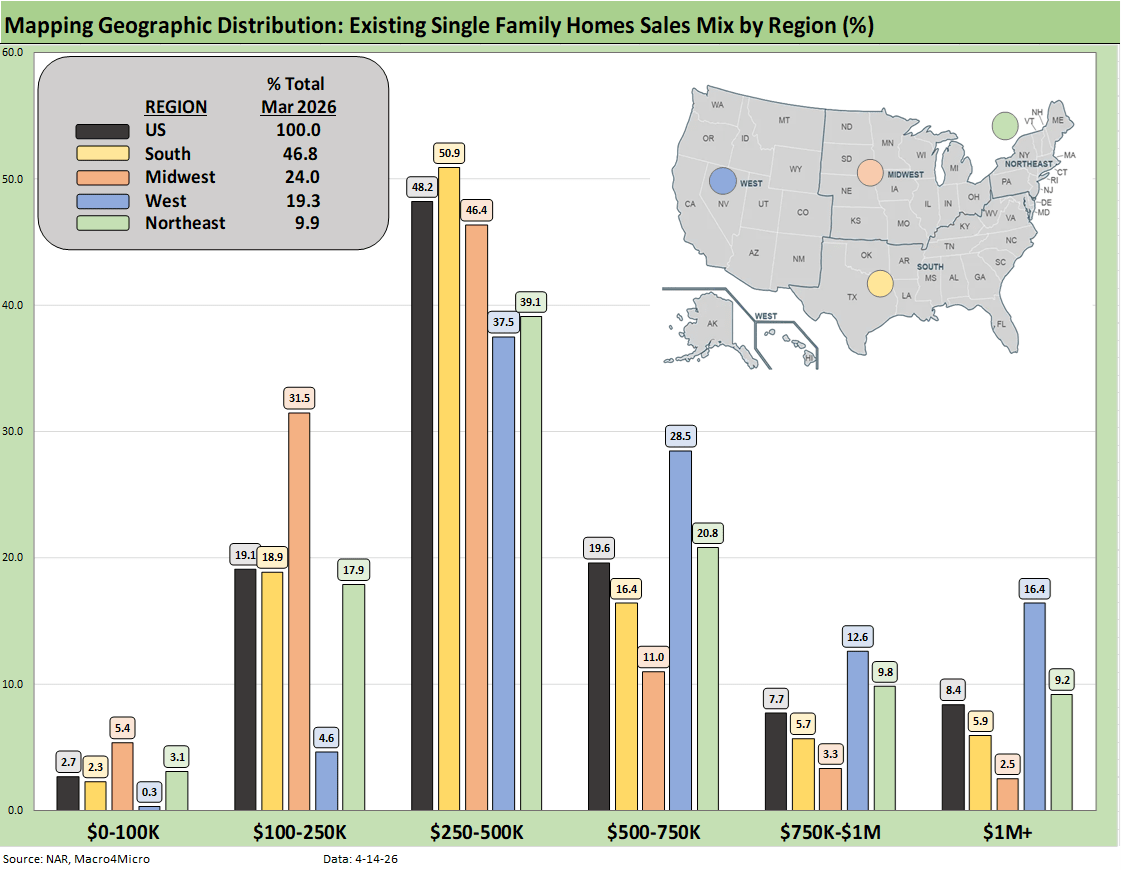
The above chart shows the geographic mix of volumes and details on price mix by region. The South is the main event in single family volumes whether new or existing at almost 47%.
For the bar chart, we break out the mix for each region by price tier. For example, the South shows almost 51% of its existing home sales volume in the $250K to $500K range and almost 19% of its sales in the $100K to $250K bucket.
The high cost of homes in the West (notably California) is clear enough just by glancing at the bar chart with over 16% at prices over $1 million. The second highest in the $1 million club is the Northeast at over 9%.
We see a major concentration across the regions in the $250K to $500K although the $100K to $250K bracket for the Midwest stands at over 31%. The West shows a high share of 28.5% in the $500 to $750K bracket, which again underscores how expensive the West region price tags remain in national context.
The map explains what states are in each Census region. There is a very wide range of home price profiles in the West and Midwest states.
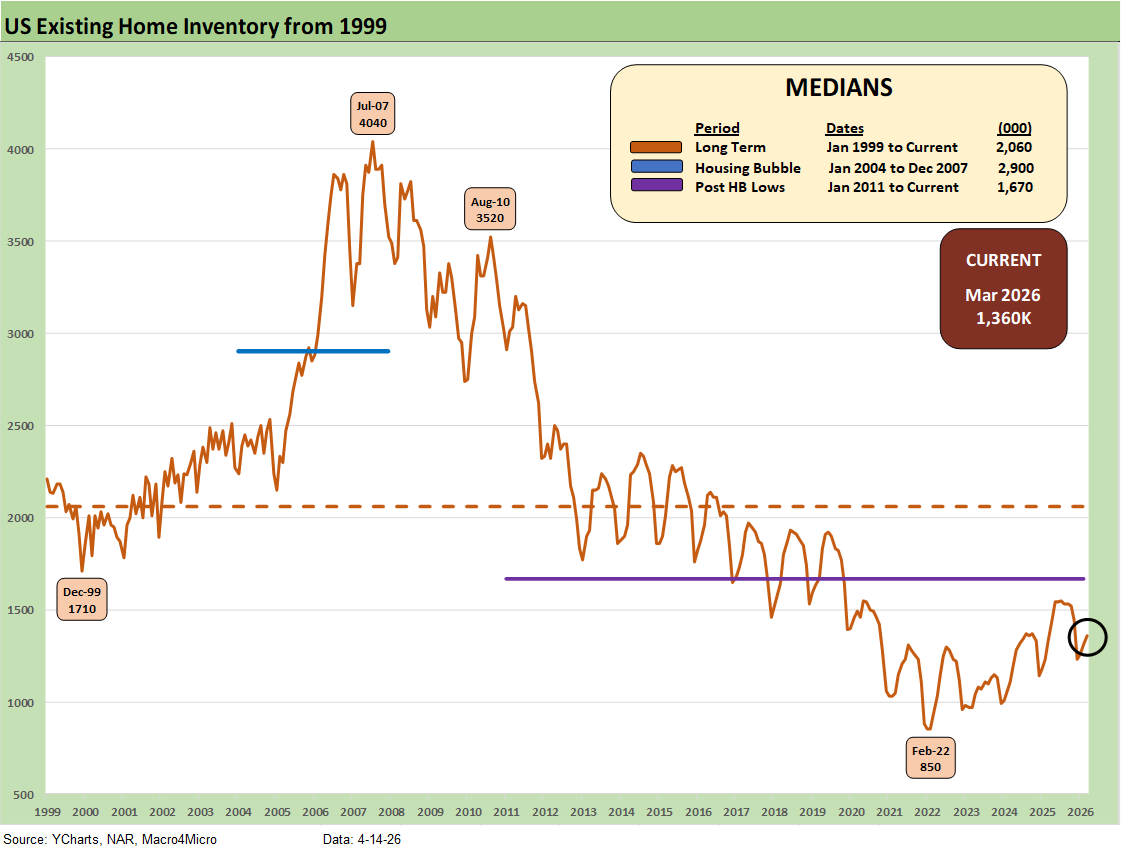
Inventory for total existing homes ticked slightly higher MoM (as revised) to 1.36 million units for +3.0% MoM and +2.3% higher YoY. Current inventory is well below longer term medians including 2.06 million for the post-1998 median. The median from Jan 2011 (homebuilding low) to current times is 1.67 million. In other words, existing home sales inventory remains extremely low even if the level is materially higher than the stunning low of 850K of Feb 2022 ahead of the end of ZIRP and start of the tightening cycle in March 2022.
The existing home inventory balance had shown a steady rise off the sub-1 million lows of 2022. Inventory had risen to the 1.3 million handle range in 2024 before dipping back down to a recent low of 1.14 million to close out 2024. We bounced off those numbers in 2025 to get back above 1.5 million handles before the recent move lower to 1.2 and 1.3 million handles.
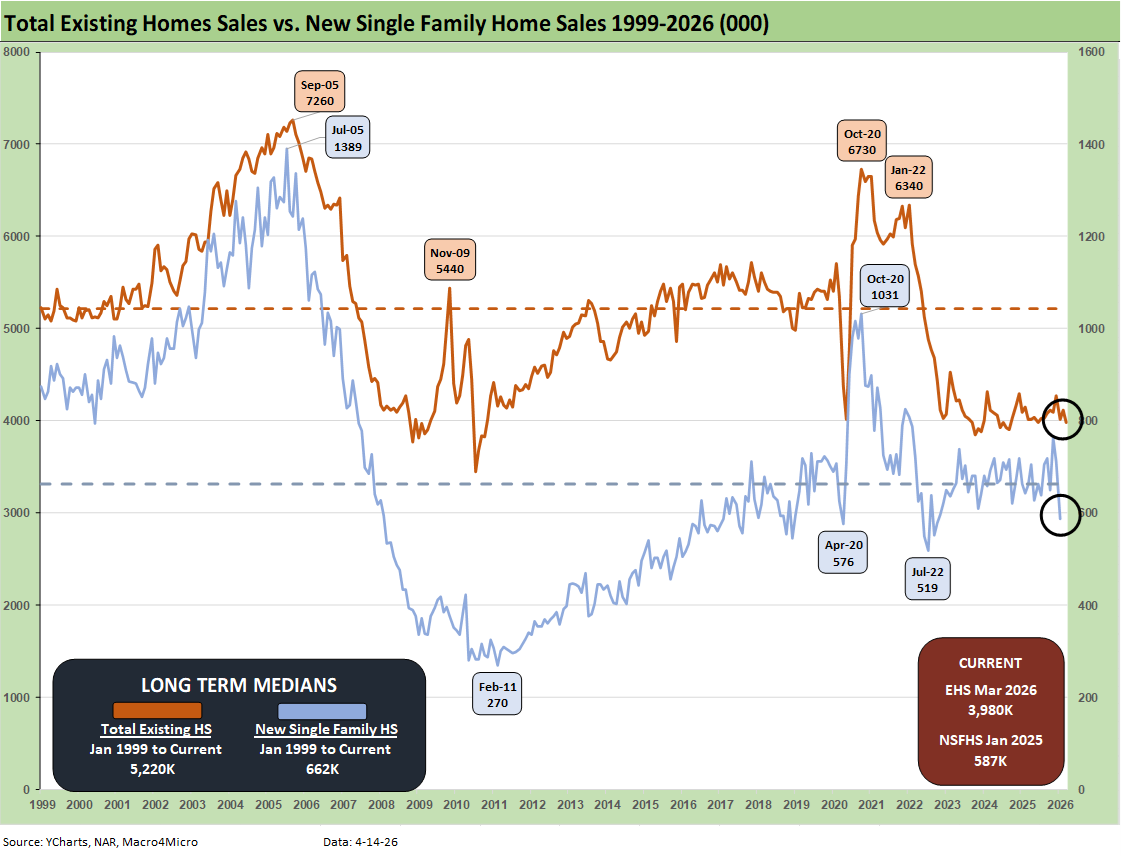
The above two-sided chart updates the trend line in total existing home sales vs. new single family homes. We had been operating without new home sales data from the Census Bureau since the shutdown. We now have January 2025 numbers for new and March for existing. Feb 2026 new home sales data is expected to be released on April 23.
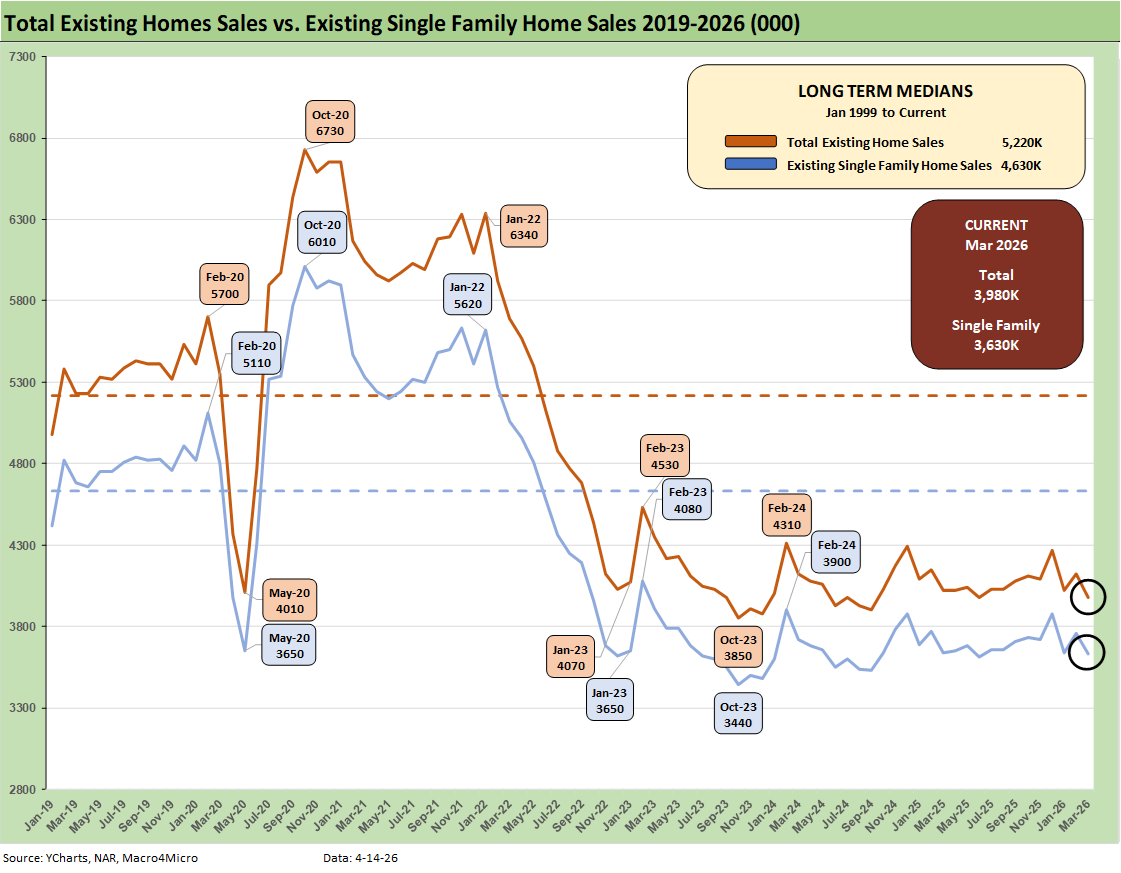
The above chart breaks out the timeline for existing single family alone of 3.63 million vs. total existing home sales of 3.98 million. The 3.98 million for total is well below the long-term median (from Jan 1999) of 5.22 million. The total of 3.63 million for single family is well below the long-term median of 4.63 million.
Existing single family was -3.5% sequentially and -0.3% YoY (SAAR). The lower line is ex-condo/ex-coops. We saw 350K in condo and coop sales in March 2026, down from 380K YoY and down from 370K MoM.
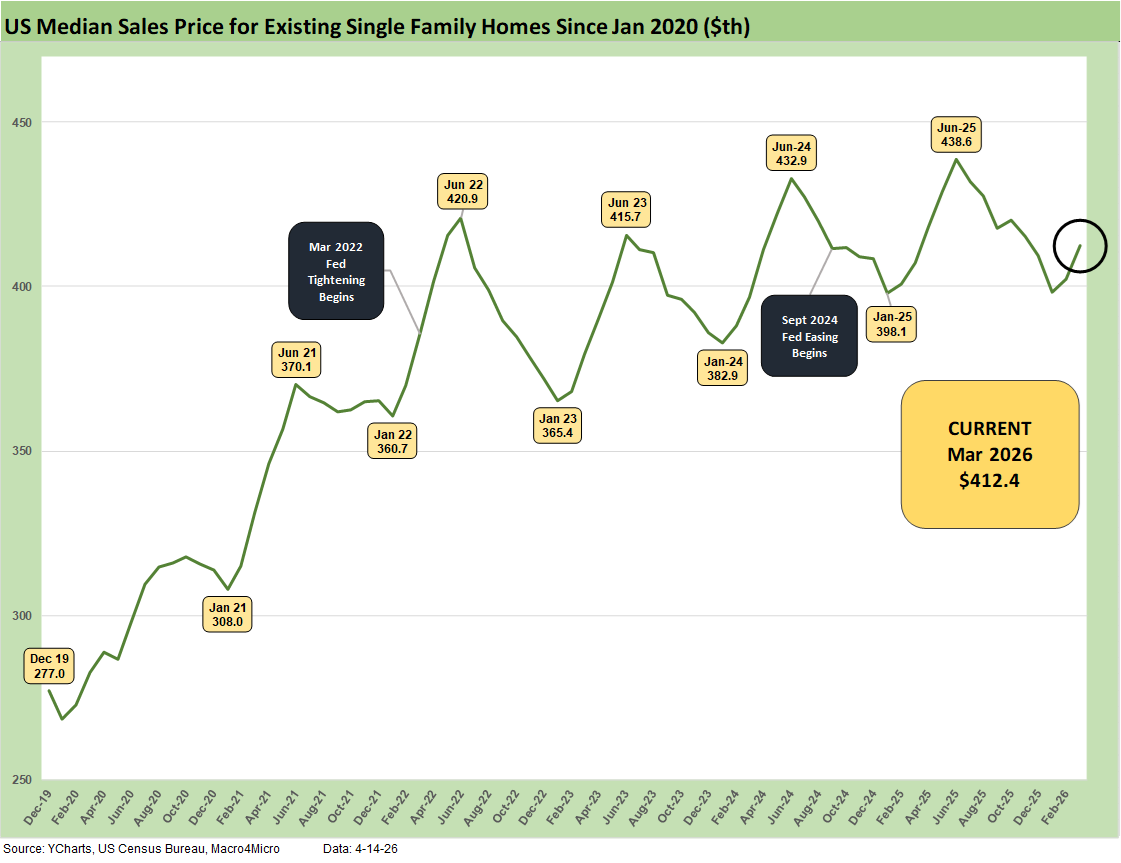
The above chart updates the median price for existing single-family homes at $412.4K after June 2025 hit a record $438.6K. The median price in March 2026 is dramatically above the $308K level back in Jan 2021 and $277K in Dec 2019 when mortgage rates were in a different zip code and closer to 3.7% for 30Y Freddie Mac.
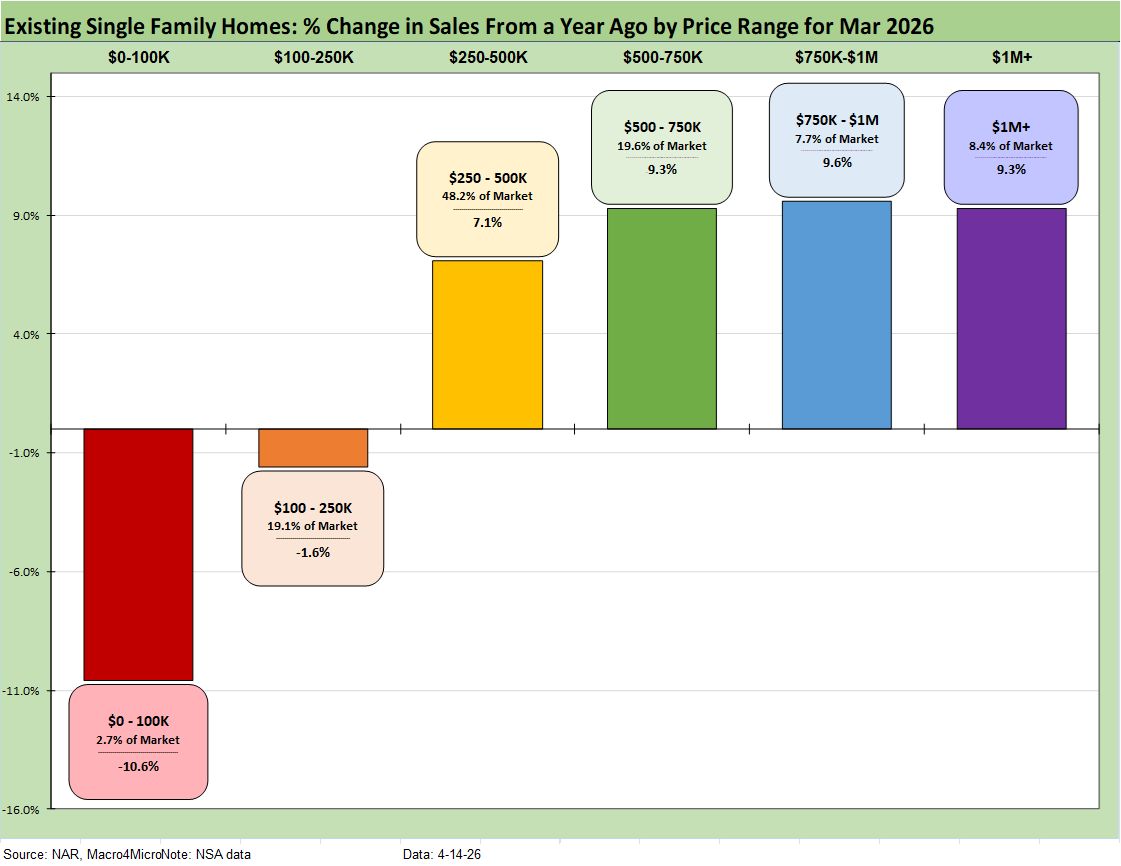
The above chart shows another angle on the sales mix across the price tiers. We just lift the numbers off the monthly handout for single family homes released by the NAR each month. The NAR totals add up to over 100% but the message is clear enough. Higher price homes and wealthier buyers have had a better time.
The $250K to $750K range as two tiers add up to almost 2/3 of the market with the $100K to $250K showing a big share in some of the Midwest states as detailed in an earlier chart. We also looked at the growth trends for each tier earlier. Lower price tiers declined while the top 4 tiers rose. The lower price tiers are more on the cusp of where affordability and mortgage eligibility could be strained at 6% handle mortgage rates.
See also:
Producer Price Index March 2026: Heater or Curve Ball? 4-14-26
Market Commentary: Asset Returns 4-12-26
CPI March 2026: The CPI Cycle Could Prove Maddening 4-12-26
4Q25 GDP: More Adverse Revisions in the Golden Year 4-9-26
The US as an Aspiring Emerging Market: Fiscal SNAFU, Political FUBAR 4-6-26
Employment Situation March 2026 4-4-26
Payroll Focus: ADP Highlights March 2026 4-1-26
JOLTS Feb 2026: Openings Down, Hires Down, Layoffs Up 3-31-26
Market Commentary: Asset Returns 3-30-26
UST Deltas: Elevation Realities 3-29-26
Market Commentary: Asset Returns 3-23-26
Market Lookback: Confusion Reigns, Dislocation Pours 3-22-26
New Homes Sales Jan 2026: The Nays Carry 3-19-26
Industrial Production Feb 2026: Capacity Utilization 3-16-26
Market Lookback: The Gulf of Cause and Effect 3-15-26
Housing Starts Jan 2026: Total Starts Up, Completions Up, Permits Down 3-12-26