
1Q26 GDP Advance Estimate: Consumer Fade, Investment Boom
The moving parts of 1Q26 show weakness in PCE growth but a spike in Equipment and IP Products.


Bears are under fire in this stock market.
The 1Q26 headline GDP growth marks a sequential strengthening from a very weak 4Q25, but the stark divergence across growth in PCE vs. Fixed Investment reminds us that there is a lot going on in the mix from the household level to corporate investment budgets and what is underway in tech sector evolution (see 4Q25 GDP: More Adverse Revisions in the Golden Year 4-9-26).
Personal Consumption Expenditures (PCE) posted growth of 1.6% for 1Q26, down from 1.9% in 4Q25 and the lowest since 0.6% in 1Q25. PCE growth in 1Q26 is lower than all 4 quarters of 2024 (Biden’s last year in office). That is what the objective numbers say. Subjective storytellers have other versions.
The real GDP growth movers were over in the fixed investment bucket where tech outlays carried the day. The line items notably diverged with total Nonresidential fixed investment at +10.6% on the back of the Equipment line at +17.2% and Intellectual Property Products at +13.0%. In contrast, we see Structures at -6.7% under the fixed investment line. Residential investment weighed in at -8.0%. The contribution to GDP (Table 2) from “Information and Processing Equipment” was 0.83% and dwarfs other equipment categories. Tech rules capex trends.
The GDP report includes details of a 4.5% PCE price index for 1Q26 vs. 2.9% in 4Q25. The core PCE price index stood at +4.3% in 1Q26 vs. 2.7% in 4Q25. The March monthly PCE price index data was also released this morning with some fairly ugly numbers. The 3.5% YoY for March was up from 2.8% in Feb 2026 while Core PCE YoY of 3.2% was up from 3.0% in Feb 2026. That is the wrong direction for easing. Goods PCE rose by 3.8% in March vs. 1.8% in Feb. The +14.4% YoY for PCE prices in Energy Goods and Services is a number with more lag effects to come.
The reality of sharply higher inflation across multiple line items brings the potential for an ongoing squeeze on real wages and more threats to an already soft PCE line in the GDP accounts. The Iran War (“excursion”?!) thus could further undermine the latitude for FOMC easing even if Warsh can play with the data and squeeze out enough outlying data points to make his inevitable advocacy for easing somewhat stronger. Perhaps the consumer will instead “trim the mean” on their household baskets, change diets, switch brands, and drive/travel less.
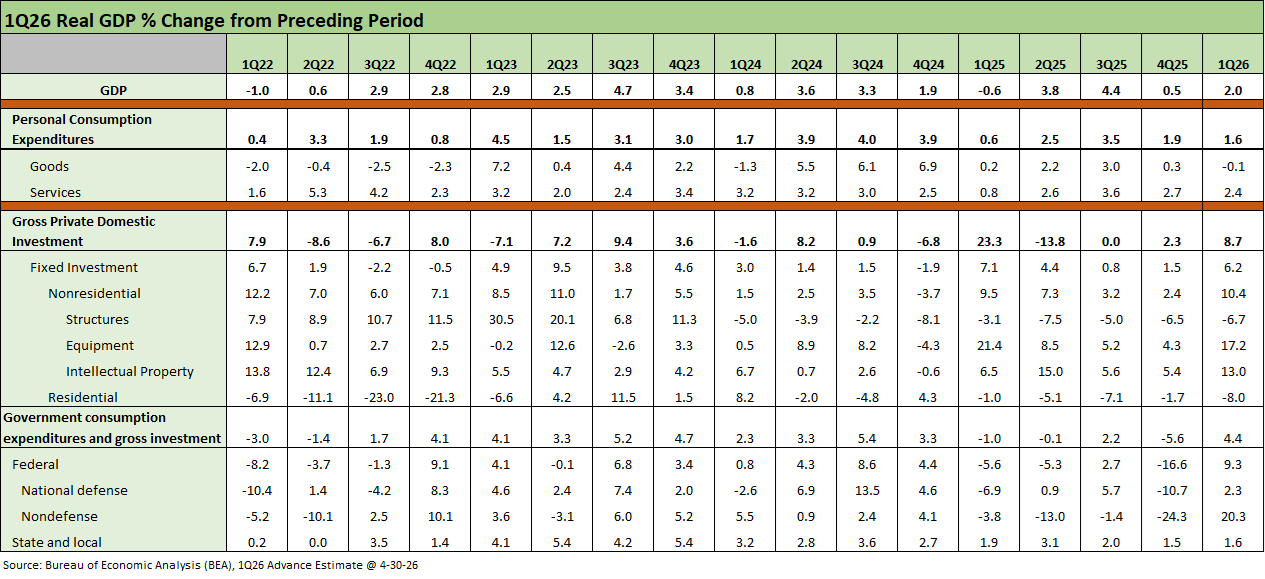
The chart above updates the key drivers of GDP with Personal Consumption Expenditures (PCE) always the dominant factor at around 68% of GDP. The Gross Private Domestic Investment categories account for almost 18% of nominal GDP and posted a very strong quarter. That is where the tech boom is playing out under Equipment and Intellectual Property. The dramatic swing in the Federal GDP contribution (from -16.6% in 4Q25 to +9.3% in 1Q26) tend to get discounted and segregated from the core economic story. The big move in government lines was the swing in the Nondefense Federal line from -24.3% in 4Q25 to +20.3% in 1Q26.
Coming off the +0.5% 4Q25 GDP and annual GDP growth rate of 2.1% for 2025, there is little to brag about in the GDP story until this Fixed Investment pop in 1Q26. PCE and Fixed Investment is the main story and not trade deficit deltas or working capital distortions (see 4Q25 GDP (Advance Est.): Less Distortion This Time 2-20-26, 3Q25 GDP: Morning After Variables to Ponder 12-27-25).
The annual GDP growth of 2.1% in 2025 was well below the 2024 growth rate of +2.8% (see 4Q25 GDP: More Adverse Revisions in the Golden Year 4-9-26) and no amount of “grinning and spinning” by Hassett et al. can make 2025 a good growth year. We now see the 1Q26 numbers getting better in fixed investment.
The multiplier effects of the impressive tech capex cycle show up in higher imports and exports both. We also see the major industrials getting some lift from the capex programs as underscored by Caterpillar’s stock response today as CAT rose by almost 10% with robust earnings and guidance. Both the “Construction” and “Power and Energy” segments showed impressive growth. CAT also reduced its tariff cost estimates (for now).
The PCE wildcard and the inflation X factor…
The numbers in the box above tell a story of weaker growth rates in historical context. A scan of the PCE price index in the 1Q26 GDP report was bad news, so the FOMC role as a potential tailwind (or not) is still up in the air with the oil scare. We saw mortgages briefly hit 6.5% yesterday, so the housing story and cost of durables financing by customers is a developing story with the Iran War fallout.
The 4% handle numbers for PCE inflation reported for 1Q26 might leave Warsh in need of a good qualitative sales pitch since the numbers are not helping the FOMC easing themes (no wonder he wants to change the data approach).
The YoY lines by product groups in GDP growth are also sobering with Goods at -0.1%, Durables at 0.0%, and Nondurables at -0.2% (Table 1). Services weighed in at +2.4% growth for 1Q26 in the GDP report. Overall, the PCE line and consumption growth rates rolled up into an unimpressive rate of growth that certainly does not fit under the heading of “Golden Age.” The tech story came through loud and clear on data centers and equipment demand.
Consumers don’t help the sustained expansion story so far…
The Personal Consumption Expenditure (PCE) lines are starting to show the wear and tear of policy chaos. It is hard to lean on a scenario of lower chaos levels ahead even if Iran can get worked out. The hectic headline uncertainty extends from tariffs to geopolitics. In tariffs, we have the USMCA up for review and Trump still does not even admit the buyer/importer writes the check, so what do you do with that? Trump even blasted out “Truth” social commentary along the way that tariff refunds would be going to foreign sellers and other countries.
The tariff topic will heat up again with Canada and Mexico, where the relationships have been rapidly deteriorating. No members of the sycophant legion have dared to explain the basic tariff mechanics to their leader. Or he is simply not telling the truth. Meanwhile, the Iranian nukes that had been “obliterated” (remember how mad Trump would get about anyone who said otherwise) are now the refrain (What is preventing a nuclear weapon worth? As repeated over and over by Hegseth to Congress this week.) Nukes are now the core rationale for the Iran War and the continued blockade.
Trump’s core strategy is based on the idea that a radicalized nation of over 90 million, including many hardened by a brutal Iran-Iraq war int the 1980s, would roll over like Venezuela, where the ancestral allies of Maduro remain at the helm. Extrapolation from Venezuela rolling over to expecting an easy victory in Iran will get written up in the history books for generations to come with a Trump brand stamped on it. Not in a good way.
See also:
Market Commentary: Asset Returns 4-26-26
Synchrony Financial: Favorable Consumer Credit Signals 4-24-26
Market Commentary: Asset Returns 4-19-26
Industrial Production March 2026: Mixed Picture, Big Questions Ahead 4-16-26
Existing Home Sales March 2026: New Beginnings or New Ends? 4-15-26
Producer Price Index March 2026: Heater or Curve Ball? 4-14-26
CPI March 2026: The CPI Cycle Could Prove Maddening 4-12-26
4Q25 GDP: More Adverse Revisions in the Golden Year 4-9-26
The US as an Aspiring Emerging Market: Fiscal SNAFU, Political FUBAR 4-6-26
Employment Situation March 2026 4-4-26
Payroll Focus: ADP Highlights March 2026 4-1-26
JOLTS Feb 2026: Openings Down, Hires Down, Layoffs Up 3-31-26
UST Deltas: Elevation Realities 3-29-26
Market Lookback: Confusion Reigns, Dislocation Pours 3-22-26
New Homes Sales Jan 2026: The Nays Carry 3-19-26
Market Lookback: The Gulf of Cause and Effect 3-15-26
Housing Starts Jan 2026: Total Starts Up, Completions Up, Permits Down 3-12-26