
Producer Price Index March 2026: Heater or Curve Ball?
Energy and Goods both showed material PPI increases as we wade into blockade uncertainty and more tariff pricing decisions.


Wild Thing, I think you move me, but I wanna know for sure!
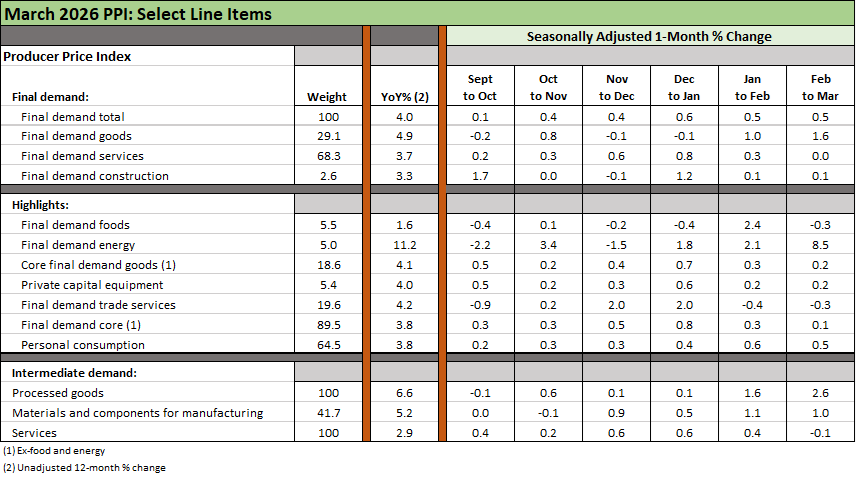
The PPI index showed material increases with Goods and Energy driving the move but with Services muted. The YoY move of +4.0% for headline final demand was up notably from 3.4% in Feb 2026. We see “PPI final demand goods” at +4.9% in March, up from +2.5% YoY in Feb, so there is plenty going on under the final demand stats.
Calling anything a leading indicator these days is tricky with so much event risk and behavioral uncertainty, but the PPI reflects negative trends on the energy and goods side and measure increases in services.
The “Final demand energy” line hit 11.2% in March, up from -0.7% in Feb as a sequential MoM move in March of +8.5% rang the bell. There are numerous energy lines detailed in the report, and the pressure from the Iran War is no surprise, Energy related effects without question an unpredictable broad bucket on the question of “How bad can it get and for how long?”
The headline PPI MoM level of +0.5% drops to +0.1% ex-Food and Energy. That cannot ignore the reality of the all-time low of consumer sentiment that is very much influenced by food and energy.
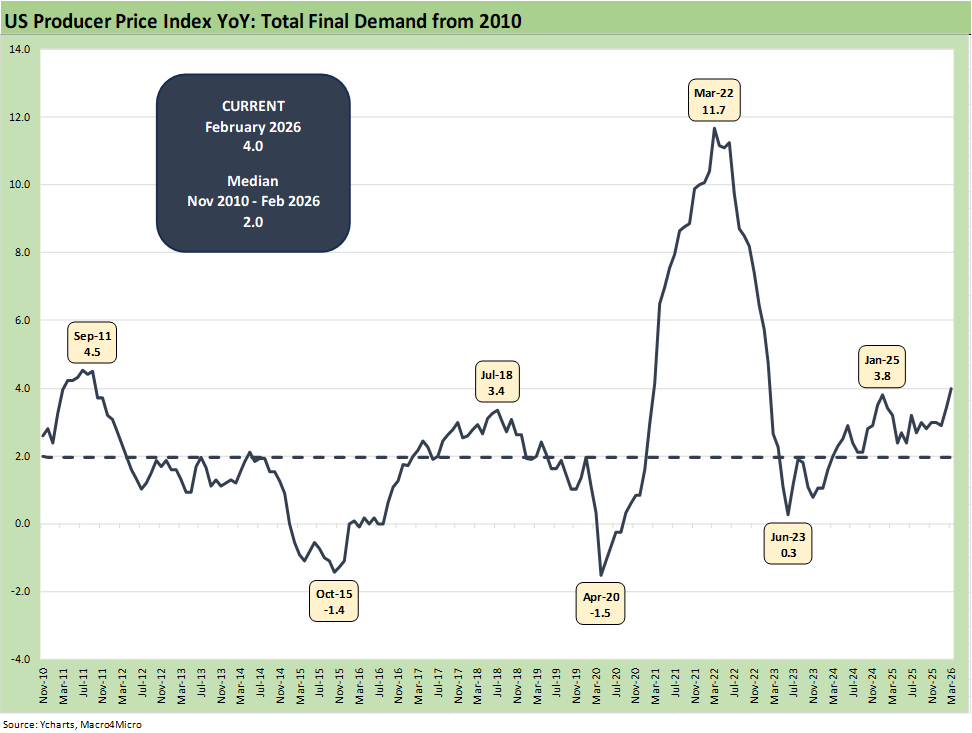
The PPI Final Demand time series is broken out above. The trend shows the sustained rise continuing this month as goods and energy line items keeps the pressure on. We see the low of +0.3% in mid-2023 after the supply and demand crash of April 2020 at -1.5%.
Negative PPI at the COVID peak later saw a demand rebound drive a massive PPI response on the supply-demand imbalances teamed up with extensive relief and stimulus programs with ZIRP added on top of that. The impact of the Russian invasion of Ukraine driving energy higher from the COVID crash seldom gets mentioned by Team Trump (too busy blaming Trump and Powell and they do not want to upset Putin).
That +11.2% in March 2022 came with the start of the tightening cycle as PPI went on its journey to 3.3% by the end of Dec 2024. The current 4.0% in March 2026 is above the 3.3% PPI posted in Dec 2024 (Biden’s last full month in office).
The above table includes a subset of the recent trends on the main PPI lines we choose to focus on for signals. There is certainly no shortage of lines in the PPI release (numerous pages and many lines across Table 1 and Table 2) under various final demand and intermediate goods and services categories for YoY and MoM moves. We covered some of the main groups in the chart, but a scan of the columns in the release looking for outliers is always a good drill. We include some categories that carry lower weightings that are of interest in terms of what they reflect.
PPI data always has a lot to review across the “cost ingredients” as leading indicators to how goods producers might need to consider pricing actions or might experience margin compression. Print out table 1 and Table 2 and ponder the 12-month YoY columns. The very wide range is easy to see.
Energy, materials, and goods are showing the cost pressures…
Energy setbacks are no surprise with gasoline posting a 15.7% MoM and +14.0% YoY. Gasoline was posting deflation as recently as Dec and Jan. Diesel is +42% MoM and +51% YoY, so that is going to be flowing into freight and logistics costs including surcharges. On the intermediate side of the chart collection, we see jet fuel at +42.2% YoY and +30.7% MoM. The disruptions of flights and pressure on airline fares has generated more than its share of headlines.
Food costs were very muted this month, and we have a hard time seeing how that does not change on the combination of energy costs and the pressure on fertilizer that has been in the headlines. Among notable food lines was “Fresh and dry vegetables” at +49% YoY (but -10.7% MoM in March) and +20.2% YoY for coffee (-1.6% March). Beef and veal at +19.7% YoY was down to +2.2% MoM.
“Final demand for Nonferrous metals” was +36.7% YoY for a wide range of reasons as discussed in other commentaries along the way. Unprocessed nonferrous metal ores are +75% YoY. Primary nonferrous metals are +67% YoY.
We see the final demand goods line showing the impact of tariffs and other cost pressures with “final demand goods” at +4.9% YoY and a 29.1% weighting. The Feb to March move of +1.6% come after +1.0% MoM for Jan to Feb after being slightly negative in Dec and Jan. We also see the sustained pressure in intermediate demand for “processed goods” in Feb and March at 6.6% YoY.
Services have been kind…
The “final demand services” line at a 68.3% weighting posted 3.7% YoY. That was not as bad as the goods since and that services line comprises a much bigger slice of what is a services economy in the US. Services even ticked down to 0.0% in March vs. positive increases in earlier months and notably MoM in Dec and Jan. If we drop down into “services for intermediate demand” we see only +2.9% YoY with Transportation and Warehousing a notable pressure point with a number of lines in the 7% handle area.
In the end, the PPI was an unfavorable number with a lot of action ahead subject to Iran outcomes and Goods pricing decisions with tariffs still very much a reality.
See also:
Market Commentary: Asset Returns 4-12-26
CPI March 2026: The CPI Cycle Could Prove Maddening 4-12-26
4Q25 GDP: More Adverse Revisions in the Golden Year 4-9-26
The US as an Aspiring Emerging Market: Fiscal SNAFU, Political FUBAR 4-6-26
Employment Situation March 2026 4-4-26
Payroll Focus: ADP Highlights March 2026 4-1-26
JOLTS Feb 2026: Openings Down, Hires Down, Layoffs Up 3-31-26
Market Commentary: Asset Returns 3-30-26
UST Deltas: Elevation Realities 3-29-26
Market Commentary: Asset Returns 3-23-26
Market Lookback: Confusion Reigns, Dislocation Pours 3-22-26
New Homes Sales Jan 2026: The Nays Carry 3-19-26
Producer Price Index Feb 2026: Getting Warmer 3-18-26
Industrial Production Feb 2026: Capacity Utilization 3-16-26
Market Lookback: The Gulf of Cause and Effect 3-15-26
Housing Starts Jan 2026: Total Starts Up, Completions Up, Permits Down 3-12-26
Existing Home Sales Feb 2026 3-10-26
VIX: Market Still Not Getting the Vapors 3-6-26