
4Q25 GDP: More Adverse Revisions in the Golden Year
The final numbers deliver a +0.5% 4Q25 GDP, capping off a weak “Trump golden year” annual GDP of +2.1%, down from Biden’s +2.8% in 2024.


The key to GDP growth alchemy is disinformation, repetition, and a lack of shame.
The final revision for 4Q25 GDP moves the needle to +0.5% from +0.7% in the 2nd estimate and +1.7% in the advance estimate. Weakness in personal consumption expenditures (PCE) was the dominant driver (Reminder: PCE is ~68% of nominal GDP).
The 4Q25 PCE line posted a contribution to 4Q25 GDP of 1.30%, down from the +2.61% of 4Q24. The PCE % change from the preceding period (Table 1.1) posted +1.9% in 4Q25 vs. +3.9% in 4Q24. The 4Q25 period and annual 2025 numbers do not qualify as “golden” or meet Trump’s description of the US as the “hottest” country. The objective numbers are not there.
Fixed investment was weak in 4Q25 at +1.5% vs. the prior period despite all the data center and capex themes. The Structures line was negative at -6.5% with Residential at -1.7%. The Net exports of goods and services line was only -0.22% after all the dramatic swings of earlier quarters as tariffs rolled in and working capital cycles swung around (3Q25 GDP: Morning After Variables to Ponder 12-27-25).
As the “greatest first year in Presidential history” goes, the final annual GDP story of 2025 leaves something to be desired with an annual GDP growth rate of only +2.1%. That +2.1% annual growth rate is lower than all 4 years of Biden (including 2022).
The “truth” social tirade this week revisited the “dead country” theory of what came before Trump. As dead countries go, the 2.8% annual GDP growth rate in 2024 was well above the “golden year” of 2025. The +2.1% annual GDP growth rate is the lowest year since 2020 in Trump 1.0. (see Cyclical Histories: Will Facts Be in Vogue in 2026? 1-2-26). Hassett will have to really up his “perma-grin” game to paint this as a good quarter and a good year. When he plays his game of citing nominal growth (vs. real), he should at least label it as such.
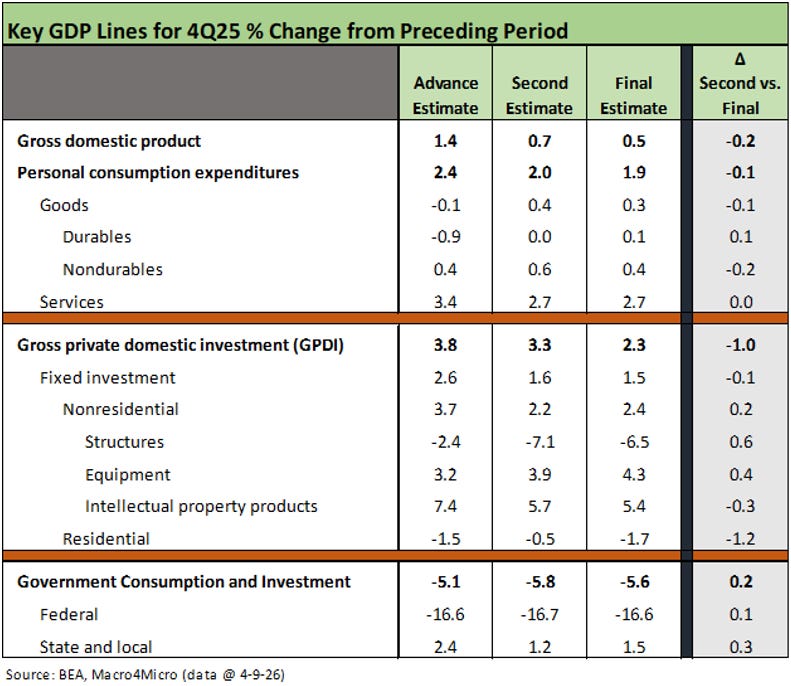
The above chart details the movement along the key GDP lines from the advance estimate on through the financial line items released today in the final cut. We include the latest delta from the second estimate on the right. The +0.5% 4Q25 GDP growth rate was a bad way to end the year that had started with a -0.6% GDP growth rate in 1Q25.
The PCE growth rate in 4Q25 of +1.9% (table 1.1) was the lowest since 1Q25 at +0.6%. Goods consumption was weak at +0.3% in 4Q25 with Durable Goods at only +0.1%. Fixed investment growth was only +1.5%. The best performer in fixed investment was Intellectual Property at +5.4% with Equipment at +4.3%. The setbacks in Fixed investment growth includes Structures at -6.5% and Residential at -1.7%.
Exports posted negative growth at -3.2% with imports at -1.0%. Government weighed in at -5.6% with Federal at -16.6% and the larger State and Local line at +1.5%.
Thinking in calendar year annual terms and the “contribution to GDP” schedule, we see lower contributions to annual GDP from PCE at 1.78% in 2025 vs. 2.0% in 2024. Gross private domestic investment (GPDI) is lower on the annual 2025 GDP line at +0.35% vs. +0.54% in 2024.
For the Government consumption and investment lines, the total is lower at the headline level with -5.6% in a mix that is lower at both the Federal and State and Local level in calendar 2025 vs. 2024. It is notable that both Government Consumption as well as Gross Investment are down at the State and Local level for calendar 2025. That is not just a “Federal cuts” story.
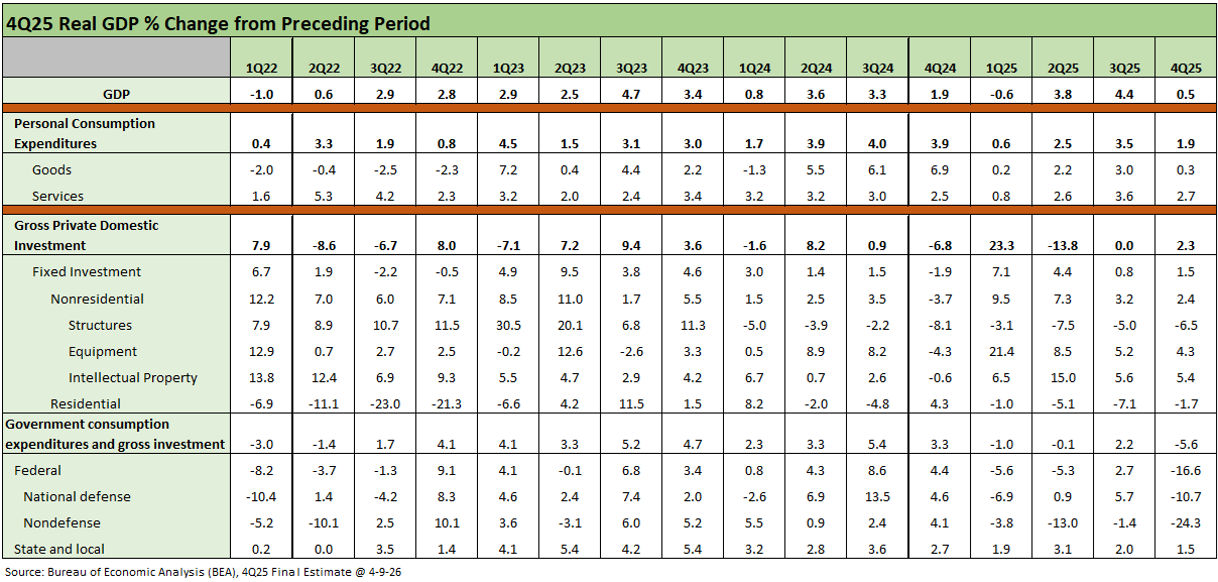
The above table updates the running GDP growth lines from 1Q22, which marked the rough ride from an unusually strong post-COVID rebound in 2021 that fed into an inflation spike and tightening cycle. The 2H22 period showed the resilience from low unemployment and a relatively steady consumer sector. The setbacks in 2022 were only made worse by the late-Feb 2022 Russian invasion of Ukraine and the energy market dislocations. The 2022 staying power against inflation is a reassuring data point in the face of the current Iran mess.
Despite that disarray in 2022, the calendar year saw an annual GDP growth rate of 2.5%, which is more than we just printed to 2025. The ability of the US economy to get through an ugly year like 2022 offers a reminder of how much needs to go wrong to drive a recession in such a well-diversified, services-intensive economy as the US.
The line items in the table start in a troubled 1Q22 and ends in 4Q25 with the +0.5% growth rate. We get the 1Q26 advance estimate at the end of this month that will include 1 month of the post-Iran chaos. We get the updated PCE inflation and Personal Income and Outlays data for March at the end of this month also.
See also:
GDP 4Q25 Second Estimate: Sharp Move Lower 3-13-26
4Q25 GDP (Advance Est.): Less Distortion This Time 2-20-26
3Q25 GDP: Updated Estimate 1-22-26
Cyclical Histories: Will Facts Be in Vogue in 2026? 1-2-26
3Q25 GDP: Morning After Variables to Ponder 12-27-25
2Q25 GDP Final Estimate: Big Upward Revision 9-25-25
1Q25 GDP: Final Estimate, Consumer Fade 6-26-25
1Q25 GDP Advance Estimate: Roll Your Own Distortions 4-30-25
Trump’s “Greatest Economy in History”: Not Even Close 3-5-25
Gut Checking Trump GDP Record 3-5-25