
UST Deltas: Elevation Realities
We look at UST deltas, mortgage setbacks, the swing in duration risk, and daunting Iran scenarios risks ahead.


Higher tariffs, energy costs, and UST supply are not all that magical.
The combination of Iran side effects and lingering tariff uncertainties is the enemy of duration given the UST trends, but the scenarios also bring materially negative fundamental factors into play at the industry and company level on a global scale.
The impact on mortgages has been damaging with Friday closing at 6.64% for 30Y mortgages. The shifting FOMC odds now point at hikes in 2026, so we can expect a lot of noise from the White House during a Fed transition period that is not even set yet with the DOJ think tank playing games on Powell and some Senate types not happy.
Lurking in the background is the USMCA review that will come at a crucial time when Trump sees worsening relations with all major trade partners around support for his chosen geopolitical game plan. China has much to worry about in the Middle East.
The commentary below builds off a recent LinkedIn post of ours.
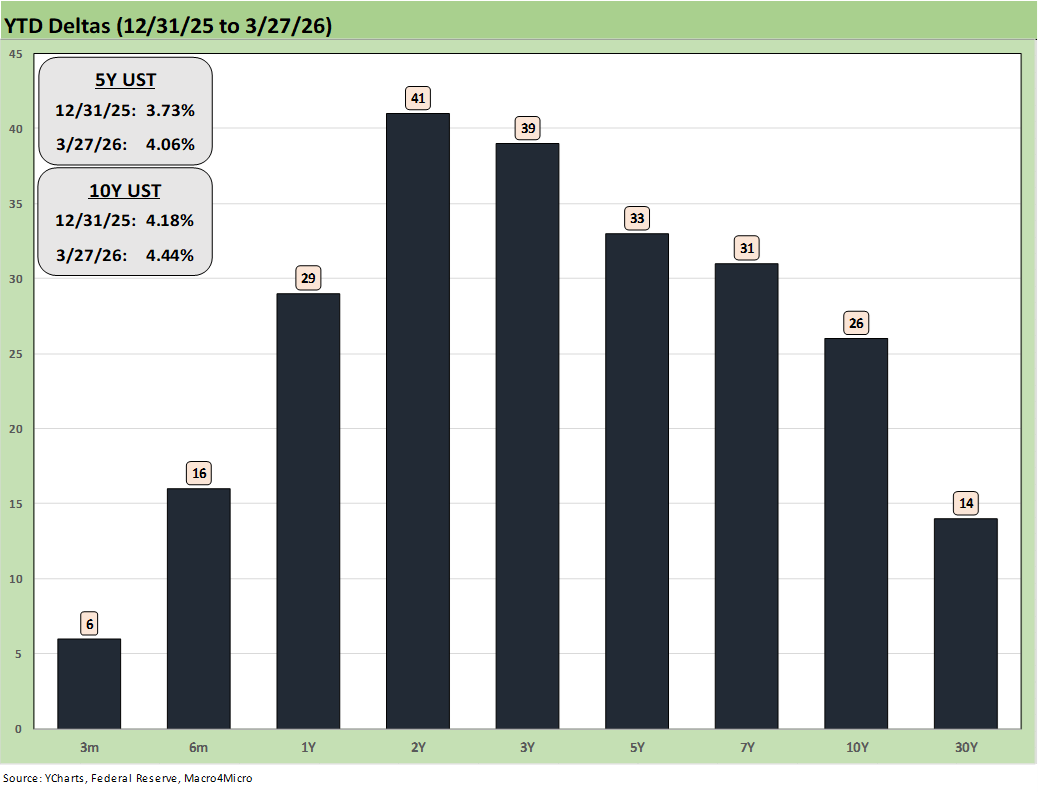
The chart updates the YTD UST curve deltas as the market wrestles with inflation anxiety around Iran fallout and gauges how badly the odds of FOMC easing have been damaged. We now see FedWatch showing a higher chance of hikes in 2026 than cuts.
The more intensive the media coverage of the Strait of Hormuz, the more markets hear about the full scale of the supplier chain impacts that go well beyond oil and LNG and spill into a wide range of downstream production supply risks and unit cost pressures.
We have the Houthis in the picture now getting warmed up as well as yet another oil volume threat given the importance of the Red Sea shipping routes and the Bab-el-Mandeb Strait. Oil is the main focal point, but any escalation into the Red Sea would also flow into broader shipping and freight costs overall.
The relationship of cost pressure to pricing is a natural one as the market knew even if the White House was still learning (maybe). Even if the monetary purists will not call it “inflation” and take the “transitory” or “one time” interpretation, more Iran fallout would lead to even more erosion of affordability for the “household basket.”
The threats from Iran fallout cut across the full spectrum from high value-added to commodity-like products. We hear about market setbacks from semiconductors to fertilizers, organic and inorganic chemicals, pharma ingredients, and metals (notably aluminum) among others. Handicapping that into inflation targets from PPI to CPI across regions and subsectors is no small challenge for the burdened planners and economists.
The significance of low-cost power (notably electricity) in the Gulf covers a lot more than just fertilizer/metals. Even data centers are on the alert to risks of escalation and scenarios of more missiles and drones flying (and perhaps boots on the ground). The immediate speculation is around which military actions will amp up (82nd Airborne drops, Marine landings, bombing escalation of energy assets and power plants, island seizures, etc.). The decisions could bring an exponential increase in secondary and tertiary multiplier effects. Extreme escalation could even pull in Iraq into more action given the heavy Shiite mix in its country and armed forces.
There are also the inherent knock-on effects of rising costs across the supply chain for materials and components as costs need to be eaten or passed on. That means Asia and Europe where exports to the US could have a price impact. At least the dollar is recovering, but that comes with higher rates and higher costs for nondollar economies to buy dollar-based energy and food (notably ag commodities).
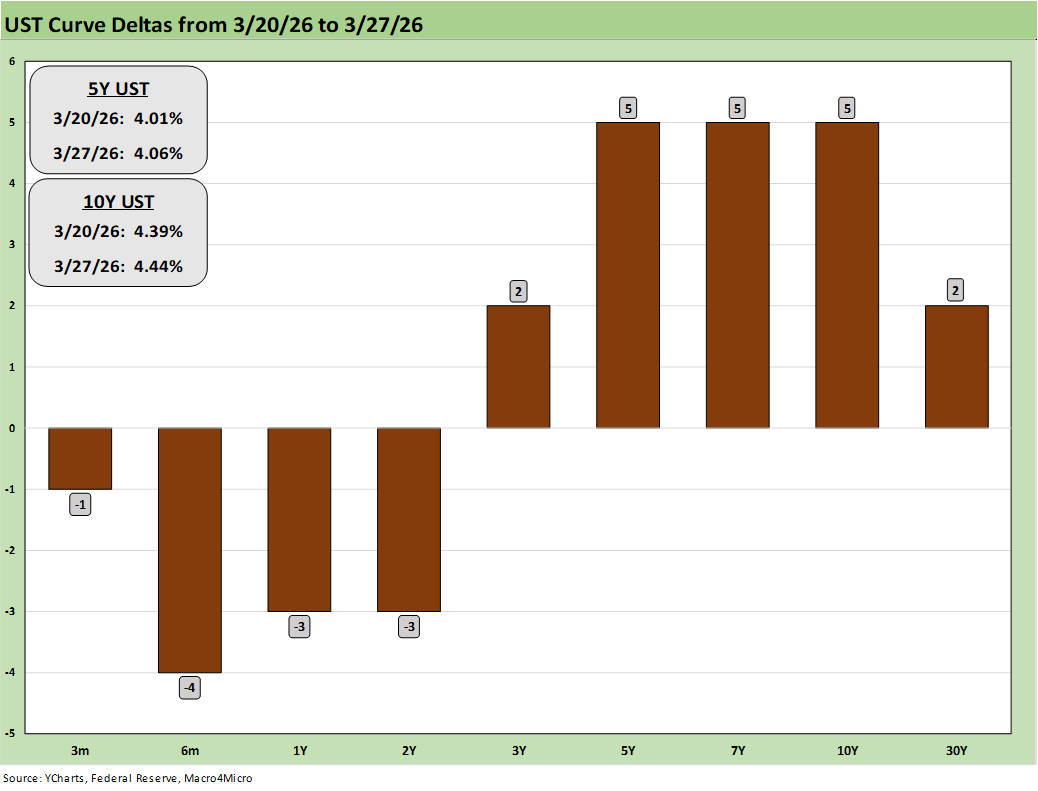
The above chart breaks out just the past week’s UST deltas. The front end got a little relief.
The “FOMC Vegas Line” says hikes more likely than cuts….
The shifting odds in monetary policy are something you cannot blame on Powell. There are 19 bodies in the dot plot with 12 FOMC votes (not the 7 Board of Governors). Trump’s foreign policy actions are driving the bus, and the Fed will need to react under its dual mandate (price stability, full employment). We will get a slew of employment data this week including JOLTs, ADP, and the payroll data on Good Friday. The Iran wildcard shifted the weight back toward price stability from payroll unless the jobs data says otherwise.
The impact on the UST curve as shown in the chart is in flux. We already have seen material, stark revisions of FOMC handicapping and mortgages are climbing. The Mortgage News Daily (“MND”) and Freddie Mac 30Y numbers are on the rise with MND posting 6.64% Friday close. Freddie Mac 30Y was set Thursday afternoon at 6.38%, which is up from 6.22% last week and down from 6.65% last year at this time.
In terms of the “Vegas line” on FOMC (i.e., CME FedWatch), we can look to the Oct 2026 FOMC meeting as a guide. As we go to print, we see 74.5% odds of fed funds unchanged, 23.0% odds of 1 hike, 2.4% odds of 2 hikes, and the odds of 1 cut at a cool 0.0%. As of 1 month ago, the odds of 2 cuts by Oct 2026 was over 35%. That has been a very dramatic swing in the handicapping with a lot still to play out.
You can link to the FedWatch site and go meeting-by-meeting for shifting odds. The odds of a fed funds hike rise gradually into June (7.7%), July (9.5%), Sept (20.4%) and then Oct (23.0%). That was from Sunday morning post time.
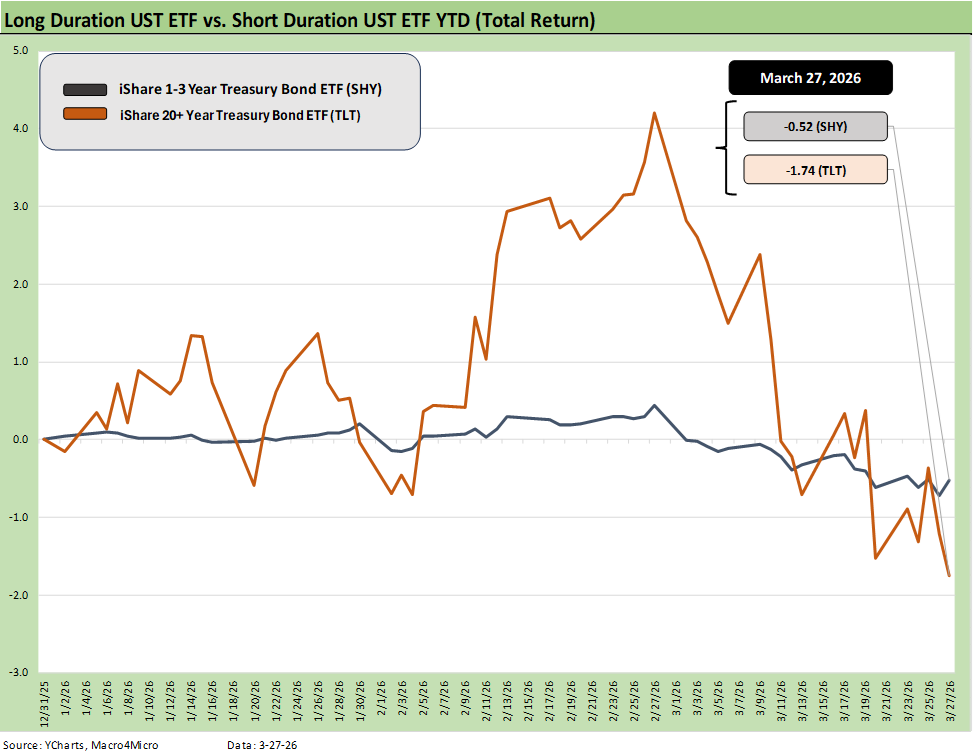
The above chart is a simple YTD price performance chart of the short duration 1Y to 3Y ETF (SHY) vs. the long duration UST 20+Y ETF (TLT). It is a low ambition chart that breaks out how the bond ETF curve risks played out so far in 2026. We see both in negative territory YTD in price returns. Duration took a hit on the curve shift YTD.
For the TLT, the 1-month return as of Friday was -5.6% across a timeline when many were still talking about FOMC easing. As evident in the time series, TLT was shaping up as a winner into February and then reversed course with Iran and is now back in negative range. We covered those shifting odds on “cuts vs. hikes” in the prior chart. SHY for the 1-month was a slight negative at -0.68%.
The above swings unfolded during a period where we still heard Powell blamed by Trump for everything and Trump’s own policies blamed for nothing. That is his right to indulge, but the 19 (12 + 7) dots in the dot plot are more than one economist with opinions. They know as a fact the “buyer writes the check” for the tariff (Trump still says the seller and selling country pays. That is false.). The fact that Trump sticks to that version of “facts” on tariffs is alarming. Pride – whether admission of error or just being wrong – dictates reality. Export that mentality to “war decisions,” and that offers troubling signals.
If an asset allocation strategy is pondering the basic, high level asset allocation decision of equities vs. bonds, the last 60 days tell a story that life just got more complicated. Over the past month, the UST curve took a decided turn for the worse as detailed above. That backdrop faces considerable uncertainty in the Iran War and related reverberating effects that hit many different subsectors in the US as well as bringing severe global impact (see Market Lookback: Confusion Reigns, Dislocation Pours 3-22-26).
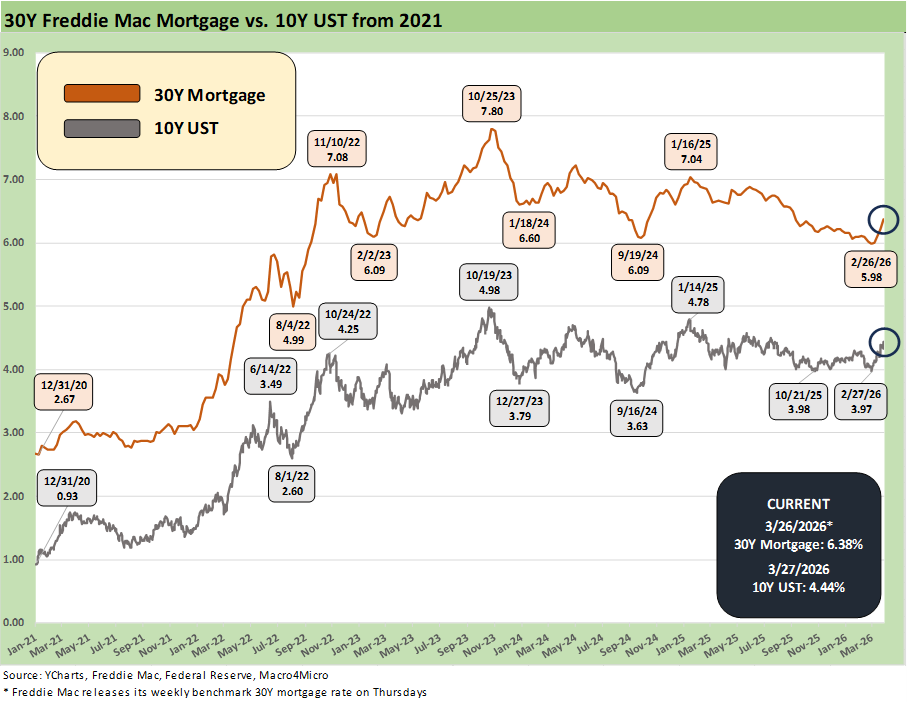
The above chart updates the running 10Y UST vs. the Freddie Mac 30Y mortgage (Freddie is set on Thursday). We see the 5.98% recent low for 30Y ahead of the invasion. The 10Y UST drives 30Y mortgage rates and it has been going in the wrong direction.
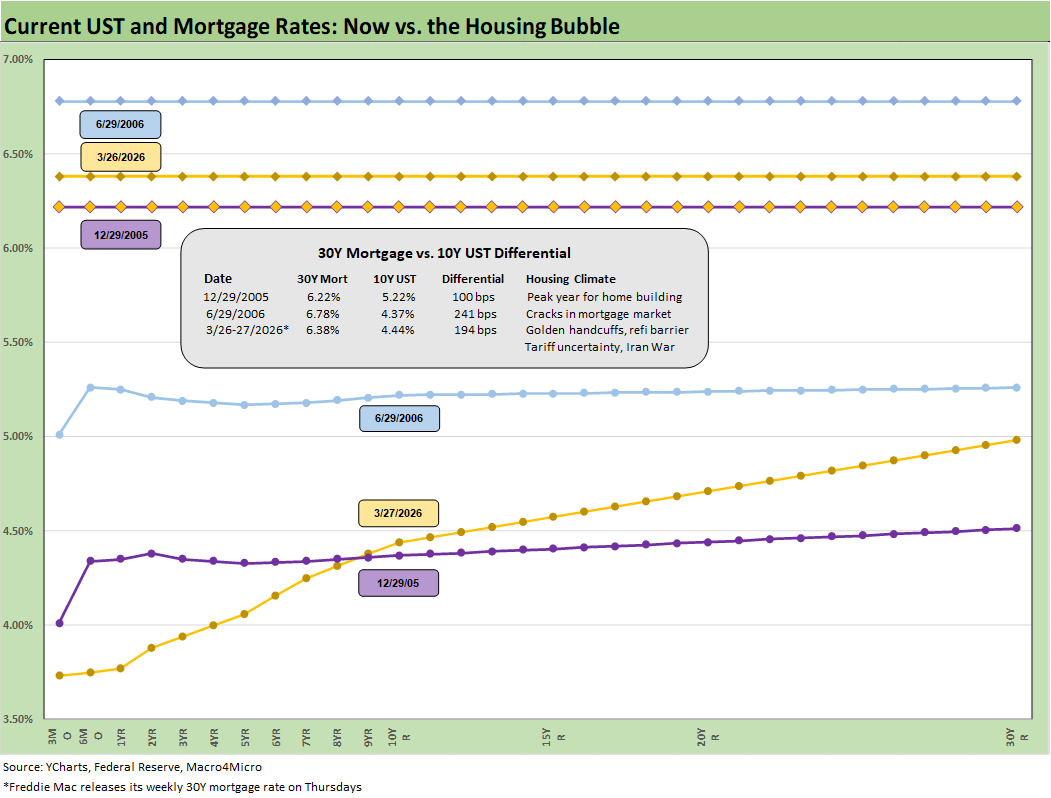
The above chart updates some notable points in history for 30Y mortgages and the UST yield curve. The dates include Friday’s numbers and the yield curve and mortgage rates at the end of the peak homebuilding year of 2005. We also include mid-2006 as the quality erosion in RMBS (notably subprime) was starting to rattle some corners of the market.
That mid-2006 period was before more serious problems in 2007, when hedge funds started blowing up and mortgage banks were seeing the crisis unfold in the summer of 2007 (e.g., Countrywide was soon rescued by BofA) on the way to the systemic bank crisis of 2008.
We highlight that current mortgage rates just moved ahead of 2005 with the next stop potentially at the mid-2006 levels. Things did not go well for housing after that. We also highlight the flat yield curves of late 2005 and mid-2006 and how that contrasts with the upward slope of the UST we see today. Some FOMC tightening in 2026 or some upwards shifting by the UST curve would raise a lot of bearish lookback commentaries.
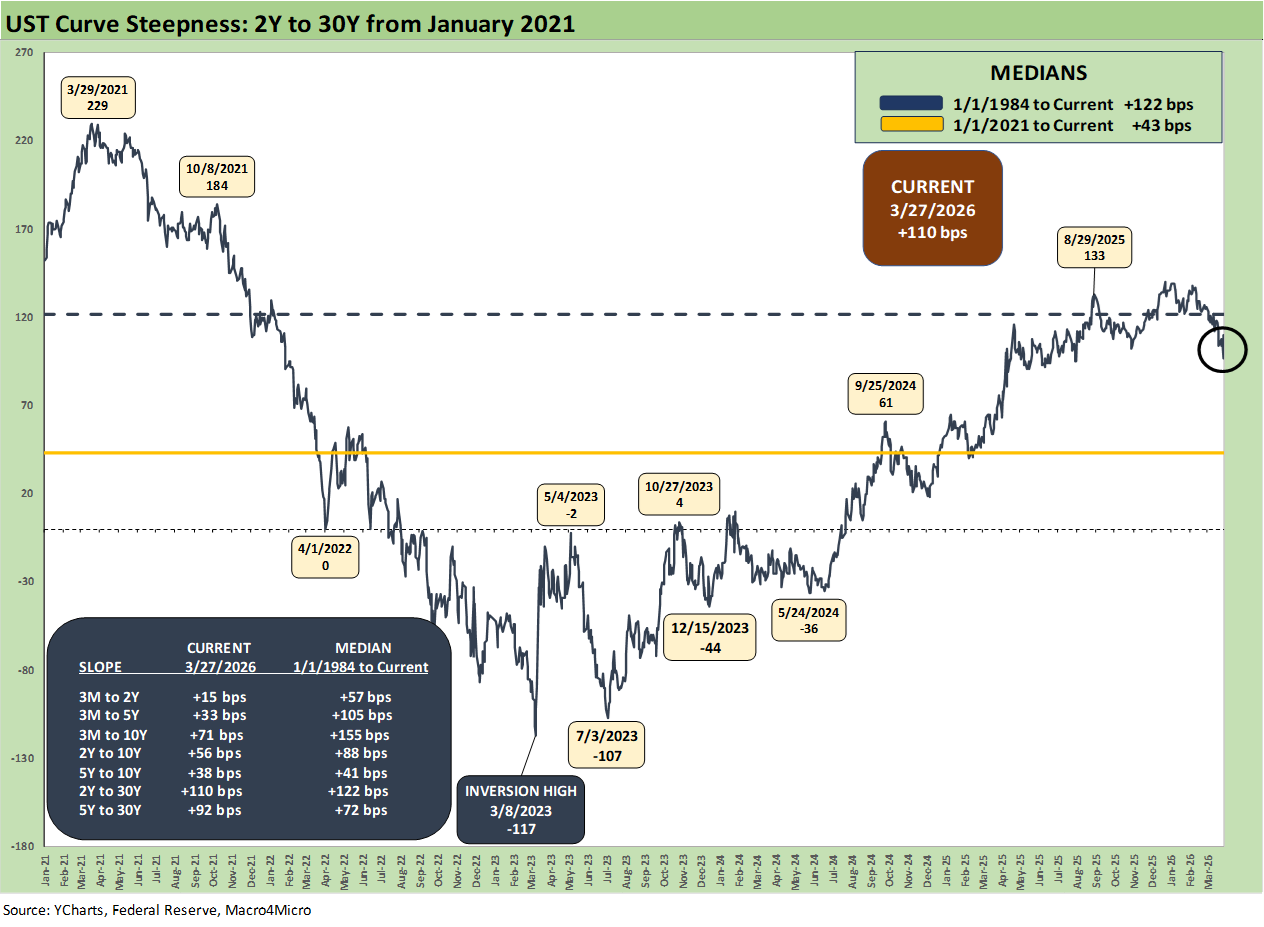
The above chart updates the 2Y to 30Y slope using the shorter time horizon while the chart below details the long-term time horizon from 1984. We see the curve slope effects of rising inflation and then into a tightening/easing cycle with the recent 2Y to 30Y at +110 bps, which is only modestly below the long-term median of +122 bps.
The period from early 2021 to current times was very distinctive on the journey from ZIRP and then across the most intensive inflation cycle since the early 1980s. The 2022/23 period saw a relatively brief but very successful tightening cycle that triggered no recession. By the end of 2024, CPI was back straddling the 3.0% line at 2.9% in Dec 2024 (see CPI Feb 2026: It’s Making You Wait… 3-11-26). Trump likes to pretend his term started in Jan 2025 at 9.1% inflation.
During 2022, the economy pushed right through the worst of it with low unemployment and higher rates of personal consumption expenditure (PCE) growth (see Unemployment, Recessions, and the Potter Stewart Rule 10-7-22). Financial assets (debt and equity) were slammed in 2022 by the tightening cycle and market worries but came storming back in 2023-2025 (see Total Return Quilt Across Asset Classes 2008-2025 1-2-26).
The challenge now has more fundamental factors at work that are hitting economies hard globally with the worst of the lag effects ahead.
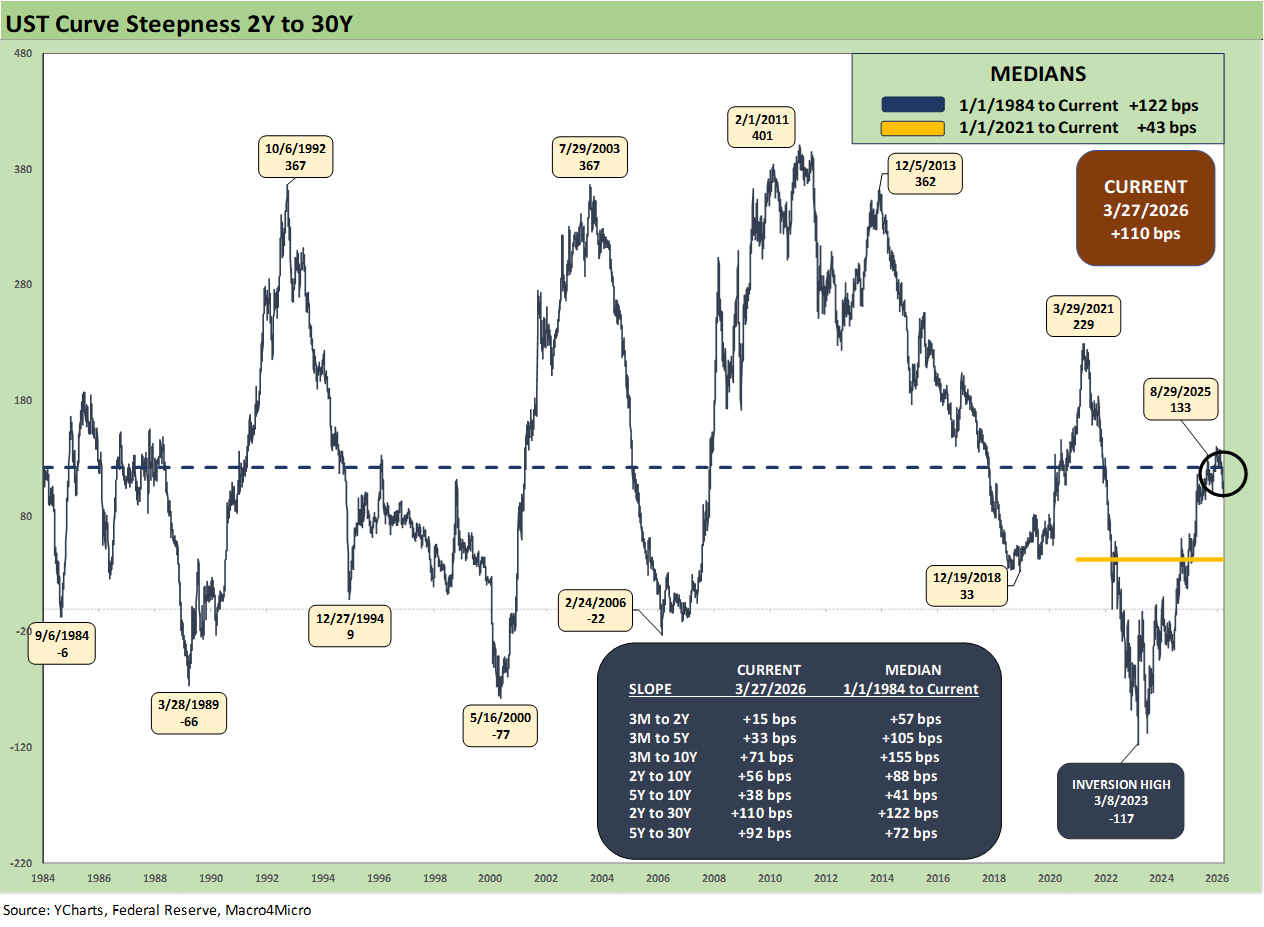
The journey across the cycles – economic or monetary – shows a wild ride with the 2Y to 30Y slope posting material moves for bond asset allocation in the “duration vs. credit” decision.
A stagflation scenario makes the allocation process especially difficult. That will be the challenging exercise in allocation decision-making ahead. We have not faced this type of decision since the period when the modern capital markets and corporate bonds were just getting launched in debt markets (early 1980s).
The severity of the “Iran trap” and very unstable and dysfunctional US political backdrop will be brutal to navigate. Even getting Warsh nominated is being held back by the brain trust at the DOJ investigating Powell in a politically motivated intimidation action. The leadership of the FOMC is thus under a cloud for a while.
See also:
Market Commentary: Asset Returns 3-23-26
Market Lookback: Confusion Reigns, Dislocation Pours 3-22-26
New Homes Sales Jan 2026: The Nays Carry 3-19-26
Producer Price Index Feb 2026: Getting Warmer 3-18-26
Industrial Production Feb 2026: Capacity Utilization 3-16-26
Market Lookback: The Gulf of Cause and Effect 3-15-26
PCE Inflation Jan 2026: Personal Income & Outlays 3-13-26
GDP 4Q25 Second Estimate: Sharp Move Lower 3-13-26
Housing Starts Jan 2026: Total Starts Up, Completions Up, Permits Down 3-12-26
CPI Feb 2026: It’s Making You Wait… 3-12-26
Existing Home Sales Feb 2026 3-10-26
Payrolls Feb 2026: Into the Weeds 3-8-26
Employment Situation Feb 2026: Payrolls Get Ugly 3-8-26
VIX: Market Still Not Getting the Vapors 3-6-26