
CPI March 2026: The CPI Cycle Could Prove Maddening
Moderating MoM metrics do not reduce the rising 2026 price and cost uncertainty as Iran effects and tariff pricing strategies unfold.

The fate of the energy sector and flow-through impacts across a wide range of markets are still a moving target. Meanwhile, uncertain goods pricing strategies in 2026 to deal with tariffs also keep the range of CPI scenarios a major challenge for budgeting decisions and economists finding confidence in the underlying variables. The CPI whipsaw in energy and the clear threat to food inflation from rising costs of fertilizer, oil, labor shortages and freight and logistics does not leave room for complacency even if the market yawned at the March 2026 CPI release.
Our favorite special aggregate CPI index is “All items less shelter” (Table 3 of the release) and it has now moved from reassuring to uncomfortably high at +3.4% YoY in March 2026. As we detail below, that 3.4% for CPI ex-Shelter is up by over a point this month from 2.1% in Feb. Within that special CPI aggregate index bucket, we see “All items less food and shelter” at 3.6% and “All items less medical care” at 3.3%. That is not a pretty picture even if subject to where the Iran war crisis evolves.
Our favorite example of a useless BLS CPI metric is now “health insurance” (0.9% weighting in CPI index). Headlines and the “real world” household experience of insurance premium spikes and a sharp erosion of coverage economics has somehow translated into YoY health insurance deflation of -5.3%. Meanwhile, the MoM CPI metric posted health care MoM deflation in Jan, Feb, and March 2026. That is a neat trick and might come as a surprise to those paying health insurance premiums. The 6.4% CPI YoY for “Hospital and related services” is not helping the medical services story line with “Home health care” at +7.6% and with “Nursing homes and adult day services” at 5.2%. That is tough CPI given current demographics.
Energy (6.4% weighting in the CPI index) spiked to +12.5% and naturally captured the headlines in March CPI with Energy Commodities at +19.4% (including Gasoline at 18.9% and 2.9% of the CPI index). Electricity inflation remains a problem separate from the latest Iran issues at 4.6%YoY CPI (2.5% of CPI index) and Utility Piped Gas at +6.4% (0.8% of CPI index). The commodities piece of CPI is tied into global trends from upstream oil and gas to refined products (including diesel, jet fuel, and marine fuel). The market is one sudden escalation away from supply and cost issues worsening (e.g., Houthis and the Red Sea).
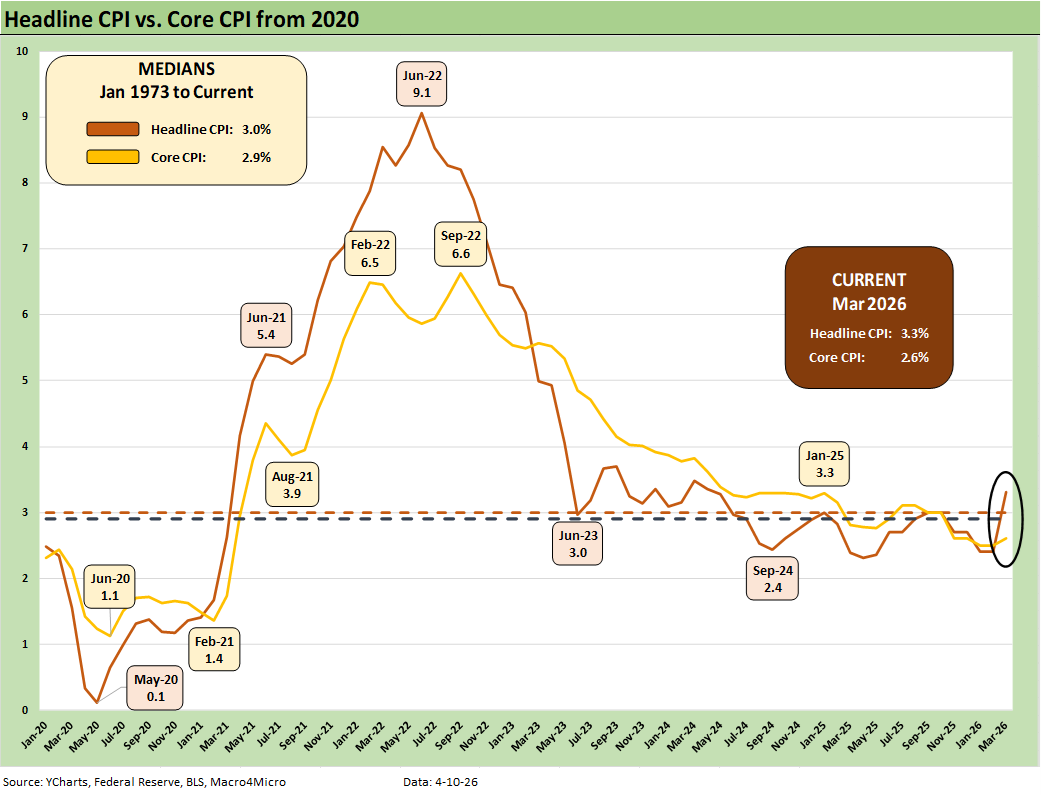
The above chart plots the time series for headline and core CPI since Jan 2020 just ahead of COVID. We also detail the long-term medians for each from Jan 1973 with a 3.0% median for headline CPI and 2.9% for core.
Headline CPI of 3.3% is where the market was hovering back in Jan 2025, so we should not be seeing victory laps from the White House on CPI metrics. The Core CPI of 2.6% is above the Sept 2024 lows of +2.4% and also is not “end zone dance” material for Team Trump.
The 2.6% core number is clearly a respectable number in historical context and below the long- term median. That said, it is not a reassuring backdrop with Iran and tariffs still a major risk factor in how goods and services could get priced in 2026. The market also still faces uncertainty around the USMCA review, NATO withdrawal threats, and how that all plays into trade responses.
While economists typically prefer the “core CPI” metric, I remember putting gas in the car next to the supermarket after the Arab Oil Embargo (started Oct 1973 as part of an Israeli war response) was showing its stagflation effects. Headline CPI seemed more important to household purchasing power and household discretionary cash flow. Monetary theories were not the topic du jour in Brockton MA that year (notably in a town dominated by home heating oil at the time).
As we look back at the adventure across the inflation spike of 2022, the damage was mitigated by a well-managed set of Fed actions across 2022 and 2023 that took headline CPI down from 9.1% in June 2022 to 2.9% in Dec 2024. Trump speaks of his 2025-2026 performance as if he started in June 2022 when CPI was 9.1%. Headline CPI is 0.4 points higher now at 3.3%.
Our oft-stated objection to the cause-and-effect rhetoric is that Trump never mentions the role of Russia invading Ukraine in Feb 2022 or how that slammed global oil and LNG and fueled inflation in the US. In fact, Putin gets a red carpet and even gets to cash in on the current crisis in Iran. No blame there from Trump for any US inflation.
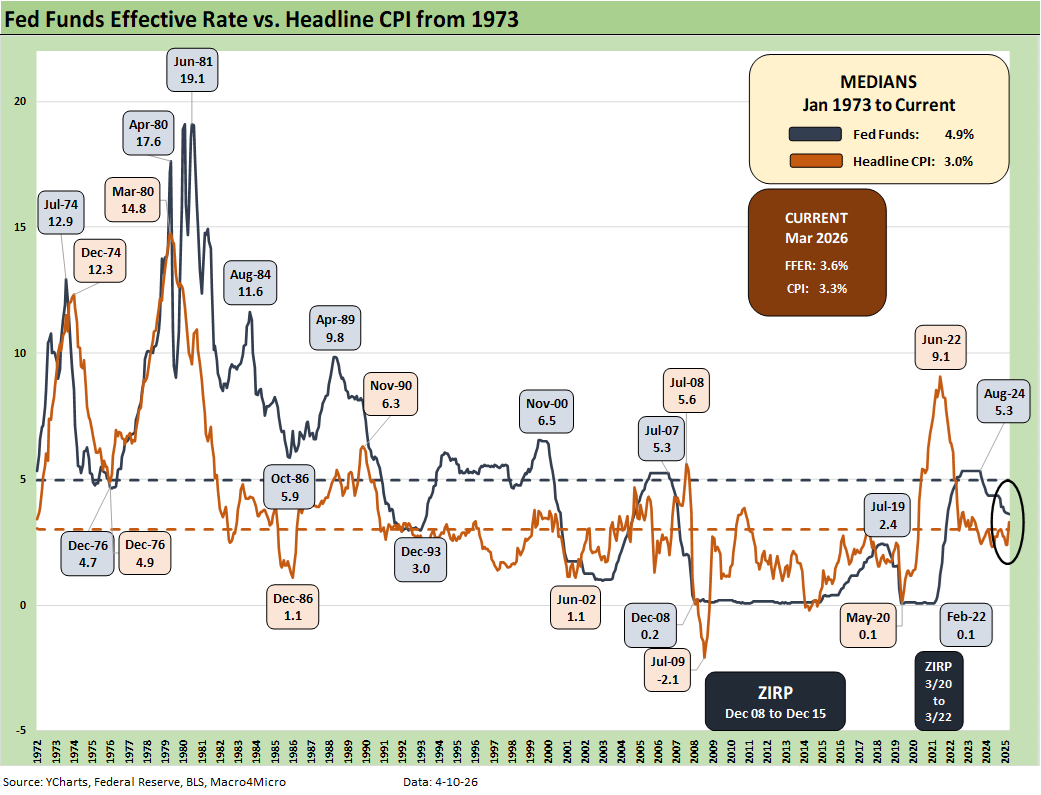
The above time series offers a reminder of the multiple inflationary market imbalances across the decades. We plot CPI vs. fed funds to give a sense of Fed policy and real fed funds rate. The combination of inflationary pressures and FOMC question marks could leave the market with negative real fed funds in 2026. If Trump gets his way on lower fed funds, that potential only rises.
As we go to print, the FedWatch “Vegas line” showed a 83.4% chance of no change by the Oct FOMC meeting. The chance of 1 hike by then is just below 2% with the odds of 1 cut by then at 13.9%. As we covered in earlier commentaries, those odds have been whipping around since the start of the Iran War (see Market Commentary: Asset Returns 3-30-26).
The CPI spike in the aftermath of the COVID supply crisis came on the other side of excessive stimulus action that turbocharged demand, in turn bringing major supply-demand imbalances in the goods markets. That inflation effect had ZIRP tailwinds with the invasion of Ukraine by Russia in late Feb 2022 serving as a critical inflationary factor that seldom gets mentioned in the partisan attacks.
The chart offers a look at the first major inflation spike since 1979, which brought Volcker into the job by August that year. The 1979 energy volatility is often framed as the “Iranian oil crisis” (sound familiar?). That earlier 1979 inflation spike rolled into the mother of all tightening cycles from Volcker (including some 20% fed funds days not evident in the weekly average data of that period). That chaos brought a double dip stagflation cycle across 1980-1982 that crushed many bellwether companies.
This current Iranian crisis is much more serious and damaging than the 1979 experience since the US is the #1 oil and gas producer in the world and a major exporter of oil and gas liquids and also includes downstream refined products. The unfolding downstream product supply crisis is doing serious damage from Europe to Asia with jet fuel supply leading the headlines this past week.
The US also neighbors to one of the largest bases of reserves with Canada, who is a major supplier with room for impressive growth if the Canadian policy makers can get out of their own way. Trump has given them plenty of reasons to build their global export capacity and be less dependent on US end markets. Canada is by far the largest oil importer into the US, which in turn frees up more US supply of oil, refined products, and LNG to export.
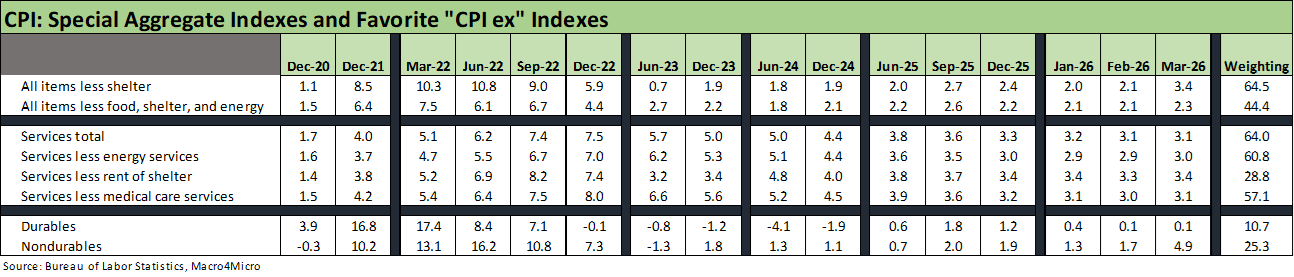
The above table details a subset of the special aggregate CPI indexes we watch. “All items less shelter” is flashing some warning signs with a significant move higher for YoY metrics during March 2026. Services CPI remains above the 3.0% line as does “Services less energy services” at 3.0%.
We see Durables MoM CPI remaining in check over the past two months as the market tries to handicap where the tariff actions will start to play a role. Nondurables CPI rose to almost 5% in March at 4.9%. “Nondurables less Food” (not shown) hit 7.4% YoY in March.
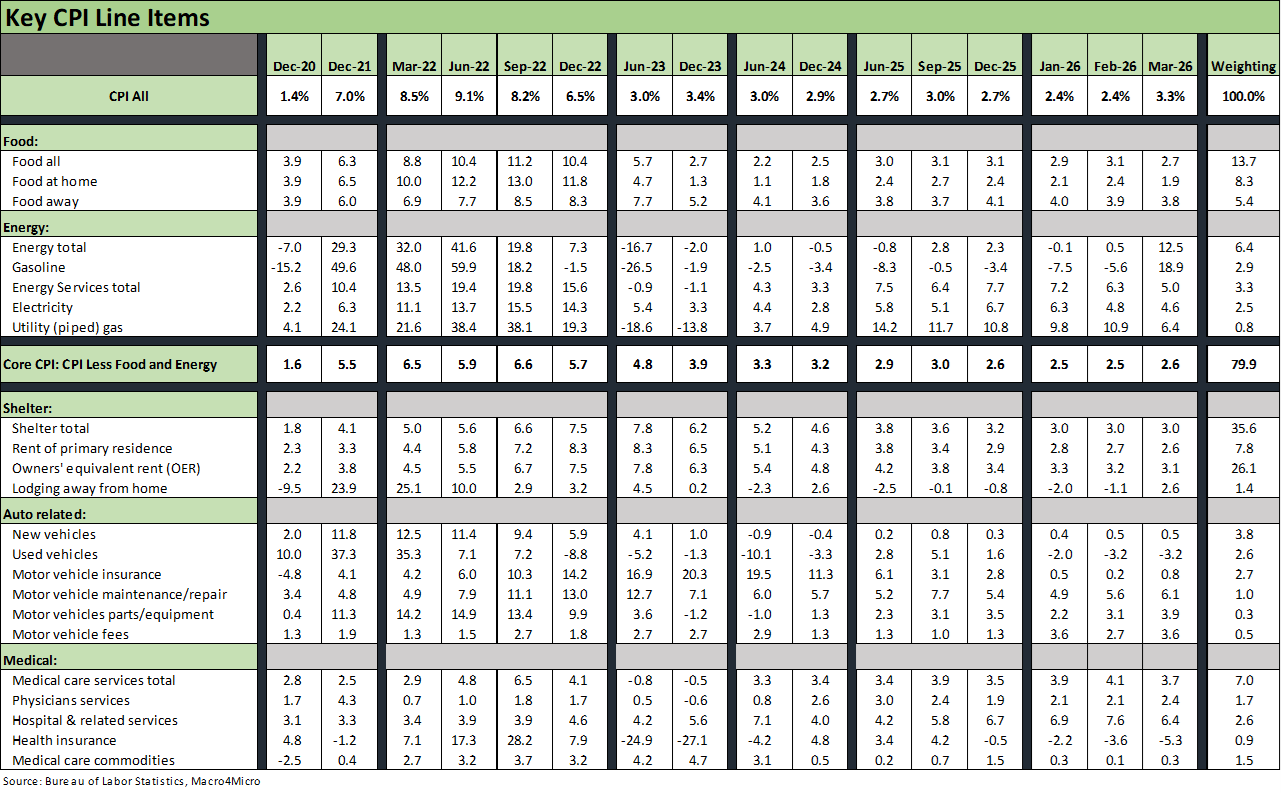
The above table details our Big 5 subsectors for CPI. These roll up to around 75% of the CPI index, so overall this mix is the main event. We already addressed energy and health insurance above. Energy has a very wide range of potential outcomes subject to the rather bizarre twists and turns of a “game theory” with no rules and too much “humanity” in the picture. The toxic mix includes high geopolitical economic stakes, massive egos, religious zeal, and an uncomfortably high mix of cultural ignorance, incompetence and rampant dishonesty.
Medical care services at 3.7% YoY includes “hospital and related services” and moved lower from 4.1% in Feb 2026. With health insurance premiums soaring (despite the BLS measurement), the -5.3% health insurance CPI number seems less than credible. The BLS needs to rework its methodology to better reflect reality. To the extent households drop off health insurance on affordability (notably in the ACA), they then must face that 6.4% CPI threat from “Hospital and related services.” That is down from 7.6% in Feb 2026.
We put together a version of Automotive that is around 11% of the CPI index if we exclude gasoline, which we include in energy (see Automotive Inflation: More than Meets the Eye10-17-22). The discipline shown by OEMs in new vehicle pricing could be coming to an end in 2026 with small increases going a long way on big ticket items and funding costs seeing little relief so far. The CPI cost of a vehicle does not include financing costs, so it comes with an “asterisk” on affordability.
The table above tells the story with “Food-all” at 2.7% (down from 3.1% in Feb 2026). If we use “Food at home,” the 1.9% in March is better than the 2.4% in Feb 2026. In other words, food inflation in general has improved sequentially but there is a lot of noise ahead with labor costs, fertilizer pressures, the cost of simply operating equipment before considering freight and logistics add-ons that flow into the consumer cost.
Both “Food at Home” and “Food Away from Home” are higher in March 2026 than in Dec 2024 (Biden’s last full month). The CPI levels by product line vary widely. Meat CPI at 6.8% YoY was down sequentially from Feb 2026 (Beef and Veal at 12.1%) with Lettuce at 13.8%, Tomatoes at 22.6%, Coffee at 18.7%, and Sweets at 8.1% on the list of gripes for many, including me (I cannot live without lettuce. Sarcasm alert).
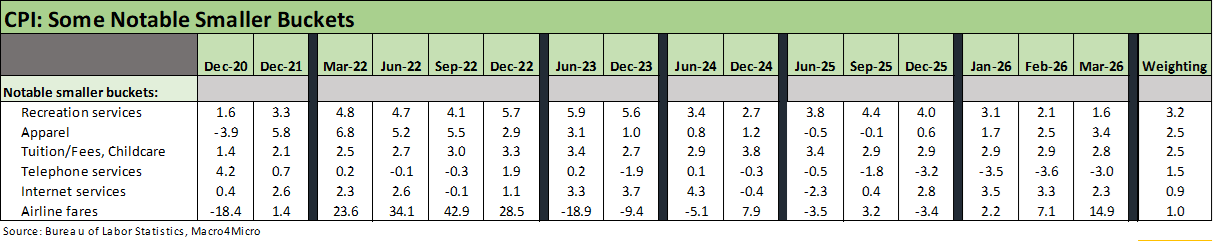
The above table highlights a few categories near and dear to many households. Recreation services declined and are well below the 2022 to 2025 levels seen with the post-COVID boom in consumer spending.
We see the lofty tariffs on the “labor arb” countries (notably in Asia) starting to show up in the Apparel line. While 3.4% CPI on Apparel is not back at 2022 levels, there is room for trouble there. February and March were going the wrong way quickly in MoM metrics.
Next comes the simple cost of freight and logistics that will add to the cost recovery challenge. Diesel is up sharply, and that will weigh heavily on delivery costs and related surcharges for all goods and that includes apparel. That will show up in new inventory and cost of sales even as pricing decisions to mitigate tariffs see more visibility (note: buyer writes the check for tariffs, no matter what Trump says). The tariff and freight knock-on unit cost effects will lead to pass-through pricing decisions or worse margins. Choices need to be made.
Material costs in clothing also include a heavy mix of downstream hydrocarbon derivatives that feed clothing prices. While it may not match the market share of the polyester disco shirts (1970s), synthetic clothing costs can impact profit margins and pricing strategies in manufacturing.
Airline fares are tied to jet fuel prices, so that air fare CPI of 14.9% is up from 7.1% in Feb 2026 and 2.2% in January. Jet fuel as a refined product is high on price and short on supply globally. How that flows into vacation plans and business travel is a factor to watch. Summer is the peak travel season.
See also:
4Q25 GDP: More Adverse Revisions in the Golden Year 4-9-26
The US as an Aspiring Emerging Market: Fiscal SNAFU, Political FUBAR 4-6-26
Employment Situation March 2026 4-4-26
Payroll Focus: ADP Highlights March 2026 4-1-26
JOLTS Feb 2026: Openings Down, Hires Down, Layoffs Up 3-31-26
Market Commentary: Asset Returns 3-30-26
UST Deltas: Elevation Realities 3-29-26
Market Commentary: Asset Returns 3-23-26
Market Lookback: Confusion Reigns, Dislocation Pours 3-22-26
New Homes Sales Jan 2026: The Nays Carry 3-19-26
Producer Price Index Feb 2026: Getting Warmer 3-18-26
Industrial Production Feb 2026: Capacity Utilization 3-16-26
Market Lookback: The Gulf of Cause and Effect 3-15-26
PCE Inflation Jan 2026: Personal Income & Outlays 3-13-26
Housing Starts Jan 2026: Total Starts Up, Completions Up, Permits Down 3-12-26
Existing Home Sales Feb 2026 3-10-26
VIX: Market Still Not Getting the Vapors 3-6-26