
Employment Situation March 2026
March payroll adds exceeded the post-Jan 2009 monthly median for the first time since Dec 2024.


Fireside chats ain’t what they used to be.
With a confusing, repetitive, and internally inconsistent speech after demanding network time, the Trump Iran game plan remains in a state of confusion for those planning fixed investment and payroll decisions. WTI ended the week at a “post-Iran” high. That sets the tone for FOMC planning with decent jobs numbers as the Fed frames the inflation vs. payroll trade-off. The UST curve rallied during the week after a period of rising. The moving parts remain in flux.
The good news is that this past week brought solid March payroll numbers on Friday after earlier constructive ADP numbers. JOLTs have time lags, and those were less reassuring (see Payroll Focus: ADP Highlights March 2026 4-1-26, JOLTS Feb 2026: Openings Down, Hires Down, Layoffs Up 3-31-26).
The Establishment Survey posted a payroll increase of 178K, which is the highest since Dec 2024 and the first month in Trump 2.0 that exceeded the median monthly adds from Jan 2009 through March 2026. Services accounted for +143K of the increase with Goods at +43K and Government -8K. In contrast to the ADP report, BLS’ Manufacturing posted a positive number for March at +15K for a YoY tally down by -29K vs. March 2025. Fed 2026 payroll adds were revised lower to -133K while Jan 2026 was revised higher to +160K as confusion is the theme for FOMC handicapping.
The Household Data shows a decline in total employed in March 2026 from Feb 2026 of -64K and a decline of -661K YoY vs. Feb 2025. The ranks of the unemployed declined by -332K from Feb 2026 but total unemployed rose by 107K vs. March 2025. The net effect relative to the workforce is a tick down in the unemployment rate to 4.26%, which would be considered full employment in past cycles. The March 2026 U-6 ticked higher sequentially to +8.0% from 7.9% in Feb 2026 and 7.9% YoY vs. March 2025. It is hard for the FOMC to get too nervous over that 4.3% rate with oil at a cyclical high and the inflation side of the mandate still in the lead.
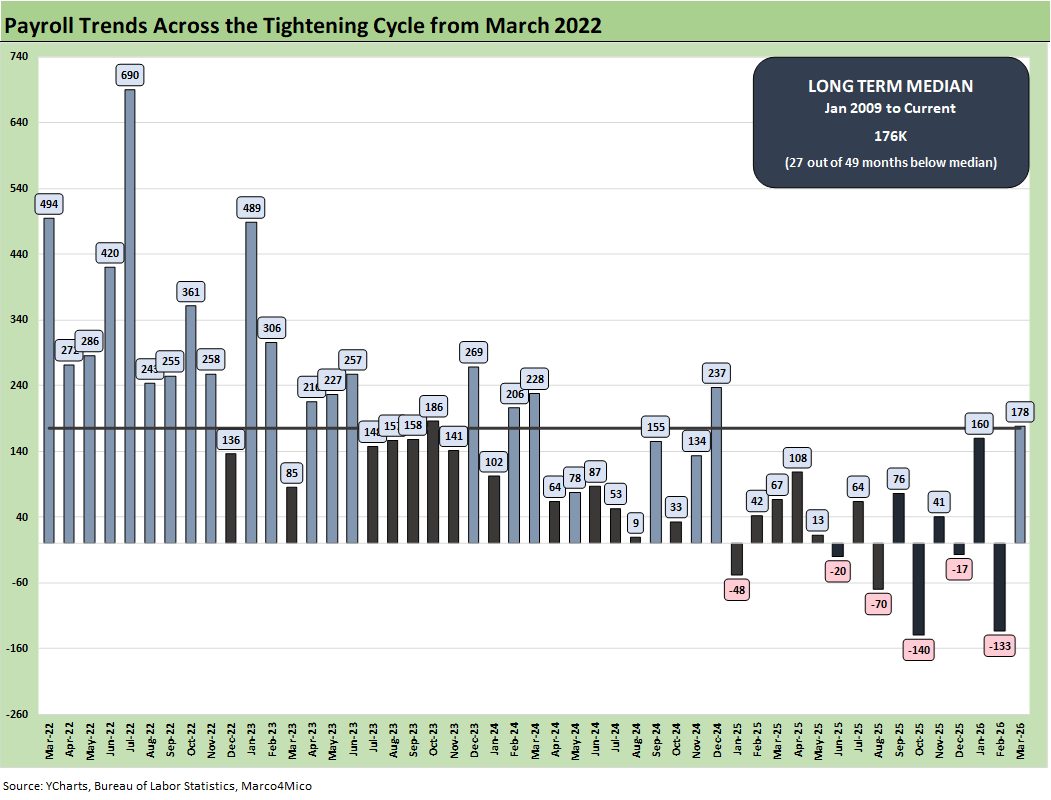
The monthly payroll adds/declines chart above starts in March 2022 with the end of ZIRP and the start of the tightening cycle. The bar chart tells an objective data story. The +178K for March 2026 drove the U-3 rate lower to 4.3% or back to the January 2026 level from 4.4% in Feb 2026.
The numbers in 2025 and 2026 include the only negative deltas on the chart with 6 months in the red during Trump 2.0. Furthermore, the 2025-2026 months were all below the post-Jan 2009 median of 176K until March 2026 edged above it.
That long-term median period includes a slice of the longest recession since the Great Depression, so it is not a high bar to clear. Those payroll numbers from Jan 2025 to March 2026 offer no bragging rights. Health Care and Social Assistance (89.9K) + Leisure and Hospitality (44.0K) comprised 133.9K of the job additions tally. We would tag those as low multiplier effect sectors.
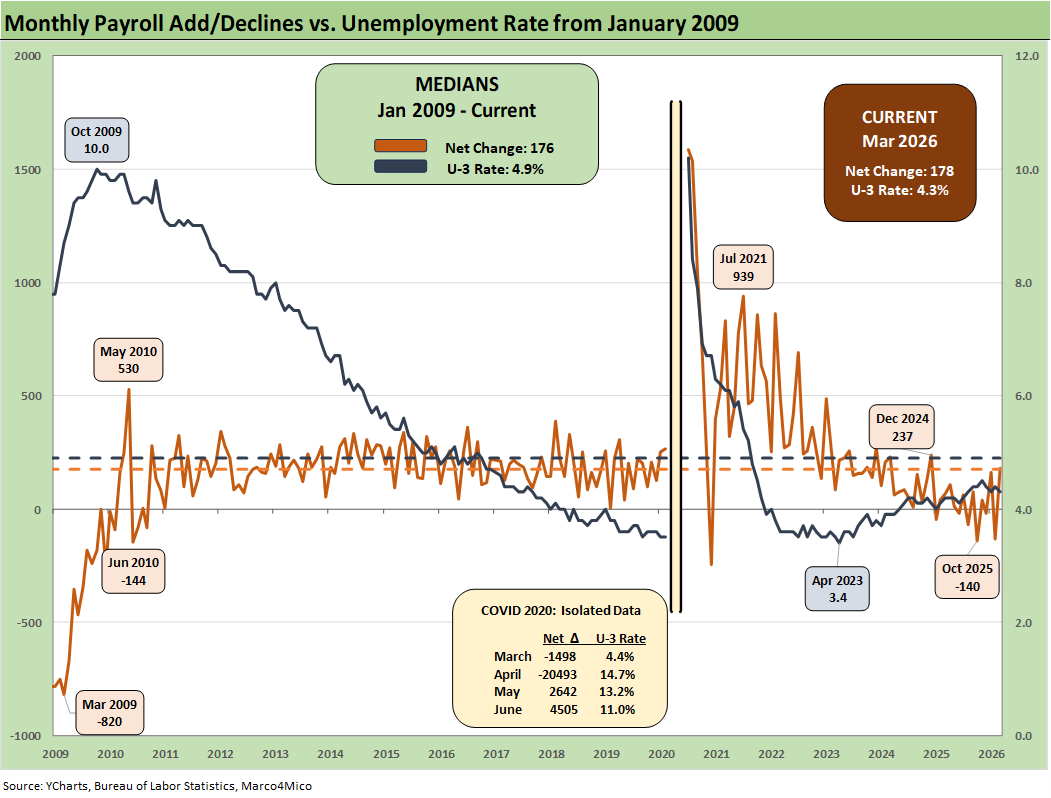
The above chart plots the running job adds/declines since Jan 2009 against the unemployment rate, which ticked lower MoM to 4.3% from 4.4%. In the chart, we isolate the worst months of the COVID dislocations in the box for better visuals to capture the other periods.
The 4.3% U-3 is below the long-term median of 4.9%. The 4.3% is still a solid number across the cycles. Payroll has been struggling somewhat in relative terms, but history is kind to 4.3%. If the 2025-2026 frame of reference is 2024 (not a good jobs year) then the 2025-2026 numbers are not so bad. If we compare it to the 2022-2023 period, the current job adds run rates are grim.
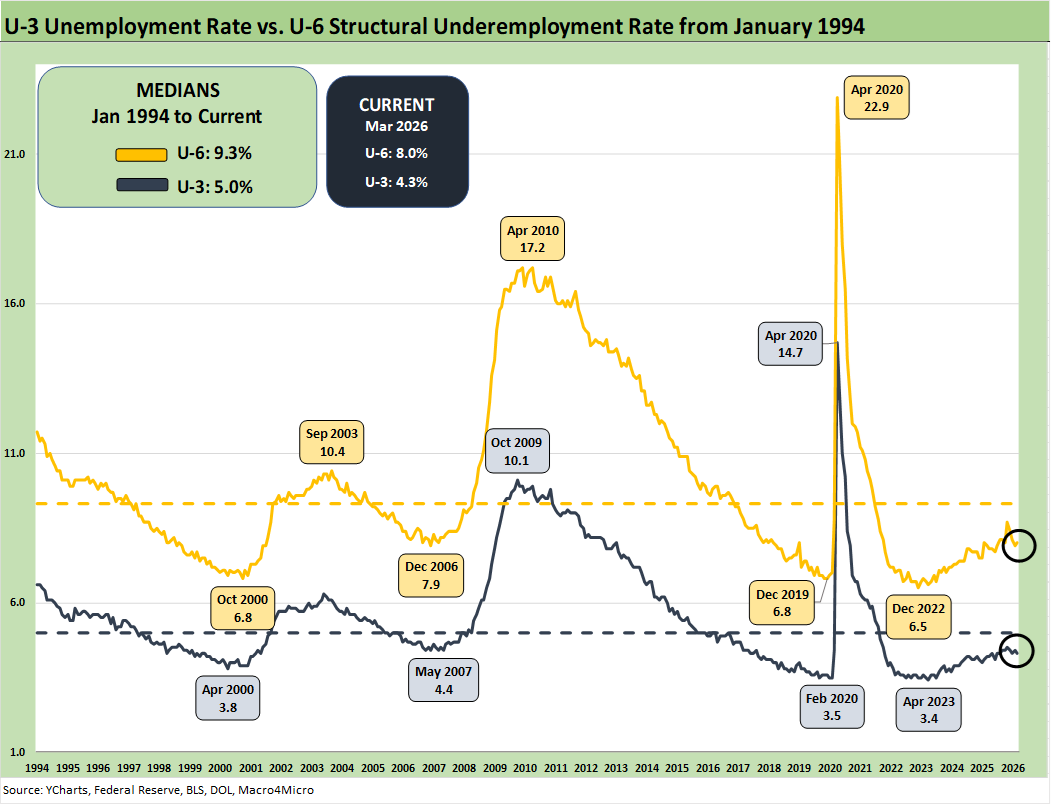
The above chart updates the time series for the U-3 unemployment rate and U-6 structural underemployment rate across the years from 1994. As noted, the current U-3 rate ticked lower to 4.3% from 4.4%.
As a reminder, the U-6 metric is defined with the numerator as “total unemployed + persons marginally attached to the labor force + total employed part time for economic reasons.” The denominator is “civilian labor force + workers marginally attached to the labor force.”
The U-6 is the structural underemployment metric that is always useful to watch. The U-6 jumped to 8.7% in Nov 2025 from 8.1% in Sept 2025. To start 2025, the U-6 rose sharply in Feb 2025 to 8.0% from 7.5% in Jan 2025.
The current 8.0% is a tick lower from 7.9 % in Feb but is well above the 6% handles seen in spring of 2023. The U-6 is still below the median from 1994 of +9.3%, which notably includes the post-crisis shock and the longest recession since the Great Depression.
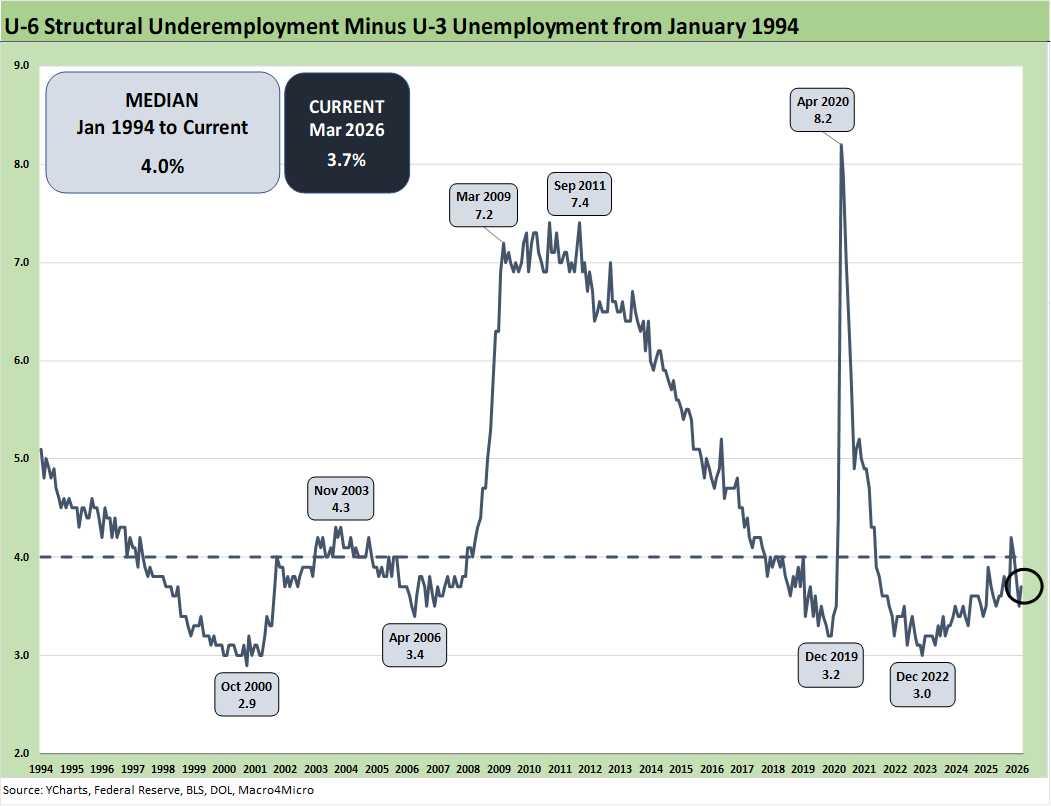
The time series above updates the U-6 minus U-3 differential as a measure of relative employment quality and to flag risks of major dislocations in large swaths of the economy (think oil patch collapse in the late 1980s, tech bubble imploding into a weak 2001-2003, financial services and automotive meltdown in 2009).
The current 3.7% differential is below the long-term median of 4.0%. The job ranks are still vulnerable now with the Iran war effects flowing into hiring decisions, industry fundamentals, and FOMC policy planning.
Many questions will be getting answers with respect to how tariffs and the oil spike will flow into hiring, investment, working capital cycles, new capacity planning. The wide range of potential outcomes is clear enough in that “boots on the ground” cannot be ruled out until those boots and bodies return home.
Escalation and “take the oil”
A material escalation would be about a lot more than the US and would hit Europe and Asia especially hard. It would not take much creativity to figure out how China (Taiwan) and Russia (Ukraine, Baltics) could react to exploit such chaos. Then the global cycle nerves begin anew.
The “take the oil” mantra from Trump by the end of the week implies massive manpower demand, military resources, budget bleeding (and UST supply) and unpredictable escalation of the conflict. That means even more problems from oil prices and supplier chain dislocations. That would necessarily hit payroll and economic growth.
Tariffs are still near the top of the risk checklist…
Reshoring has been very slow as the manufacturing payroll trends imply. We are seeing major plans to relocate automotive OEM capacity back to the US, and that should attract more supplier chain capex. The auto supplier to OEM chain will be a focal point in the upcoming USMCA review process with Canada and Mexico. Autos is only one small piece of the manufacturing picture despite all the headlines.
In contrast to autos, the idea of a major new aluminum smelter in the US will not happen based on economics and the timeline to build one. Low-cost power is essential for such smelting activities, and data centers would be happy to pay a multiple of what an aluminum smelter would see as cost effective. There are a lot of stories along the manufacturing chains with some good and plenty bad. For now, manufacturing payrolls are “net bad.”
Some of the risk issues get swept up in immigration and deportation numbers, but the analysis always comes back to the number of workers with paychecks. Employers will be making decisions to mitigate the tariff damage with tariff cost mitigation strategies (e.g., layoffs) if they are not passing along the cost in prices or want to limit the scale of price increases to customers.
The AI wildcard in manpower needs sees a lot of speculation in the manufacturing sectors but even more so in Services payrolls. That has been evident in some recent stock volatility across SaaS-based business services leaders.
There is no hiding from the need for economic reactions along the supplier-to-customer ecosystem. Someone always pays – including those “paying” with layoffs in tariff cost mitigation decisions.
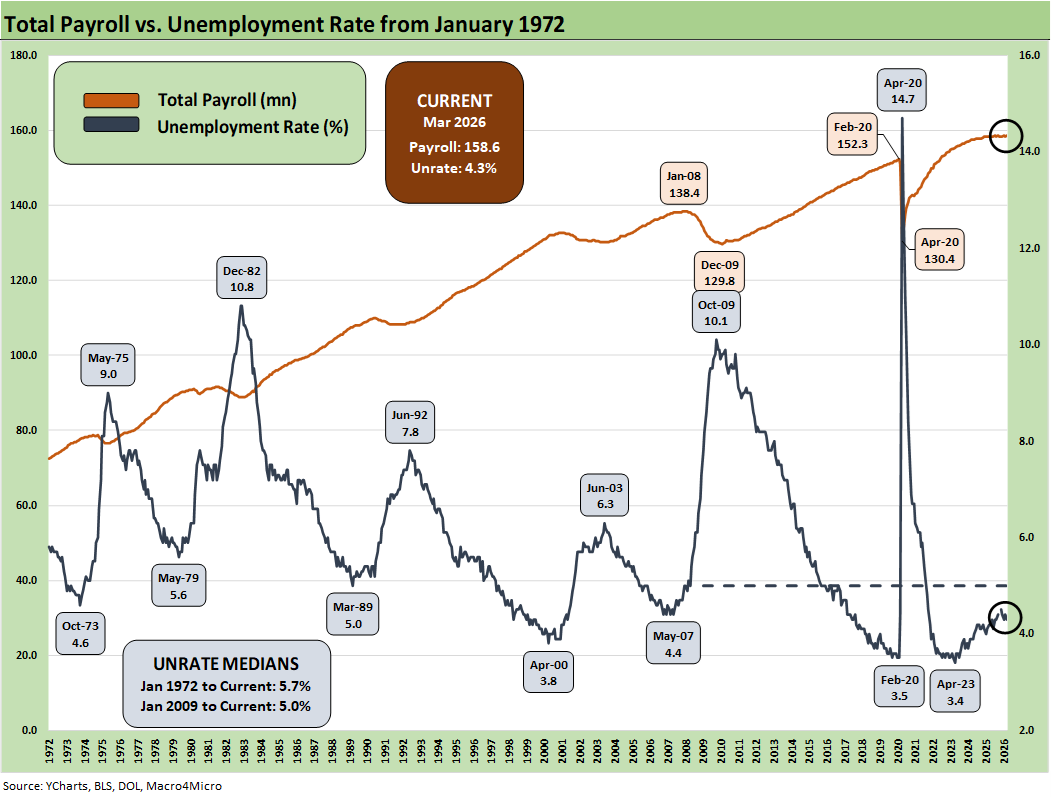
The above chart updates total payroll vs. the unemployment rate. The trend needle has not moved much in 2026. More bodies with more paychecks are always a good thing. The trick from here is how the consumer deploys that paycheck and whether the zero-sum realities of household budgets undercut spending. The need for defensive spending habits in light of impaired household discretionary cash flow could become a bigger headwind in the aftermath of the Iran fallout.
As noted in the bullets at the top, the total employed in March 2026 moved lower from Feb 2026 by -64K and show a decline of -661K YoY vs. Feb 2025. That flunks the “more bodies, more paychecks” rule.
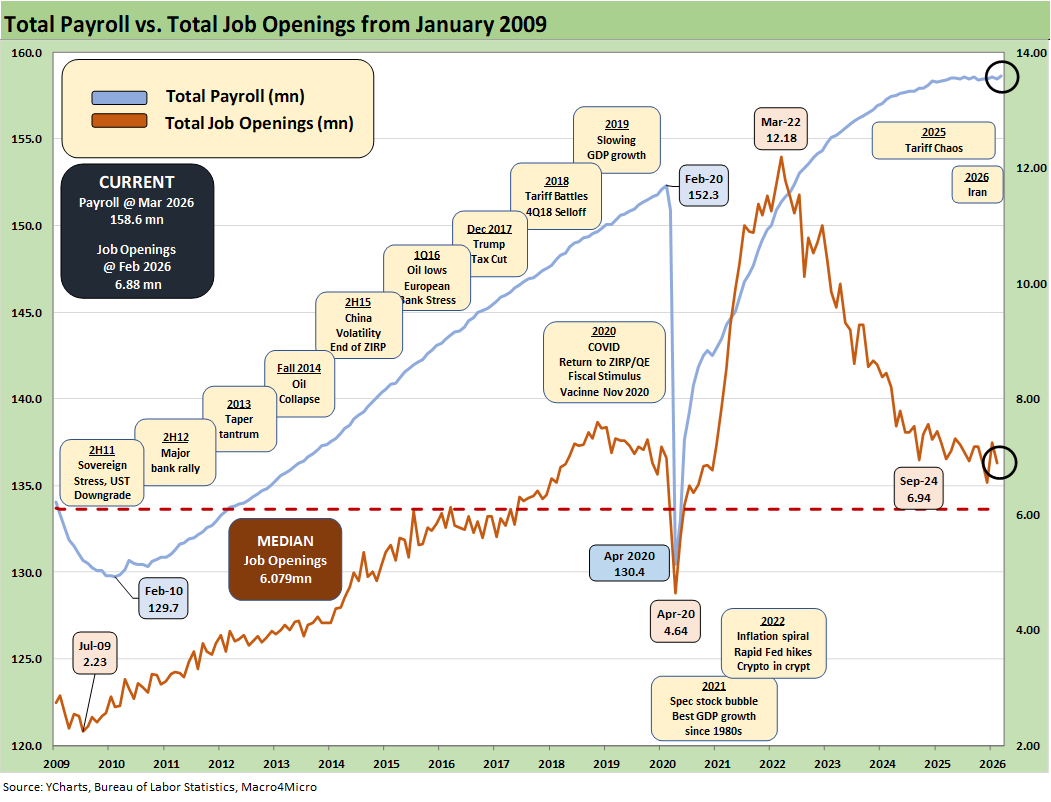
The above chart updates the total payroll number vs. job openings. JOLTS data analysis had been slowly recovering from the shutdown, and is now back into the lineup with its usual 1-month lag (see JOLTS Feb 2026: Openings Down, Hires Down, Layoffs Up 3-31-26).
Management teams have a lot of moving parts to factor into planning whether quantitative or qualitative. The final IEEPA decision from SCOTUS came in against Trump, but he was prepared to start slapping on tariffs under Section 122, 232, and 301. Notably, Section 301 tariffs (“fair trade”) are underway and are topics for other days. They will create more trade partner strife.
The trade flows have been looked at in many past commentaries (see Meanwhile…Back in Economics and Tariffs 3-2-26, US Trade with the World: Import-Export Mix 2-25-26). The latest trade disruptions from the Gulf and the related supply chain problems (oil, LNG, helium, aluminum, etc.) have been getting a lot of headline time. The disruption could get much worse via the Red Sea if the Iran War escalates and the Houthis pile on. There are also the contingent threats of Iraqi Shiite militia. The FOMC and the market both have much to digest.
The fallout in consumer spending from health care premium increases now are joined by energy price stress and $4 regular gasoline. Home heating oil bills could get much worse later in the year if this lasts.
The retrenchments in SNAP spending and eligibility criteria challenges promise household stress and could signal trouble ahead in the lower part of the “K” household mix. Trump’s latest budget plan offers little relief to the lower part of the K recovery and in fact piles on with cuts to many programs.
Inflation reports had generally brought good news relative to expectations given the scale of the forward threat from tariffs and lagging effects to be seen across working capital cycles. That said, the inflation creep and affordability strain has clearly been in evidence and taking a toll on inflation across select product groups. PCE inflation and CPI will see a lot of pressure as Iran effects and material costs roll in on top of tariff-based pricing decisions that have been slow to unfold.
Tariffs will stay in the thick of the pricing pressure battle, and industries such as autos are likely to see more upward price pressure after a year of relative caution by OEMs to protect their customer base and dealer network. The OEMs had wanted to move cautiously with Trump (which by itself is a sad comment on how free markets have suffered under this administration). Now we will be adding much higher energy inflation from gasoline to go with the very high electricity CPI metrics and utility piped gas inflation.
The overall economic impact of tariffs had been far less than feared given the reality that most trade partners backed down in 2025. That could change in 2026 with many more battles on the table such as a threatened embargo of Spain that would pull in the EU (Anti-Coercion bazooka?) and the USMCA review.
The breakdown of relationships with the EU, the #1 trade partner with the US, have dramatically worsened with Iran and Trump’s increasingly ugly rhetoric and behavior with allies. It is getting weird with insults tossed at Macron’s wife. That is just strange.
The USMCA review will inevitably create a lot of tension with Canada despite the US goods trade surplus the US posts ex-crude oil. Trump needs a cheat sheet on who are the best export markets with around 3 dozen states seeing Canada as the #1 export market.
The fertilizer sector is under stress right now on Gulf supply problems, and Canada is a critical part of that supply. With Qatar facing stress in the fertilizer shipment barriers right now, the Canadian position in potash might be worth keeping in mind. The synthetic crude oil supplies from Canada also offer high diesel yields for refiners that could be critical right now in tempering the rate of increase in freight costs since that flows into food and goods.
See also:
Payroll Focus: ADP Highlights March 2026 4-1-26
JOLTS Feb 2026: Openings Down, Hires Down, Layoffs Up 3-31-26
Market Commentary: Asset Returns 3-30-26
UST Deltas: Elevation Realities 3-29-26
Market Commentary: Asset Returns 3-23-26
Market Lookback: Confusion Reigns, Dislocation Pours 3-22-26
New Homes Sales Jan 2026: The Nays Carry 3-19-26
Producer Price Index Feb 2026: Getting Warmer 3-18-26
Industrial Production Feb 2026: Capacity Utilization 3-16-26
Market Lookback: The Gulf of Cause and Effect 3-15-26
PCE Inflation Jan 2026: Personal Income & Outlays 3-13-26
GDP 4Q25 Second Estimate: Sharp Move Lower 3-13-26
Housing Starts Jan 2026: Total Starts Up, Completions Up, Permits Down 3-12-26
CPI Feb 2026: It’s Making You Wait… 3-12-26
Existing Home Sales Feb 2026 3-10-26
Payrolls Feb 2026: Into the Weeds 3-8-26
Employment Situation Feb 2026: Payrolls Get Ugly 3-8-26
VIX: Market Still Not Getting the Vapors 3-6-26