
JOLTS March 2026: Openings Down, Hires Up, Layoffs/Discharges Up
The JOLTS action was mixed, but the rise in Hires is the important news with more current payroll data teed up for this week.


Tough payroll battles in JOLTS in 2026. March is a draw.
JOLTS saw a +655K increase in hires for March vs. Feb 2026 and +221K incremental hires YoY vs. March 2025. Professional and Business Services, Accommodation/Food, and Transportation, Warehousing and Utilities shared the leaderboard in terms of increased Hires. Manufacturing was only up by 28K sequentially in that 655K total but manufacturing was essentially flat YoY.
Job Openings tailed off by -56K sequentially from Feb 2026 and declined by -86K YoY vs. March 2025 with the biggest decline of -318K in Professional and Business Services. Manufacturing was only 19K higher sequentially but was +73K higher YoY in what could be a good sign if the openings get filled with all the Iran macro noise, the energy spike, and fear of rising rates.
Layoffs were up sequentially by +153K and up by 272K YoY with Professional and Business Services rising the most. Construction and Manufacturing were only down slightly in layoffs.
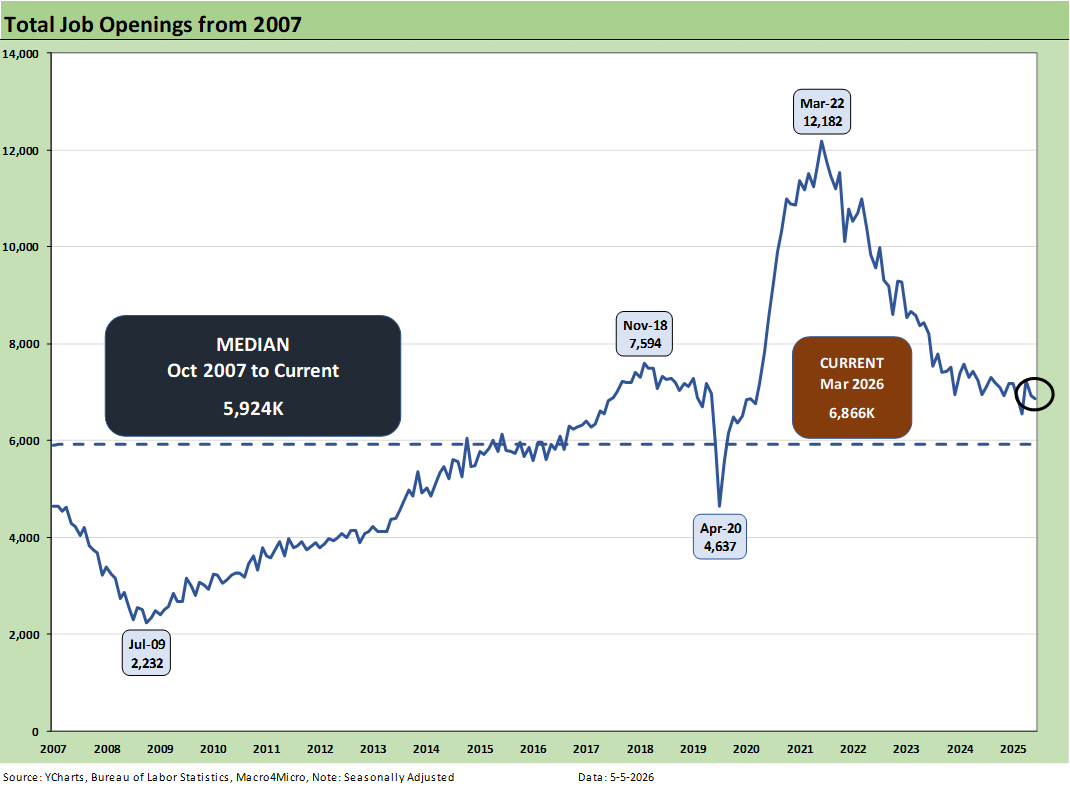
The above time series plots job openings across the timeline from 2007 to current. The sharp, downward trends from the end of ZIRP and start of the tightening cycle in March 2022 show little to celebrate.
The high of 12.2 million off the lows of 4.6 million at the peak of the COVID panic are pretty dramatic, but recent periods are soft. Openings are at least running above the long-term median (5.92 million) with high 6 million handle prints. The 1.2% decline YoY job openings for March 2026 and less than 1% sequentially is not moving the needle much at all considering so many companies are in new budget years and staring at some material moving parts in the macro picture.
The conversations will continue to focus on how many new job openings can be avoided through the deployment of AI tools and technology. As we have been seeing at Meta and Amazon of late, the downsizing of major tech payrolls are also underway to fund capex and streamline costs. That AI fallout is also spreading to the SaaS-based services providers whose stocks have been getting slaughtered (see Market Commentary: Asset Returns 5-4-26). Many of the services providers are worried about their business models. Meanwhile, the tariff cost mitigation strategies also do not help in budgeting for higher headcount.
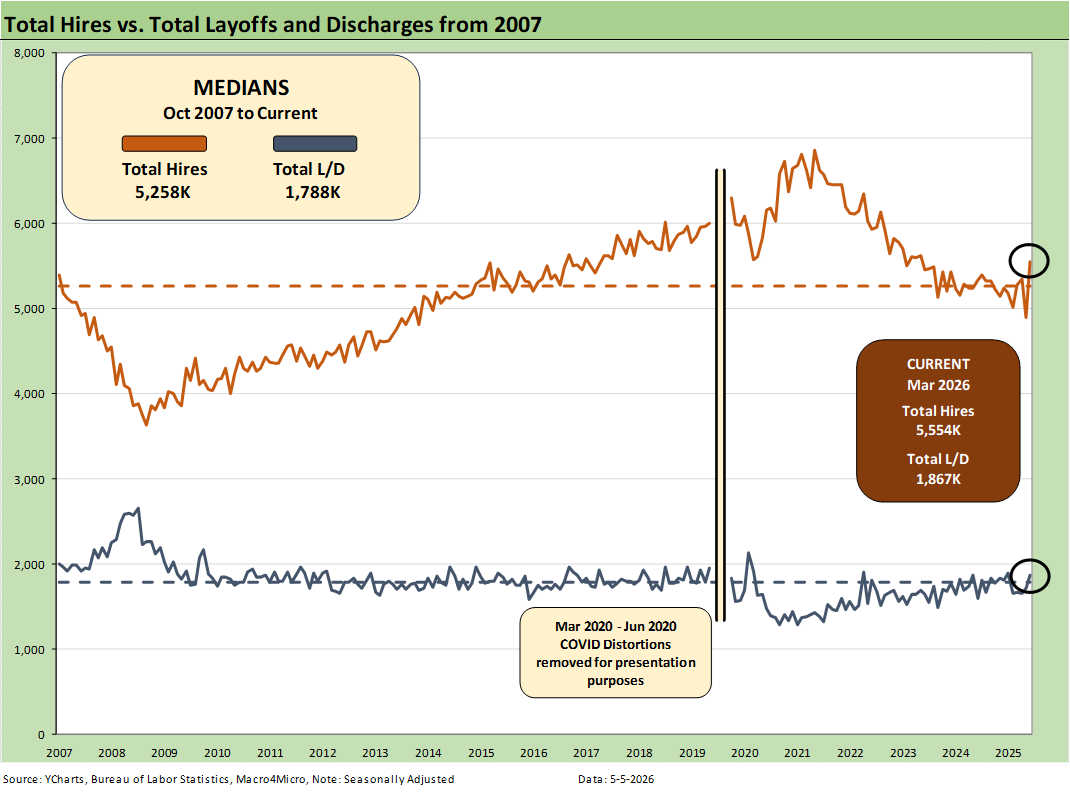
The above chart plots Hires vs. Layoff/Discharges on a SAAR basis. Note: we remove the COVID numbers from several charts to support the visual value for “normal” periods. We comment on COVID history at the end of the note.
Hires rose by +655K sequentially from Feb 2026 while layoffs/discharges rose by 153K. The hires YoY rose by 221K or by 4.1%. While we are in an expanding economy, the annual GDP growth of 2.1% lagged 2024’s 2.8% while the 1Q26 GDP is off to a better start vs. the weak 4Q25 numbers (see 1Q26 GDP Advance Estimate: Consumer Fade, Investment Boom 4-30-26, 4Q25 GDP: More Adverse Revisions in the Golden Year 4-9-26).
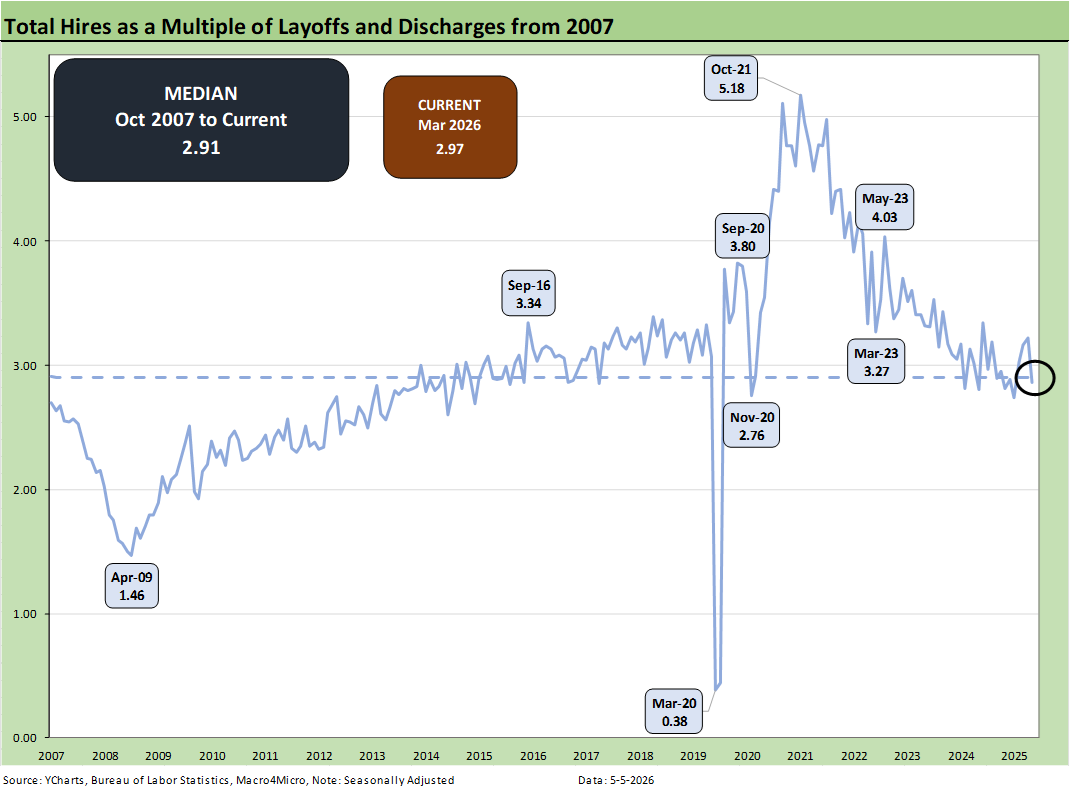
The above chart updates the ratio of Hires to Layoffs/Discharges. The relationship stands at 2.97x, above the long-term median of 2.91x from 2007. The post-2007 period includes the effects of the longest recession since the Great Depression (Dec 2007 – June 2009) followed by the longest expansion in history from June 2009 to COVID (Feb 2020), which brought a very brief 2-month recession wrapped around a wild swing in pandemic employment.
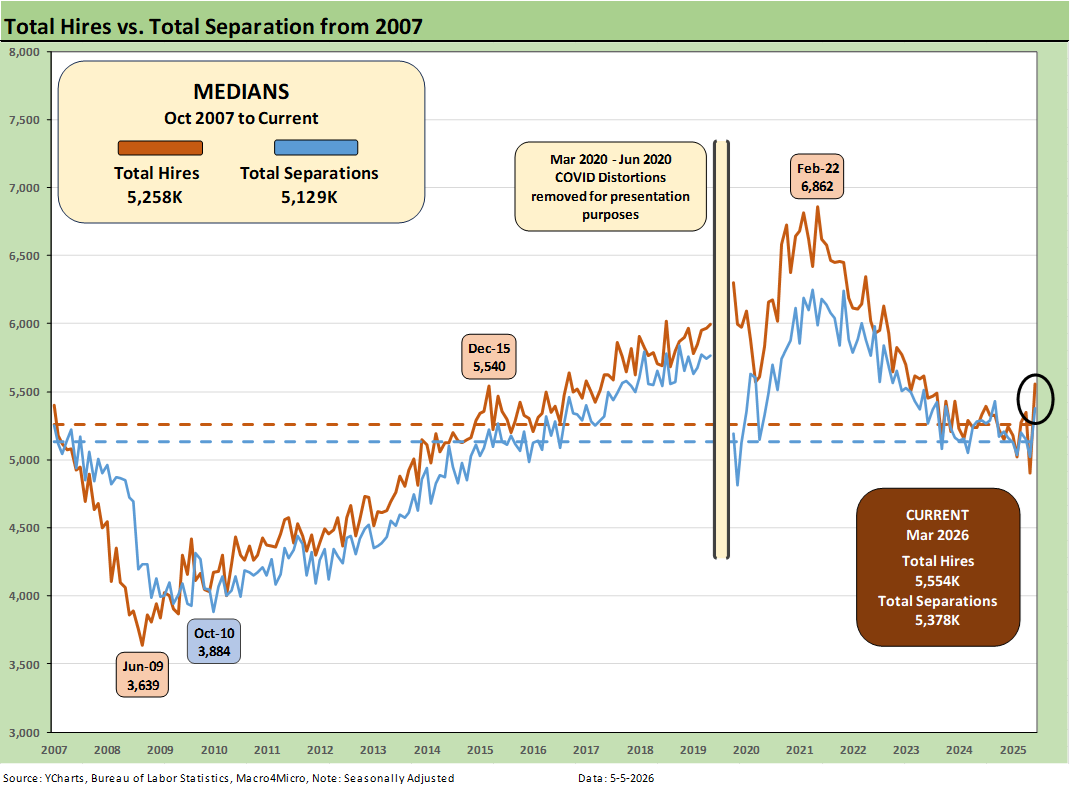
The above chart plots Hires vs. Total Separations on a SAAR basis. Separations include Quits, Layoffs/Discharges, and “Other Separations.” Total Separations moved higher by +356K in March 2026 vs. Feb 2026 and were higher by 90K YoY.
We typically do not find “Total Separations” particularly interesting as a multi-line net number. The increase in Separations can be attributed to a rise in layoffs as noted earlier and to a 125K increase in “Quits.” One theory is quits signal relative confidence in finding a job on the other side of quitting.
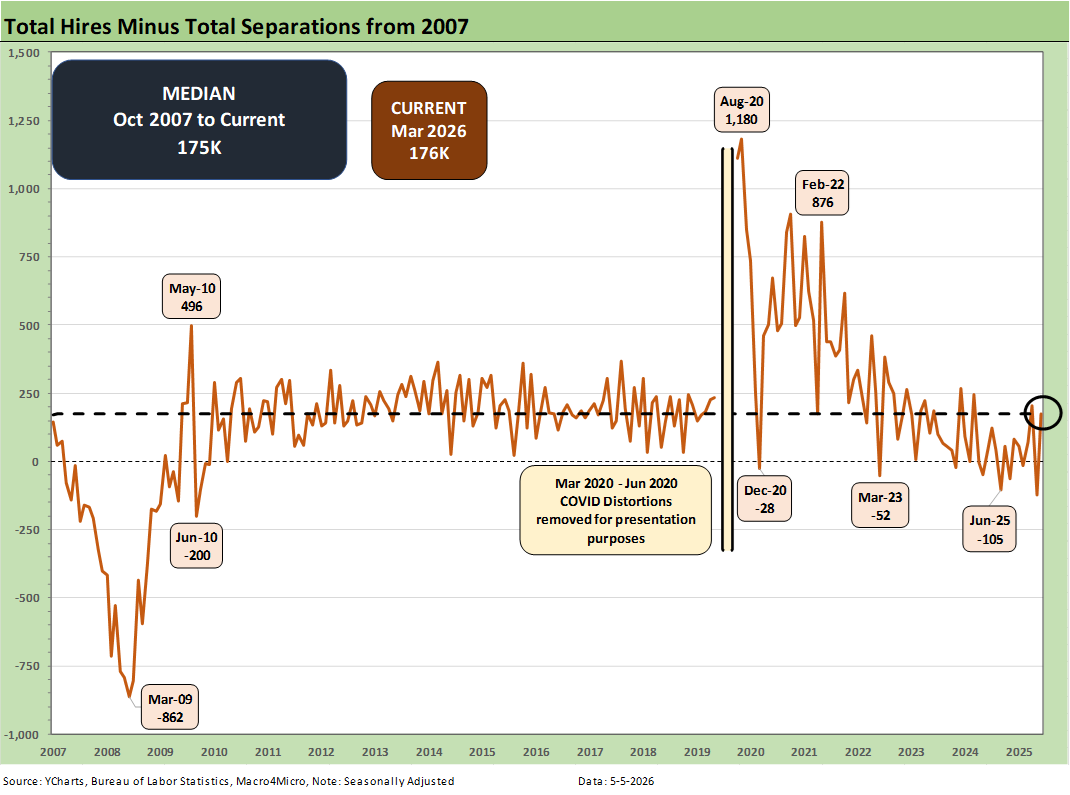
The Hires minus Total Separations differential is plotted above. We recently had some major revisions. As covered above, the sharp rise in Hires was the main event in this month’s JOLTS report. Separations increased on higher layoffs and higher Quits.
The net number above has moved notably lower in recent months and dipped into the negative range in Feb 2026 before bouncing back into positive range in March. The differential is now on top of the long-term median of +175K.
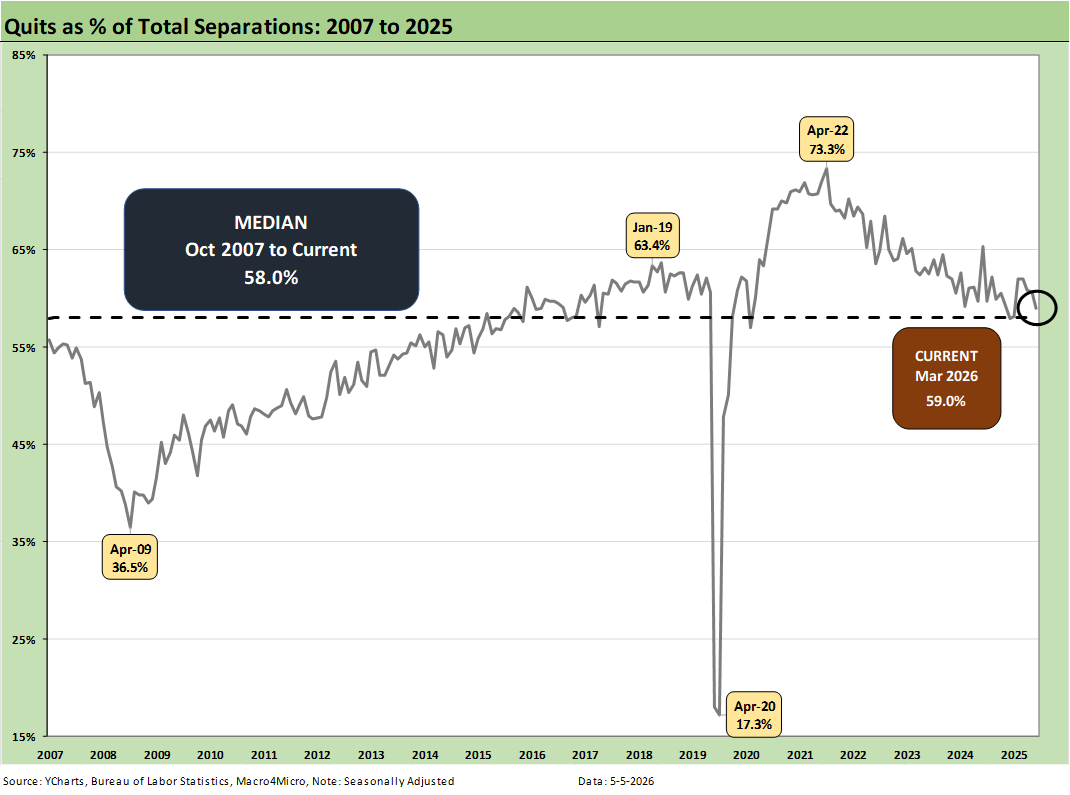
The time series for Total Quits as a % of Separations (SAAR basis) was 59.0%, slightly above the long-term median of 58.0%. The classic “Quits Rate” is measured by Total Quits as a % Total Employment, and that metric moved slightly higher on the month to +2.0%, up from 1.9% in Feb 2026. The Quits rate is also down YoY from 2.2% to 2.0%.
The bottom line on the JOLTS numbers for March is that it was one that UST bulls cannot grasp onto for hopes of easing and the same for the long-suffering bull flattener advocates who are already worried about oil.
While the US is a powerhouse in energy (oil, natural gas, and LNG) and has Canada as a neighbor (as badly as Trump treats them) with Canada the largest oil importer into the US by far, that backdrop takes useful comparisons to 1974 off the table. The Arab Oil Embargo of late 1973 and “odd-even license plate” rationing in the recession is being experienced by many nations at this point. Just not the US. That impacts global growth. Asia is especially vulnerable.
NOTE ON COVID DISTORTIONS
The Hires vs. Separations time series make for interesting numbers but tough charts to plot visually given how much the spike in Separations/Hiring during COVID distorted the numbers from March 2020 to June 2020. The swings literally were off the charts. For presentation purposes, we adjust the charts above to exclude the raw data for those months to get a better vantage point on somewhat more normal times. Compared to COVID, the credit crisis seems “normal” in terms of the job count moves.
For disclosure purposes, Separations across March 2020 (16.3 million), April 2020 (11.6 million), May (4.7 million), and June (5.2 million) were running against Hires in March (5.2 million), April (4.0 million), May (8.1 million), and June (7.4 million). We remove those from the charts to get better scale visuals on the periods that precede and follow as the market saw 50-year lows in unemployment in 2022. Wild swings were experienced by all as industries saw shutdowns and layoffs in the COVID recession. The long-term medians from 2007 to 2022 for Hires and Separations were very close.
Almost 28 million Separations combined in March-April 2020 as a brutal reminder of that period.
See also:
Market Commentary: Asset Returns 5-4-26
PCE Inflation, Income & Outlays March 2026: Inflation Anxiety Level? 5-3-26
1Q26 GDP Advance Estimate: Consumer Fade, Investment Boom 4-30-26
Market Commentary: Asset Returns 4-26-26
Synchrony Financial: Favorable Consumer Credit Signals 4-24-26
Industrial Production March 2026: Mixed Picture, Big Questions Ahead 4-16-26
Existing Home Sales March 2026: New Beginnings or New Ends? 4-15-26
Producer Price Index March 2026: Heater or Curve Ball? 4-14-26
CPI March 2026: The CPI Cycle Could Prove Maddening 4-12-26
4Q25 GDP: More Adverse Revisions in the Golden Year 4-9-26
The US as an Aspiring Emerging Market: Fiscal SNAFU, Political FUBAR 4-6-26
Employment Situation March 2026 4-4-26
Payroll Focus: ADP Highlights March 2026 4-1-26
JOLTS Feb 2026: Openings Down, Hires Down, Layoffs Up 3-31-26
UST Deltas: Elevation Realities 3-29-26
Market Lookback: Confusion Reigns, Dislocation Pours 3-22-26
New Homes Sales Jan 2026: The Nays Carry 3-19-26
Market Lookback: The Gulf of Cause and Effect 3-15-26
Housing Starts Jan 2026: Total Starts Up, Completions Up, Permits Down 3-12-26