
Market Commentary: Asset Returns 5-4-26
We update running asset returns as April more than offsets March damage. Meanwhile, “Tech vs. “Iran” risk factors swirl.


“The Hessians might think I am hiding in a ballroom. Who would do that?”
We saw shaky macro fundamentals in the 1Q26 GDP numbers and the latest inflation release, but the very solid 1Q26 earnings season and “forward revenue model game” in AI and tech are carrying the day. A wide range of potential outcomes remains a nagging and lagging reality to price into the market with equities rocking again and credit spreads tight (see PCE Inflation, Income & Outlays March 2026: Inflation Anxiety Level? 5-3-26, 1Q26 GDP Advance Estimate: Consumer Fade, Investment Boom 4-30-26).
The FOMC changeover is going smoothly enough with Pirro chasing her tail, but the oil wildcard, the payroll numbers this week, and the CPI/PPI next week will test the Fed as they move to set new FOMC policies on data priorities and communication practices during a critical period in coming months with stagflation chatter not going away.
The market saw 6 of 7 bond ETFs in the red the past week with the other 1 of 7 at 0%. 30Y Mortgage rates are above 6.5% (per Mortgage News Daily) as we go to print and are well above the recent low tick below 6.0%. Housing continues to struggle.
Geopolitics is intrinsically confusing and could potentially get more volatile with messaging inconsistent around War Powers requirements (60-day rule etc.) and Trump desperately looking to unwind without looking ridiculous. War Powers Act requirements could lead to one more constitutional problem with the GOP Congressional Castratos thinking about midterm elections.
Geopolitical strife goes beyond Iran with the EU and NATO relations complicating trade policies as well. The EU is under attack from Trump with German autos and threats against Spain seeing thin skin thickening the plot. Meanwhile, the USMCA review will get the tariff topic moving up the list of wildcards for the summer at a time when supplier chains are nearing a state of crisis in metals and fertilizer among other crucial product groups.
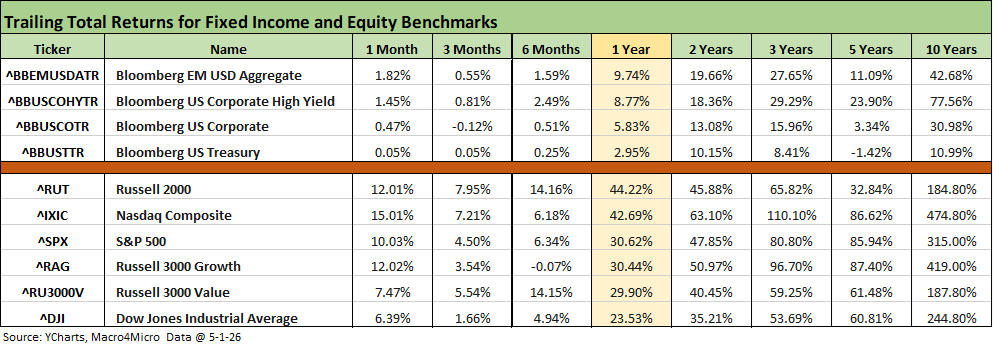
The above table updates the rolling time horizon returns for the main high-level benchmarks and indexes we track. We have seen the numbers swing from all negative for 1-month during late March to all positive to start May as detailed above (Market Commentary: Asset Returns 3-30-26). The UST index was barely positive for 1 month. During late March coming off the Iran escalation, the return lines were negative for the rolling 3 months also.
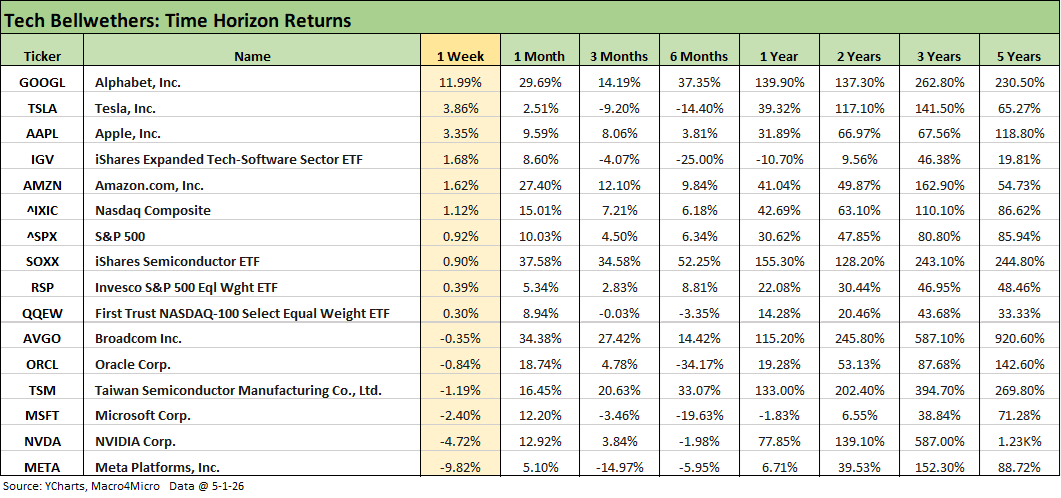
The above table updates the Tech Bellwethers and some relevant ETFs and market benchmarks. As we cover below in the tech check charts, the semiconductor names have turned in very strong numbers while the Mag 7 (and Mag 7+3) have seen a wide range of performances.
The dispersion across the Mag 7 is evident in the past month with banner returns from Alphabet and Amazon and very weak numbers from Tesla and Meta with the remaining 3 of the Mag 7 rounding to low double-digit range.
Of the “other 3” outside the Mag 7, Broadcom rode the rally to over +34% on the month with the volatile Oracle at 18.7% for 1-month (-34.2% for 6 months). The steady, reliable Taiwan Semi posted 16.6% for the month and over 33% for 6 months.
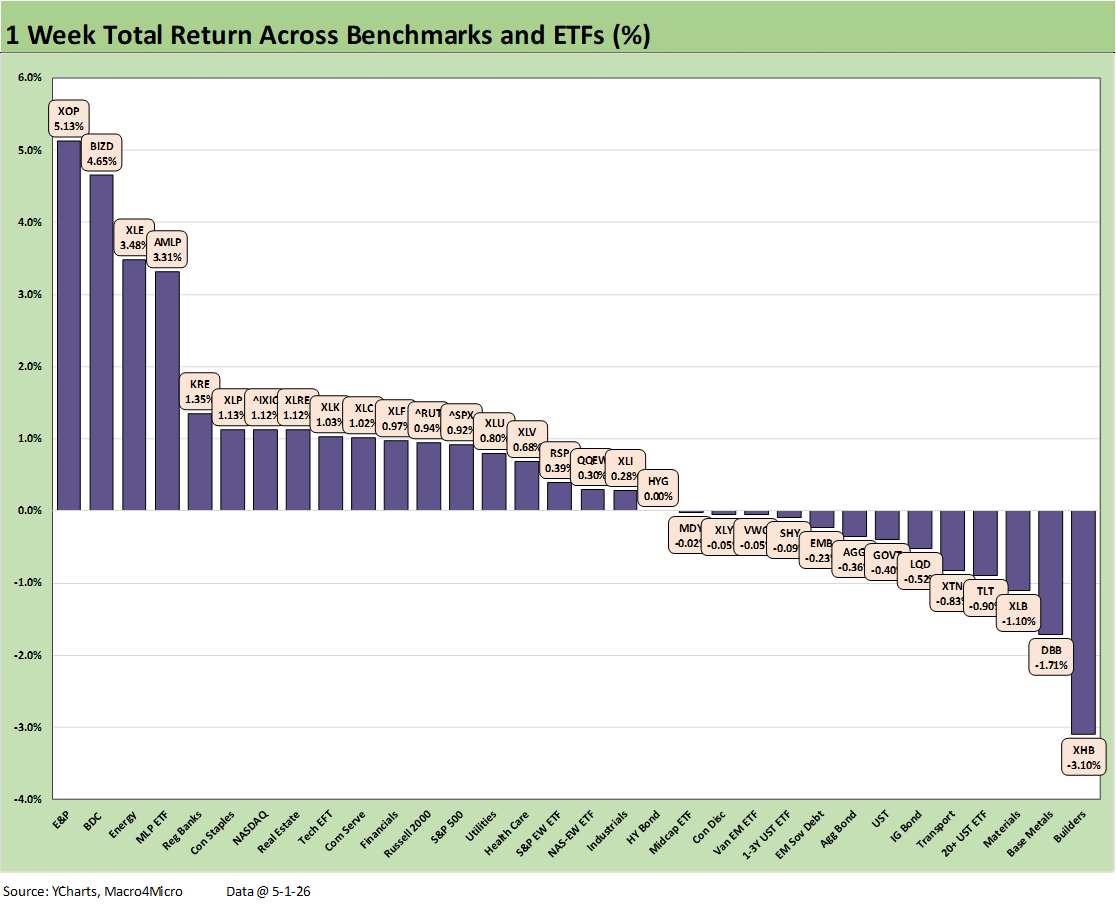
The 1-week returns for the 32 benchmarks and ETFs we monitor posted a score of 18 positive, 13 negative and a single line at zero for the HY ETF (HYG). The other 6 bond ETFs were negative. HY OAS was below the 300 bps OAS line in late Feb before gapping out to +346 bps by the end of March and touching down at +277 bps to end last week, tighter from +286 bps the prior week.
Among notable winners on the week in the top quartile, we see energy ETFs move higher on energy price moves with the E&P ETF (XOP) at #1, Energy ETF (XLE) at #3, and Midstream (AMLP) at #4. The recovery in BDCs (BIZD) this week was tied primarily to disclosure details and more effort from leading private credit investors to calm nerves with disclosure during earnings season. Rounding out the top 5 was Regional Banks (KRE).
Rising mortgage rates and weak quarterly numbers and unimpressive guidance for the peak selling season ahead left Homebuilders (XHB) in last place for the week at -3.1%. Concerns around the UST curve linger with oil a critical variable in market pricing.
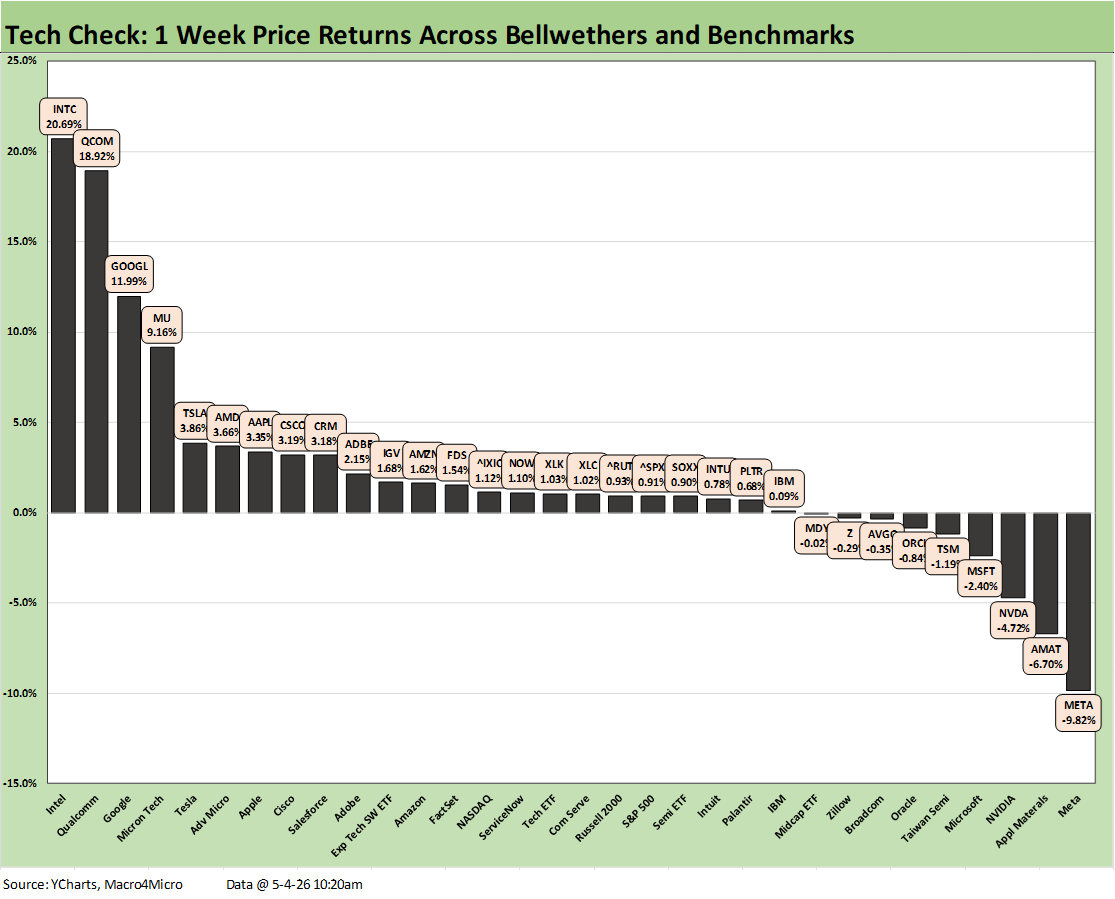
The Tech Check weekly numbers were coming off a very good run as we detail below in the April performance numbers. This latest week was mixed, however, with a score of 23-9 but with a more diverse mix of negative return lines in evidence by subsector. This week included more weakness from some major semiconductor-related names that included NVDA, AMAT, TSM, ORCL, and AVGO. We see 3 Mag 7 names in the red with META, NVDA, and MSFT along with the 3 names from the “Mag 7 + 3” with TSM, ORCL, and AVGO all in the bottom quartile in negative range.
The SaaS-heavy services names have been taking the beating as we have detailed along the way and in other charts herein, but only Zillow (Z) was in the red of that peer group this week. Most of the SaaS services names were positive and in the 2nd and 3rd quartiles this week.
For the top performers, we see Intel (INTL), Qualcomm (QCOM), and Micron (MU) in the top 4 joined by Advanced Micro (AMD) in the top quartile. Meanwhile, the Mag 7 shows Alphabet (GOOGL), Tesla (TLSA), and Apple (AAPL) in the top tier. The bottom tier includes 3 Mag 7 members with META, NVDA, and MSFT.
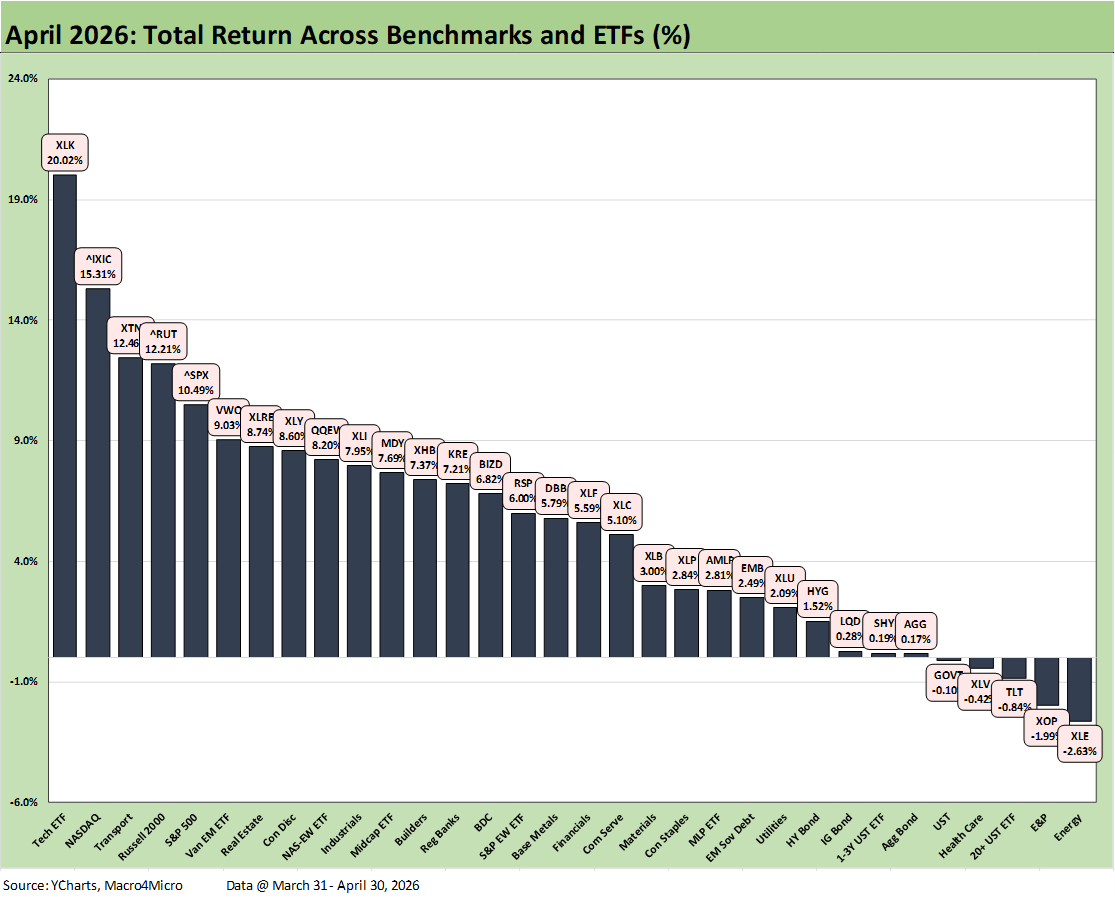
The above chart updates total returns of the calendar month of April (we skip Friday May 1) since this could be a month we are supposed to remember as the best month since the COVID year of 2020.
The comments below are essentially a cut-and-paste of our LinkedIn post on Saturday with some edits and additions:
After a March beatdown on the back of the Iran chaos, which brought a wide swath of negative returns in both debt and equities, April posted up the best single month since 2020 (per WSJ, since April 2020 and Nov 2020). The 27-5 positive vs. negative score below marks a dramatic swing from the rolling monthly returns we saw near the end of March (Friday 3-27 pricing). March was 3-29 with the only 3 positive being energy ETFs (XLE, XOP, AMLP).
The chart details the April total returns (through 4-30-26) for the 32 benchmarks and ETFs we monitor. We use the March 31 close as the starting point. April shaped up as a special month, so we thought it worth highlighting the calendar month returns rather than the usual Friday close numbers. We post a separate “Tech Check” collection using price returns.
The bullish tech mindset and a good earnings season has kept stock investors looking beyond the geopolitical chaos and erratic, inconsistent, and unpredictable policy “execution.” Valuations are looking past Iran and oil and are not discounting in setbacks in the consumer sector or in FOMC policy with the “new guy” on the block soon to settle in.
The PCE inflation numbers released for 1Q26 were flashing 4% handles for headline PCE (4.5%) and also for core PCE (4.3%), so this is about more than just oil stories and also about tariffs, supplier chain challenges ex-oil, and the flow-through effects of energy costs in so many different areas from raw materials to power to tech and household products. The March monthly PCE release also showed a sequential rise to 3.5% from 2.8% and core PCE to 3.2% from 3.0%.
The Hormuz supplier chain crisis unfolding across numerous major sectors gets a lot of headline time with fertilizer and fears around agricultural sector financial stress extending to fears of a global food crisis. Challenges to the tech sector also lurk, but Middle East anxiety clearly did not slow down the April boom in semiconductor tech equities.
The top quartile in the chart shows how tech flowed into the leaderboard with the Tech ETF (XLK) at #1 and NASDAQ at #2. The small cap Russell 2000 and S&P 500 also took a spot in the Top 5 with Midcaps the only broad benchmark in the second quartile.
We see 5 of 7 bond ETFs in the bottom quartile as the UST curve will keep wrestling with the setbacks in inflation and how that could flow into the UST curve. The new FOMC head (Warsh) is clearly seen as biased toward easing regardless of his spin during the confirmation process, but rising inflation alongside rising oil has a very challenged history across the decades. The stagflation of the Arab oil embargo in late 1973 and revisited in the Iranian oil crisis of 1979 was lived pain for many or textbook econ class lessons for others. There are some big moving parts to play out, and the political overtones are thickening the plot.
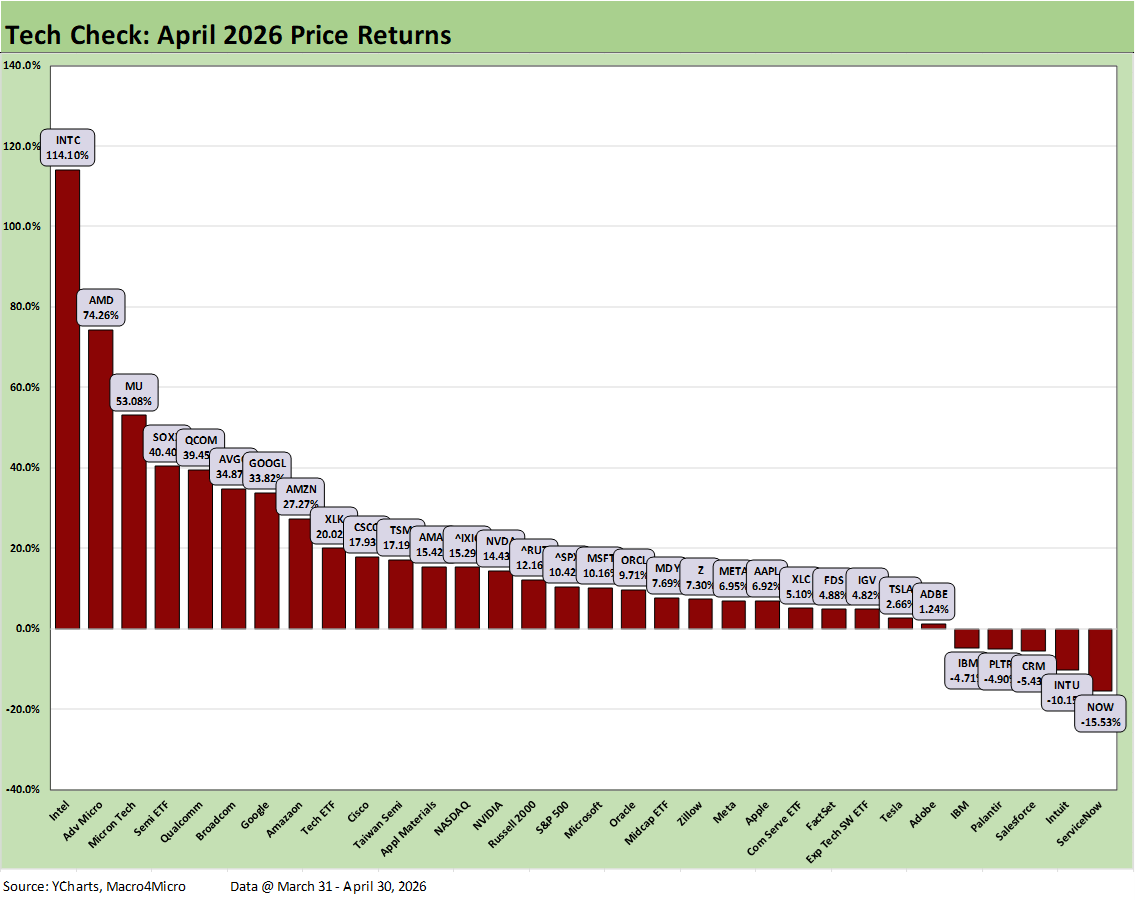
The above chart updates price returns of our Tech Check list for the calendar month of April (we skip Friday May 1). April 2026 could be a month we are supposed to remember as the best month since the COVID year of 2020.
The comments below are essentially a cut-and-paste of our LinkedIn post on Saturday with some edits and additions:
The Tech Check chart for the month of April flips the script on the ugly returns seen in March (rolling 30 days 3-27-26) when the positive vs. negative score was 4-28 with the broad benchmarks and the Mag 7 all in the red. For April, we see the Mag 7 and the Mag 7+3 all positive but with the Mag 7 spread around all 4 quartiles with Alphabet (GOOGL) and Amazon (AMZN) in the top quartile and Tesla (TSLA) in the bottom.
The fears of discount rate penalties related to UST curve shifts and cyclical end market weakness from Iran-related shocks seemed to quickly fade from view with investors doing the “forward-looking thing” and pricing in limited downside for semiconductors. The top 5 names for the month racked up some dazzling numbers with Intel (INTC) in a different zip code. INTC posted 114% at #1 with #5 Qualcomm at 39.5% for a single month. We see #10 Cisco (CSCO) at 17.9% and #14 NVIDIA (NVDA) at 14.4%.
The score for April of 27-5 shows the small subset of negative returns mostly comprised of the SaaS-heavy names that have been battered by AI displacement fears around business model viability. IBM is a unique multi-business tech bellwether, but IBM’s post-earnings beatdown was generally attributed to that same AI-based anxiety.
The SaaS-based operators and software names keep taking a beating with ServiceNow (NOW) on the bottom at -15.5% joined in negative range by Intuit (INTU), Salesforce (CRM), Palantir (PLTR) and IBM. The Semiconductor ETF (SOXX) at 40.4% vs. the Software ETF (IGV) at +4.8% in the bottom quartile shows a return differential of almost 36 points. The median for the 32 asset lines for the month was over 10%. That was quite a performance in the peer group. This market is a stock picker’s curse or delight.
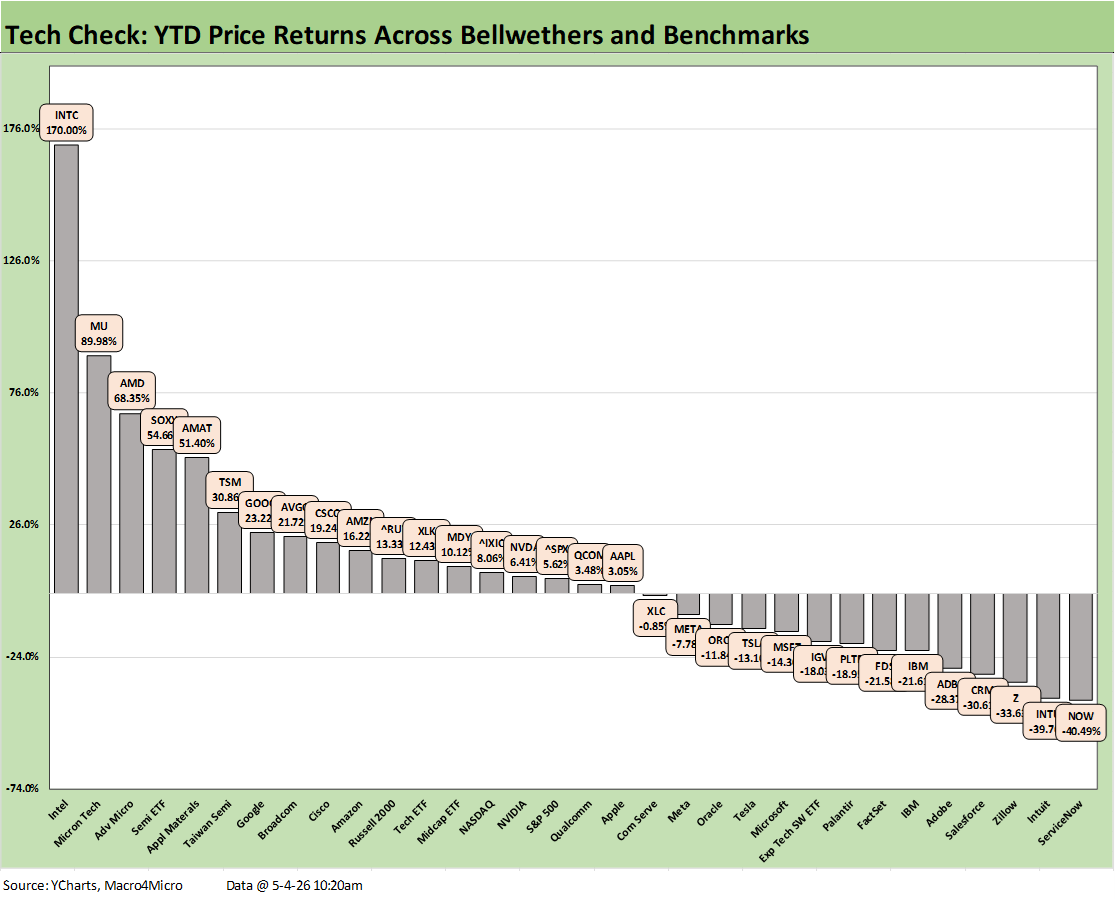
We update the YTD Tech Check group above with a positive negative score of 18-14. The top quartile mix shows 7 of the 8 in the semis sector joined by Alphabet at #7. Making the top quartile required a price return of over 21.7%, so that is quite a performance across just over 4 months.
As we have shown in recent commentaries, the bottom quartile in the red is all about SaaS-based services companies and software. The bottom quartile begins with Palantir (PLTR) at -18.9% and finished with ServiceNow (NOW) in last place at -40.5%. With Intel at #1 at +170%, that is a shocking Hi-Lo range of around 210%. Throwing out the Hi and Lo, we still see a return differential of 130 points for Micron vs. Intuit.
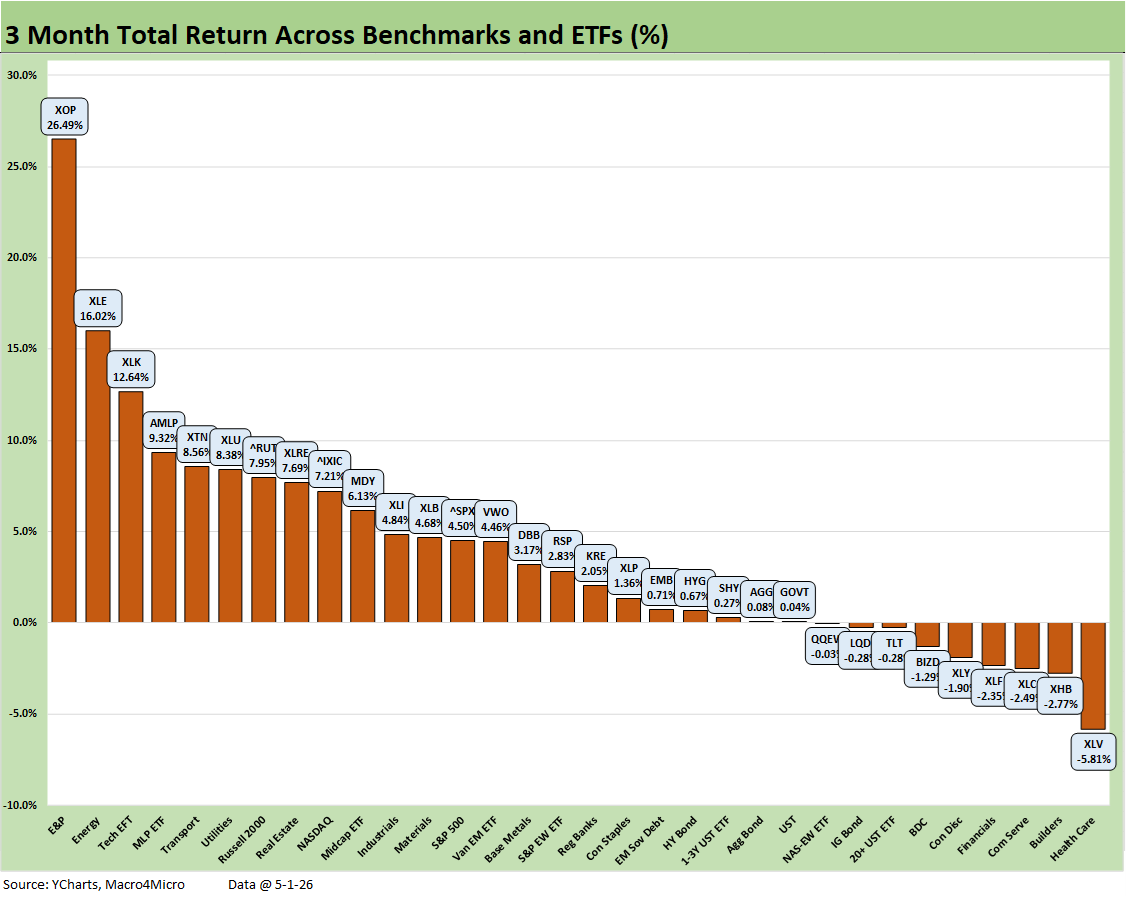
The 3-month returns show energy ETFs (XOP, XLE) well ahead with the Tech ETF (XLK) a solid #3 with Midstream Energy (AMLP) at #4, and Transports (XTN) at #5 on a wild ride. The bottom tier is diverse but has a common feature in more than half the mix of interest rate sensitivity. Homebuilders (XHB), the long duration UST ETF (TLT), and longer duration IG Corp ETF (LQD) were hit, and we see Financials and BDCs facing some questions around the direction of funding costs or asset quality (or both).
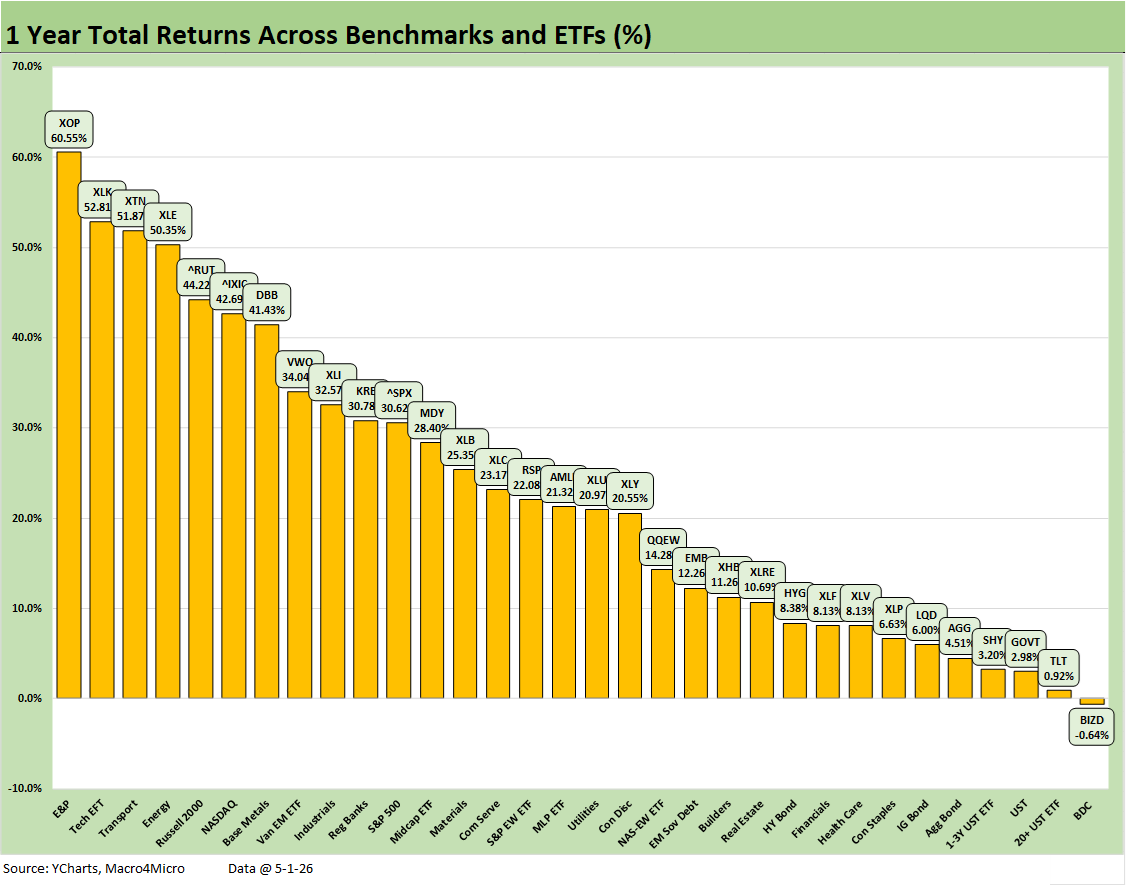
The trailing 1-year returns offer a story of a strong 2025-2026 stretch. The median across the 32 lines is around 21%, and that is a very good run at around 2x the long-term return on the equity asset class. We see #1 with the E&P ETF (XOP) at 60.5% with much of that recently generated. Making the top quartile required a minimum of 34%. The Tech ETF (XLK) rang up +52.8%.
The Russell 2000 small caps wins the benchmark crown at +44.2% just ahead of the NASDAQ at 42.7%. The S&P 500 was down in the second quartile at +30.6% with Midcaps a few notches behind at +28.4%.
We see 5 of 7 bond ETFs in the bottom quartile with the long duration UST ETF (TLT) in second to last and less than 1% total return. We see EM sovereigns ETF (EMB) at 12.2% and the HY ETF (HYG) at 8.4%. That implies credit risk was rewarded more than duration.
The bottom quartile was 8.1% and below with BIZD at -0.64% in last place - not as ugly as feared - with many holding the line and clipping high cash dividends to ease the price pain.
See also:
PCE Inflation, Income & Outlays March 2026: Inflation Anxiety Level? 5-3-26
1Q26 GDP Advance Estimate: Consumer Fade, Investment Boom 4-30-26
Market Commentary: Asset Returns 4-26-26
Synchrony Financial: Favorable Consumer Credit Signals 4-24-26
Industrial Production March 2026: Mixed Picture, Big Questions Ahead 4-16-26
Existing Home Sales March 2026: New Beginnings or New Ends? 4-15-26
Producer Price Index March 2026: Heater or Curve Ball? 4-14-26
CPI March 2026: The CPI Cycle Could Prove Maddening 4-12-26
4Q25 GDP: More Adverse Revisions in the Golden Year 4-9-26
The US as an Aspiring Emerging Market: Fiscal SNAFU, Political FUBAR 4-6-26
Employment Situation March 2026 4-4-26
Payroll Focus: ADP Highlights March 2026 4-1-26
JOLTS Feb 2026: Openings Down, Hires Down, Layoffs Up 3-31-26
UST Deltas: Elevation Realities 3-29-26
Market Lookback: Confusion Reigns, Dislocation Pours 3-22-26
New Homes Sales Jan 2026: The Nays Carry 3-19-26
Market Lookback: The Gulf of Cause and Effect 3-15-26
Housing Starts Jan 2026: Total Starts Up, Completions Up, Permits Down 3-12-26