
New Homes Sales Jan 2026: The Nays Carry
New home sales news was bad to start off 2026 as the Census data process starts to catch up.


High and dry. Looking for some traffic.
Weak new homes sales in total and across all regions MoM add to the poor macro themes that come with Iran fallout, tariff noise, recent upward pressure on mortgage rates, a weak 4Q25 GDP report (negative residential investment) and the realities of a wide range of potential outcomes that can curb confidence and promote big ticket defensiveness on the part of potential homebuyers.
Supplier chain disruptions will raise costs for builders and are set against a backdrop that is more likely to pressure mortgage rates higher with the 10Y UST stubborn and the FOMC easing odds shifting toward no fed cuts. As of now (3-19-26), the odds are materially against any FOMC cuts for the remainder of the Fed meetings in 2026. That is quite a swing.
New home sales saw Average selling prices down sequentially to $400.5K, which is the lowest since July and down YoY from $429.6K. Inventories were flat MoM on a “not seasonally adjusted” basis and ticked slightly higher MoM on a SAAR basis. Inventory mix shows “homes under construction” substantially lower YoY and “completed home” inventory higher YoY.
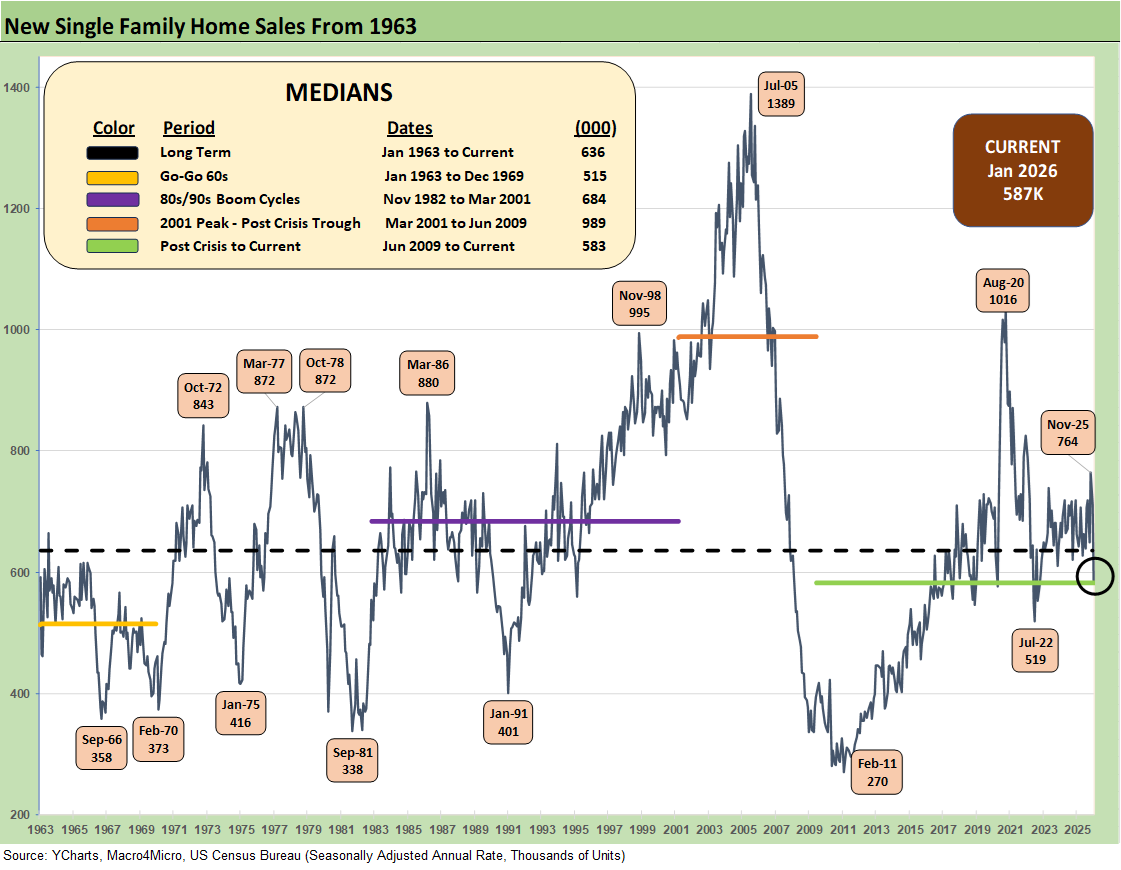
The above chart updates the new single family home sales time series from 1963, and the current 587K (SAAR) is a grim number in the context of 2025 as well as long-term medians. That is especially the case in light of record demographic need. The shortfall in supply of affordable housing is a recurring theme even if favorable housing demand profiles are still a secular trend.
The policy responses from Democrats and now the GOP have been and remain completely inadequate. In fact, the latest proposals are bad for homebuilder costs (tariffs and labor migration/deportation), have kept mortgages higher (massive deficits), and temper consumer risk-taking (Iran effects). The proposed policy restrictions in legislation on build-to-rent misses the point on housing needs and ignores the immediacy of the supply limits for a house to live in (rent or own) and the consumer choice issues. Supply of housing stock is supposed to be the priority, but the political scramble is to do “anything.” That is a topic for another day.
As we look back to the peak of the housing bubble, we see 1389K in July 2005 or 2.4x the Jan 2026 volume. The COVID panic buying and relocation spree in Aug 2020 of 1016K was a wild period for new home sales and home starts in a ZIRP market with very low mortgage rates. For Jan 2026, the 587K is weaker than any 2025 numbers with the next lowest over the LTM period at 627K in May 2025.
The sequential move lower of -17.6% for total sales was ugly. We saw all 4 regions with negative MoM variances with the #1 South region at -8.1% MoM and -8.8% YoY while the West as the #2 market posted a sequential decrease of -21.6% MoM and -28.7% YoY. The Midwest posted a brutal -33.9% MoM but a solid +18.0% YoY. The tiny Northeast market was -44.7% MoM and flat at 0% YoY.
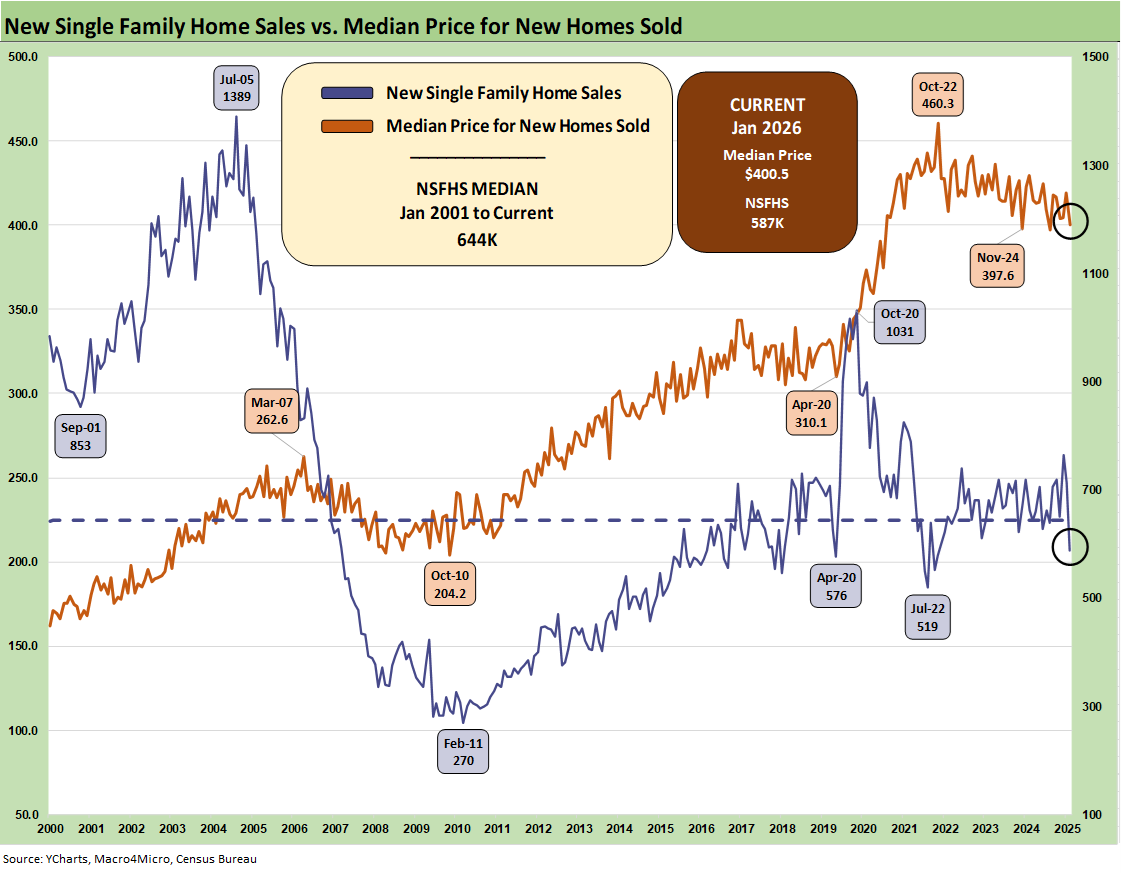
The above two-sided chart shows the sales pattern for the new home sales line since 2000 vs. the median prices, which weighed in at $400.5K for Jan 2026, above the $397.3K low in July 2025 but down from $419.2K in Dec 2025.
The fact that home prices had trended materially higher across the post-COVID cycle is old news, but the sensitivity of monthly payments is married more to mortgage rates as a critical variable in monthly payments. This current softening of prices does not fix the problem with rates rising and existing home sales supply weak overall given the mortgage refi barriers and how that flows into total supply options (see Existing Home Sales Feb 2026 3-10-26).
Mortgages have been stubbornly high but saw some very brief relief with the Freddie Mac 30Y moving into the 5% range before the recent sharp reversal. Mortgage rates remain the primary driver of weaker volumes in the lower price tiers in both new and existing home sales. A wildcard as we move into 2026 will be homebuyer confidence and cyclical consumer sentiment around “pulling the trigger” while seeing such material uncertainties (Iran war, tariffs, payroll anxiety) as we roll into the peak home selling season.
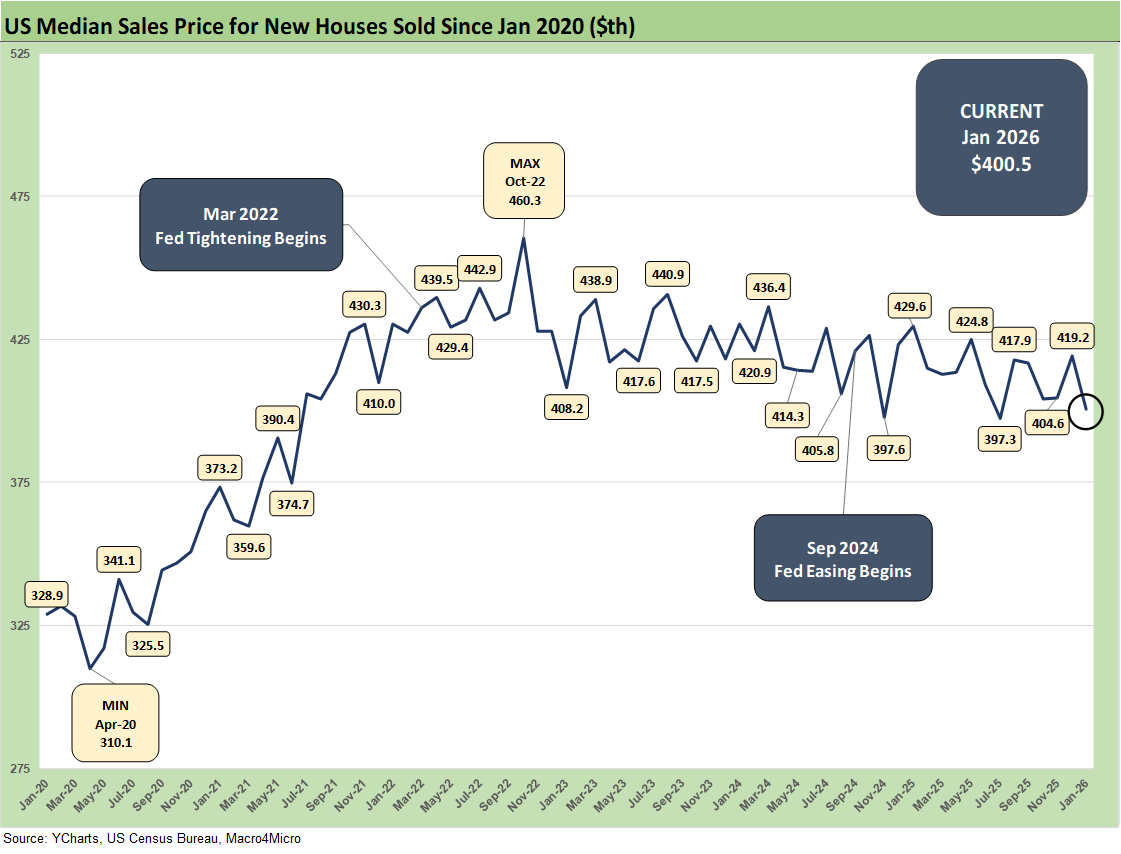
The above chart updates the running median price trends. Builder fears of higher material and supplier chain costs and now the Iran fallout will keep homebuilders defensive in their pricing strategies. Gross margins were softening in 2025 and will continue to soften into 2026. Many are posting margins still above pre-COVID levels even if down sharply from abnormal margin peaks in 2022. The trend line remains negative.
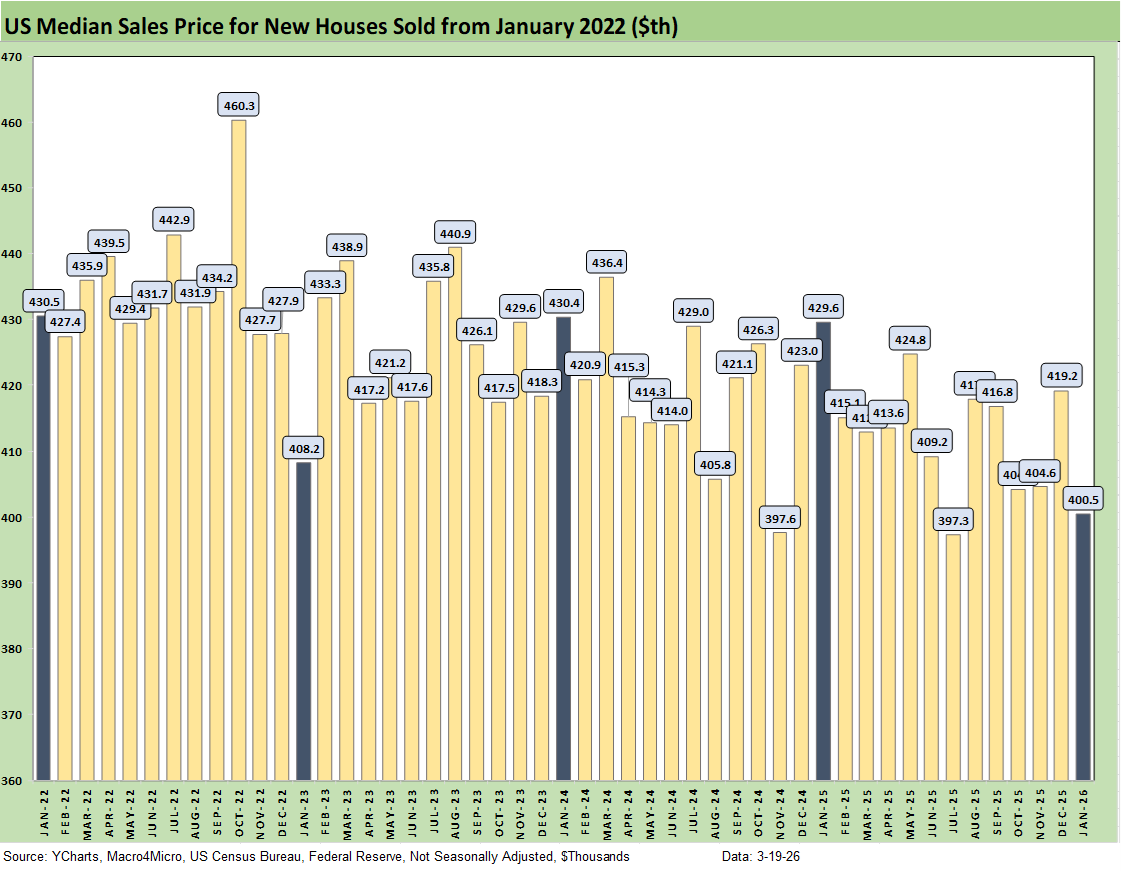
The above chart gives a different visual angle on the median new home sales prices from early 2022. That is a lot of $400K handles with some sub-$400K outliers. The current $400.5K can shift with regional mix as well as home price tiers and related supply issues. The affordability question is still intertwined with the monthly payment pressures from mortgages. It is about more than price.
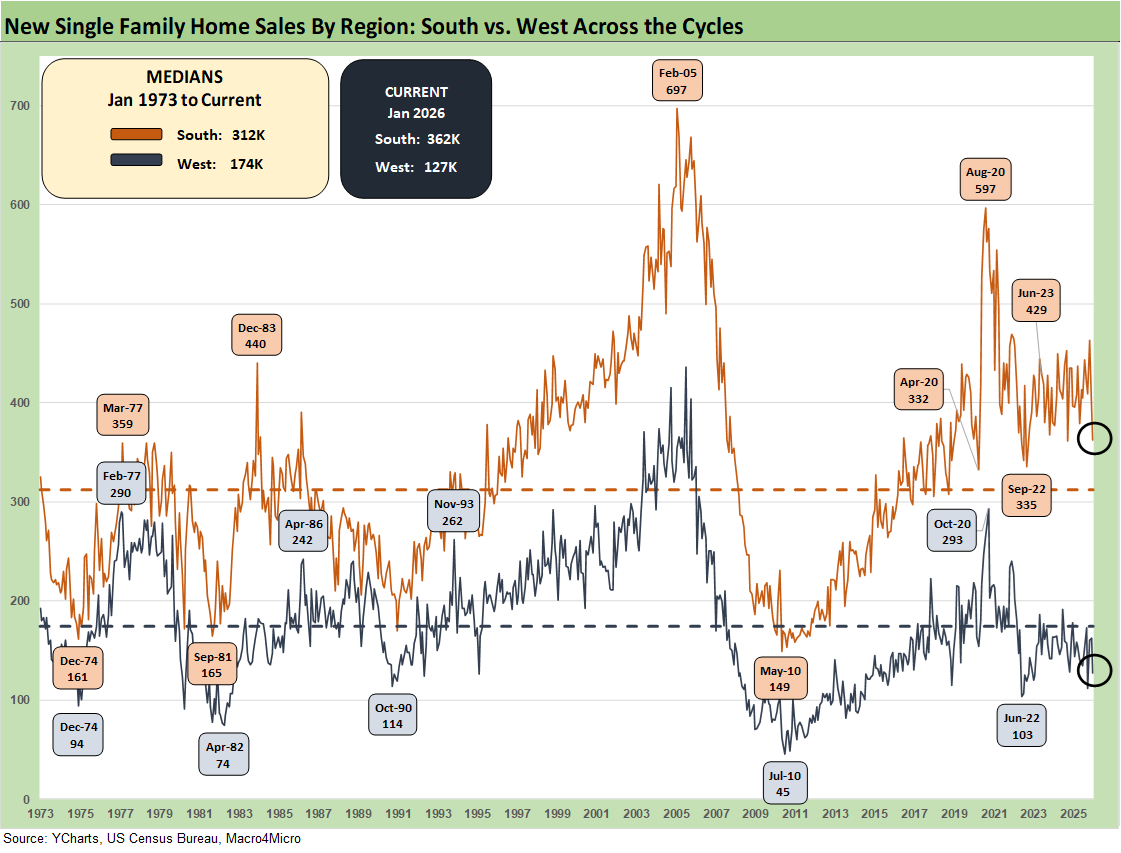
The time series above updates the new single family home sales across the cycles since 1973 for the #1 and #2 regions of the South and the West. These two regions are around 84% of total single family home sales volumes for Jan 2026.
As noted earlier, the 362K for the South in Jan 2026 posted a sequential decline of -8.1% from Dec 2025 and is down by -8.8% YoY. The West at 127 is 22% of the total volumes vs. 62% for the South. For the month, the West was -21.6% sequentially and -28.7% YoY.
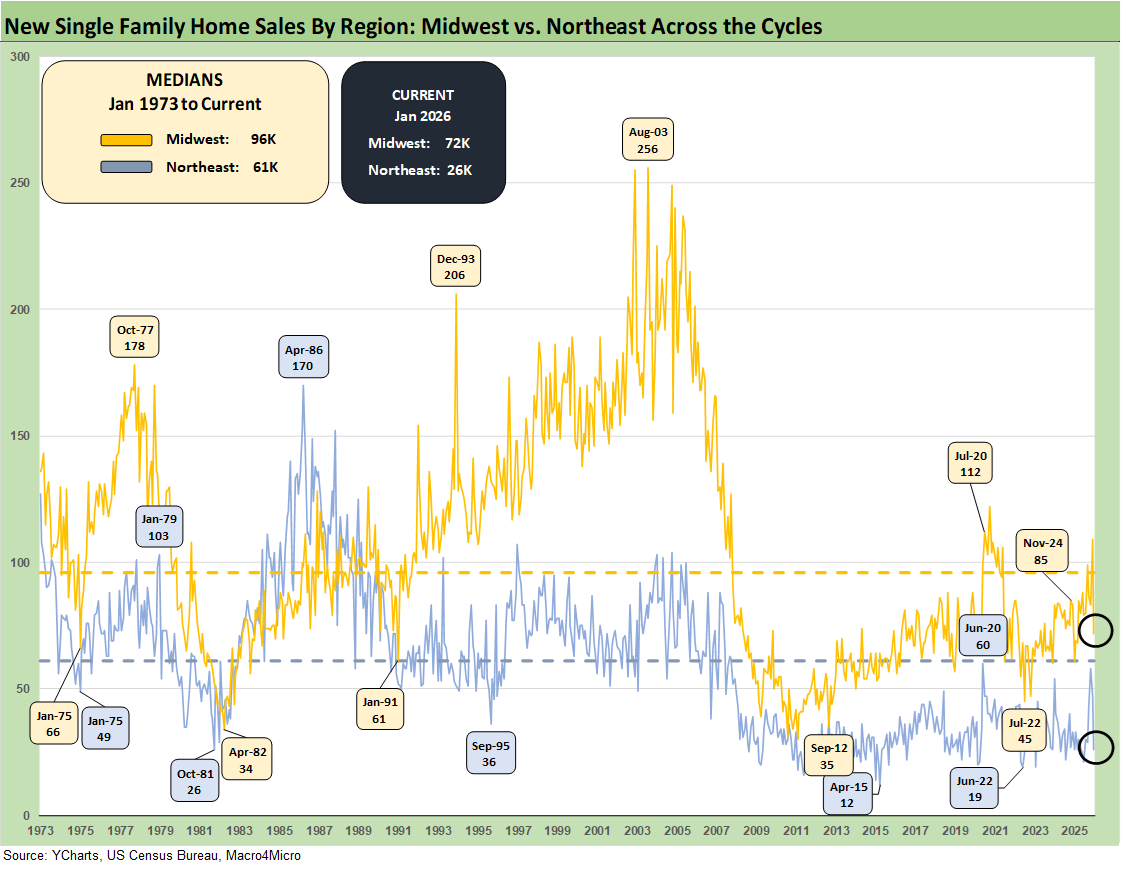
The smaller Midwest region and tiny Northeast region account for 12% and 4%, respectively, of new home sales in Jan 2026. The Midwest was down by -33.9% MoM but +18.0% YoY. The Northeast was -44.7% MoM and a flat 0% YoY.
See also:
Producer Price Index Feb 2026: Getting Warmer 3-18-26
Industrial Production Feb 2026: Capacity Utilization 3-16-26
Market Lookback: The Gulf of Cause and Effect 3-15-26
Market Commentary: Asset Returns 3-15-26
PCE Inflation Jan 2026: Personal Income & Outlays 3-13-26
GDP 4Q25 Second Estimate: Sharp Move Lower 3-13-26
Housing Starts Jan 2026: Total Starts Up, Completions Up, Permits Down 3-12-26
CPI Feb 2026: It’s Making You Wait… 3-12-26
Existing Home Sales Feb 2026 3-10-26
Market Commentary: Asset Returns 3-8-26
Payrolls Feb 2026: Into the Weeds 3-8-26
Employment Situation Feb 2026: Payrolls Get Ugly 3-8-26
VIX: Market Still Not Getting the Vapors 3-6-26