
Market Lookback: Confusion Reigns, Dislocation Pours 3-22-26
Iran War fallout flows into radically reworked FedWatch odds, adverse UST deltas, and FOMC SEP medians that will be ignored.


All I said was “We don’t use the Strait.”
The “we don’t use the Strait” line is on a very long list of statements that Trump’s own terminology would qualify as “low IQ and stupid.” A globally connected market is a reality whether with or without tariffs. The Strait is a crucial factor for all major US trading partners. Under the Powell “you break it, you own it” rule, the Iran War and energy fallout is another case of “the buck stops everywhere else.”
The game of framing secondary and tertiary multiplier effects of policy actions has never been a strength of Team Trump or the economic mouthpiece echo chamber at the White House (think “seller pays the tariffs”). Hasset saying the economy would not be affected but “the consumer might be” was a new low. National Retail Gasoline hit $3.94 per gallon (3-22-26, Source: AAA) and is up 35% in a month. Diesel, which is literally a key driver of freight costs, rose to $ 5.25 or +41% higher in one month.
The energy market chaos is now juxtaposed against the material tech valuation uncertainty that has spilled over from AI. Inflation worries are heightened. The FOMC outlook is now posting odds that favor “no easing” for the remainder of 2026. We even see rising tightening odds. Trump can’t blame Powell or Biden for this one (but he will). Higher short rates or any bear steepener of the UST curve undermines sea level economics (demand, unit costs, working capital, durable goods financing, and more), hurts valuation of growth equities, and falls directly on the housing sector via mortgage rates. The Mortgage News Daily survey ended Friday at 6.53%.
The Fed meeting gave the impression that the SEP report and dot plot should be discounted. The SEP report saw mixed adjustments to the overall 2026 expectations given the array of highly uncertain variables. Even Powell essentially said (our paraphrase): “If you were going to skip a SEP report, this would be the one.” We revisit the overall flavor of FOMC updates and the dot plot further below.
The geopolitical policy incoherence on the Iran War game plan dictates energy market handicapping (escalation risk by US, duration of Hormuz closing, damage to infrastructure now or potentially coming, Gulf nation planning for their operations). The discussion of how to frame inflation fallout is complex, but monetary policy predictions lean toward “do nothing for a while.” That is what the market is signaling. The consumer reactions and corporate budgeting plans in turn will set the bar for the cyclical outlook with the consumer (PCE) at 68% of GDP and small business the key driver of payroll. Fixed investment plans (capex) could shift along the GDP line mix.
The global nature of oil and gas supply/demand imbalances means global cost trends and supplier chains face turmoil regardless of the US being a major oil exporter. The US energy players will mint cash flow. So will the Canadian oil sands. On the other hand, the semiconductor chain (helium has been a hot topic), pharma ingredients (downstream derivatives), the fertilizer chain, and myriad unit cost pressures along the supplier-to-OEM chain will be headwinds. Cyclical end market demand comes into play as moving parts across US export demand and US import pricing. Data centers will face new challenges in costs and project economics. That gets back into the AI longer term valuations.
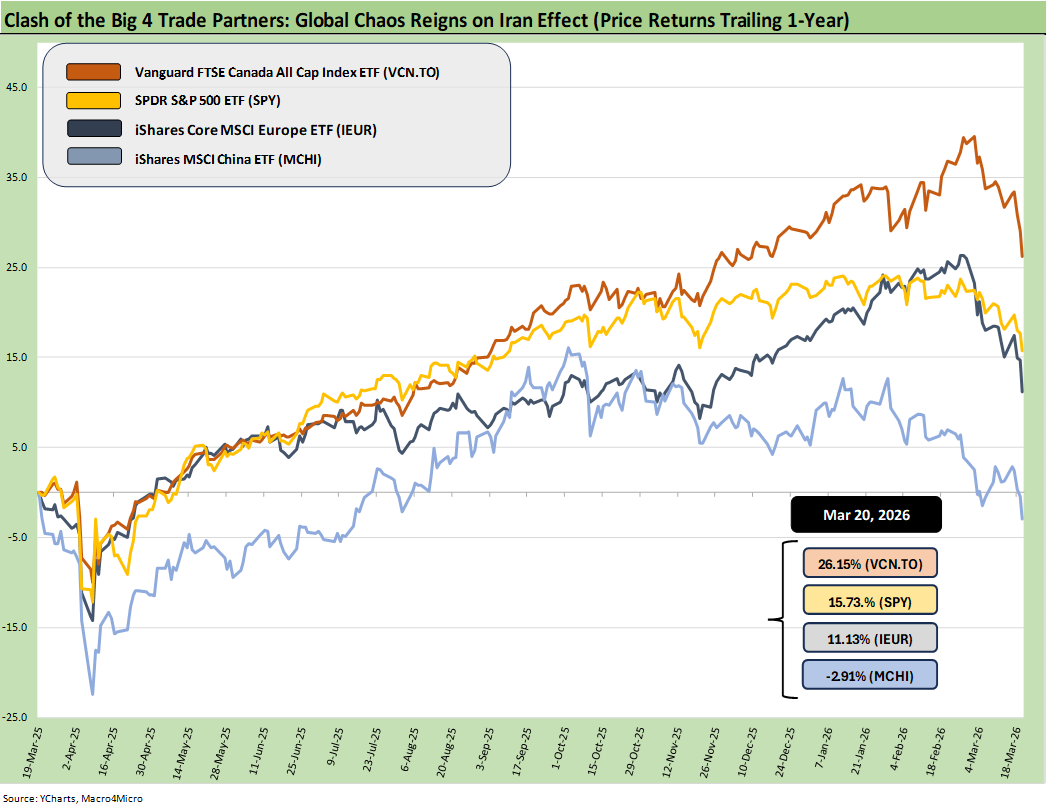
The above chart updates the equity market fallout across some of the major trade partners using benchmark indexes. We detail US, Europe, China, and Canada above. The returns on such ETFs reflect the effects of Iran, and it is not pretty. We have commented on these time series frequently. The US had been lagging in last place through much of 2025 on weak currency trends. That has now shifted as everyone tanks.
What we see since the Iran War started is that the US has moved up to #2 behind Canada but everyone has faded sharply. The Iran fallout hits everyone even if you don’t – in Trumps words – “use the Strait.” For the record, that statement is factually incorrect since the Strait “supplies the suppliers” with Europe, China, Taiwan (and more) very much influenced directly by the Strait. Similarly, the tech sector has been getting analyzed by industry experts on how the supplies out of the Gulf region are critical drivers of tech activity in Taiwan and South Korea, who are both selling critical tech goods to the US. That certainly matters to the US. So does the fertilizer cost issues in the ag sector.
FOMC update: small moves, big questions
The FOMC is not getting the focus it was getting in 2025, with minimal expectations of near-term action priced into the market. For a quick summary of the SEP moving parts, we line up a few points below for those who took Powell’s unspoken (sort of) advice to discount current forecasts in light of the magnitude of the risks and moving target variables:
Dot Plot: The score was 7 of 19 votes calling for no change in 2026 and 7 calling for 1 cut as “appropriate.” There were 2 dots calling for 2 cuts, 2 votes for 3 cuts and 1 calling for 4 cuts. The 4 cuts would be in the 2.5% to 2.75% range. As of now, Trump has been demanding a negative real fed funds rate.
GDP Growth: The median ticked higher to 2.4% in March from 2.3% in the December meeting, so it is better than what we saw in 2025 after the weak 4Q25 numbers (see GDP 4Q25 Second Estimate: Sharp Move Lower 3-13-26). The 2% handle GDP growth is standard mediocrity in the new millennium. As a reminder, annual GDP growth was 2.1% in calendar 2025 vs. 2.8% in 2024 (just don’t tell Hassett).
PCE inflation: The headline PCE inflation median ticked up to 2.7% for 2026 from the 2.4% in December 2025. The energy cost and tariff cost estimates require a Ouija board at this point to commune with dead doves and stuffed hawks. Payroll will be the swing factor but with the first stagflation threat since the Volcker years.
Core PCE inflation: The Core PCE median rose to 2.7% in March from 2.5% in Dec 2025. That is still well above target, and that might be one reason why we saw a single hike cited as appropriate on the dot plot in 2027 (none for 2026). Odds of hikes in 2026 are rising on FedWatch.
Fed funds rate: the median projected fed funds rate for 2026 was 3.4% again in March or the same as in the December meeting.
The “Summary of Economic Projections” (“SEP report”) did not seem to have much impact at all with the Iran War ramping up, Trump raging, energy costs soaring with supply shrinking, and macro variables moving. The fact that the FedWatch odds have shifted so dramatically across the week was troubling and we just saw a whole new set of numbers roll into the FedWatch site today (Sunday).
If we use the Oct 2026 Fed meeting as an example of shifting odds, the volatility of these odds are picking up. We had been updating the odds this weekend and this morning before we looked back at the data, and it has been radically overhauled on the FedWatch site. That tells a story of the rate uncertainty.
The odds of no action in Oct 2026 was 92.0% to end the week. Those just shifted today to 59% odds of unchanged. Now the odds of one rate hike are at 29.2%. One week ago, the odds of a rate hike in Oct was 0%. That is a major shift in the numbers updated as of today. Last week, the odds of a cut by Oct 2026 was 50%. The odds of a single cut in Oct 2026 are now down to 6%. Two hikes is now at 5.4%.
Handicapping how the slope of the UST curve will shift in longer maturity segments of the yield curve has been a major wildcard since the easing cycle began back in Sept 2024. The bear steepener that unfolded after the initial bull flattener in fall 2024 and into 2025 has been tough to shake (see The Curve 12-15-25). We could see a growing worry over an upward UST curve shift.
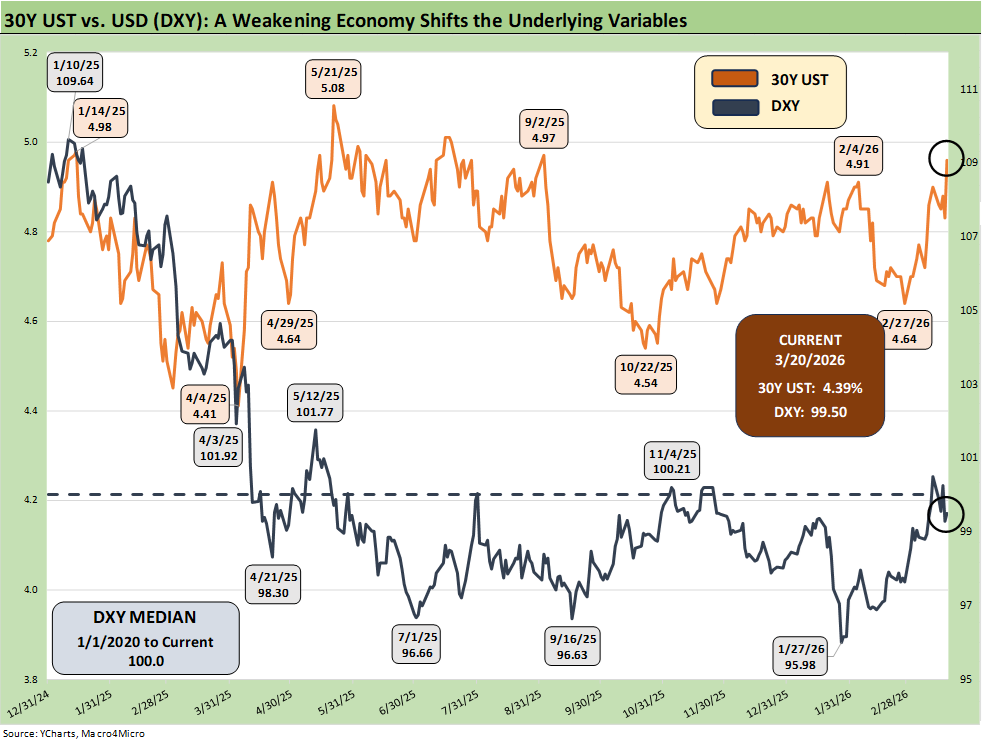
The above chart updates the DXY trend line showing the recovery of the dollar since the Iran War kicked into high gear. We track that against the 30Y UST. The good news is that the currency risk might now be down the list for international investors. The flip side is the international investors can worry about US inflation, rising rates, and an ungodly increase in UST supply to fund much higher deficits.
“War is hell” is an old one even if Hegseth fails to footnote Sherman (we suspect Hegseth might have desired a different outcome than Sherman. Too DEI.). “War is expensive” also. We will see if any “Supplemental” bill to fund the Iran War expenses (headlines signal $200 bn) will include revenue proposals (aka taxes). Another theory is that the supplemental will be rolled into the $1.5 trillion defense ask for the 2027 budget, or essentially a 50% increase talking point even before the Iran War activity.
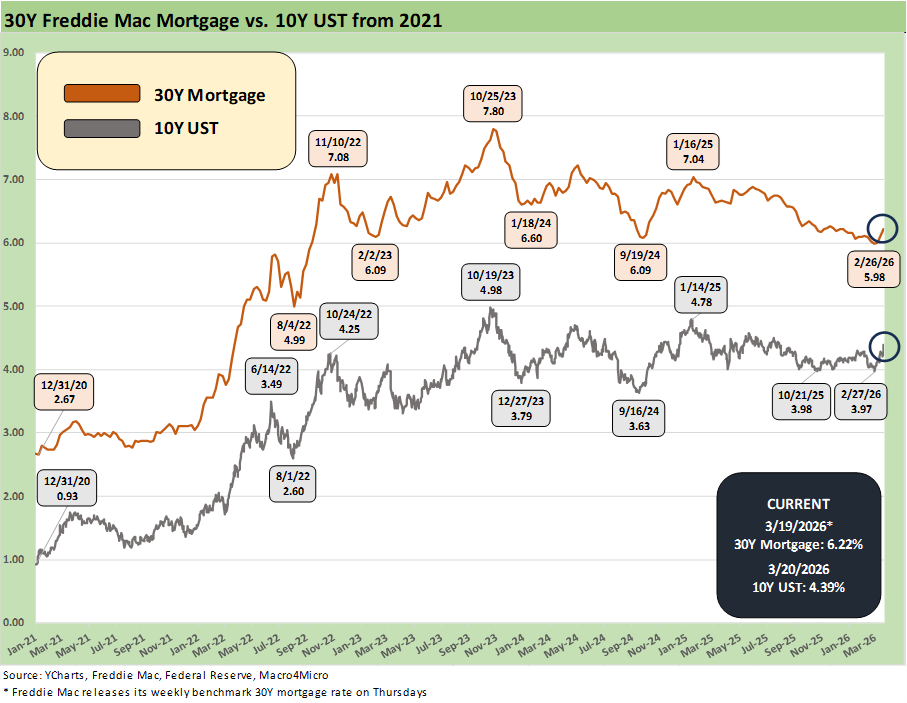
The time series updates the 30Y Freddie Mac mortgage benchmark (set each Thursday), and we see 6.22% or around 30 bps below where the Mortgage News Daily survey closed Friday (6.53%).
As housing support legislation gets debated, any potential benefit gets wiped away by Iran War effects as mortgage rates rise. This rate pressure can hit new home sales (see New Homes Sales Jan 2026: The Nays Carry 3-19-26, Housing Starts Jan 2026: Total Starts Up, Completions Up, Permits Down 3-12-26) as well as existing home sales (see Existing Home Sales Feb 2026 3-10-26).
The golden handcuffs in existing sales just got tighter on refinancing costs from the heavy mix of 3% and 4% mortgages held by potential sellers.
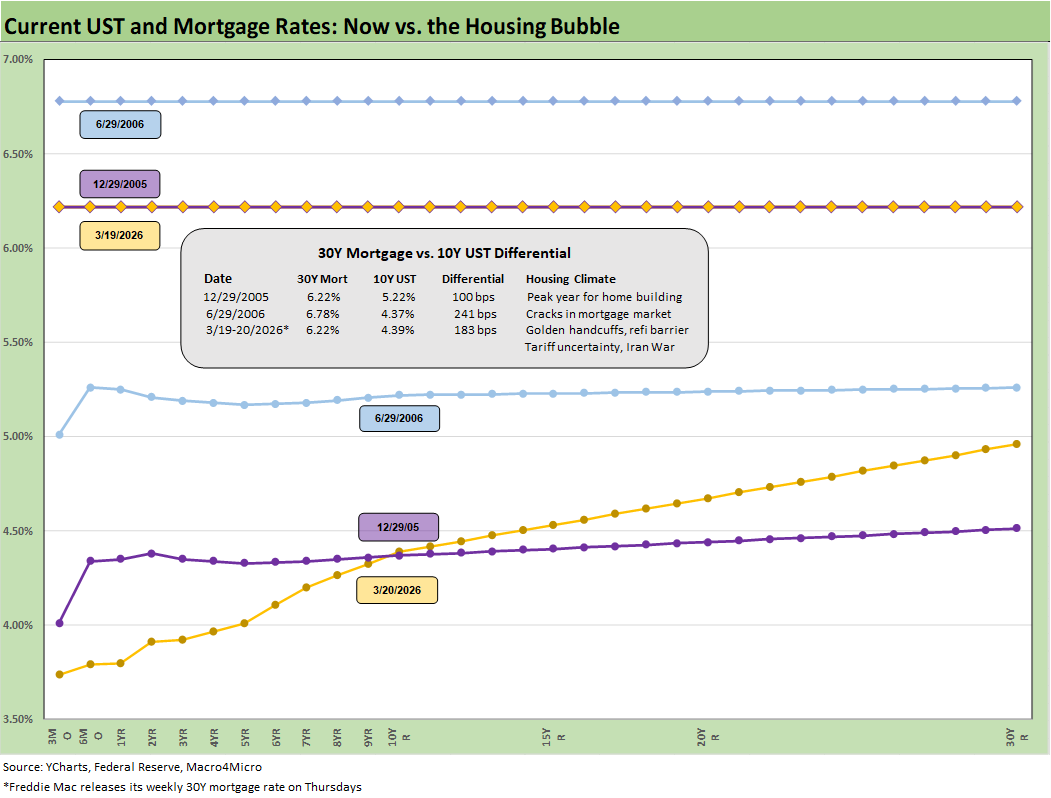
The above chart frames the current UST yield curve and Freddie Mac benchmark (horizontal line). The current 6.22% Freddie Mac 30Y is flat with the rate posted at the end of 2005, which was the peak homebuilding year of the housing bubble. We also break out the differential of the Freddie 30Y mortgage vs. the 10Y UST. The current differential is moving closer to the mid-range between the bubble period of 2005 and 2006 when a growing share of RMBS quality was getting “found out” as very high risk in the structured credit boom.
The yield curve now also presents a very different slope than what the market saw in 2005 and 2006. That period saw flat yield curves and an upward shift from 2005 to 2006. The rule of thumb is that flat signals peak or possible recession risks. The other rule of thumb is that stagflation risk throws a lot of rules out the window.
We know what came after that 2006 period as the credit markets melted down in 2008 after freezing in the summer of 2007. The fact that the S&P 500 kept on rising to highs well into Oct 2007 despite the credit market pain is worth remembering.
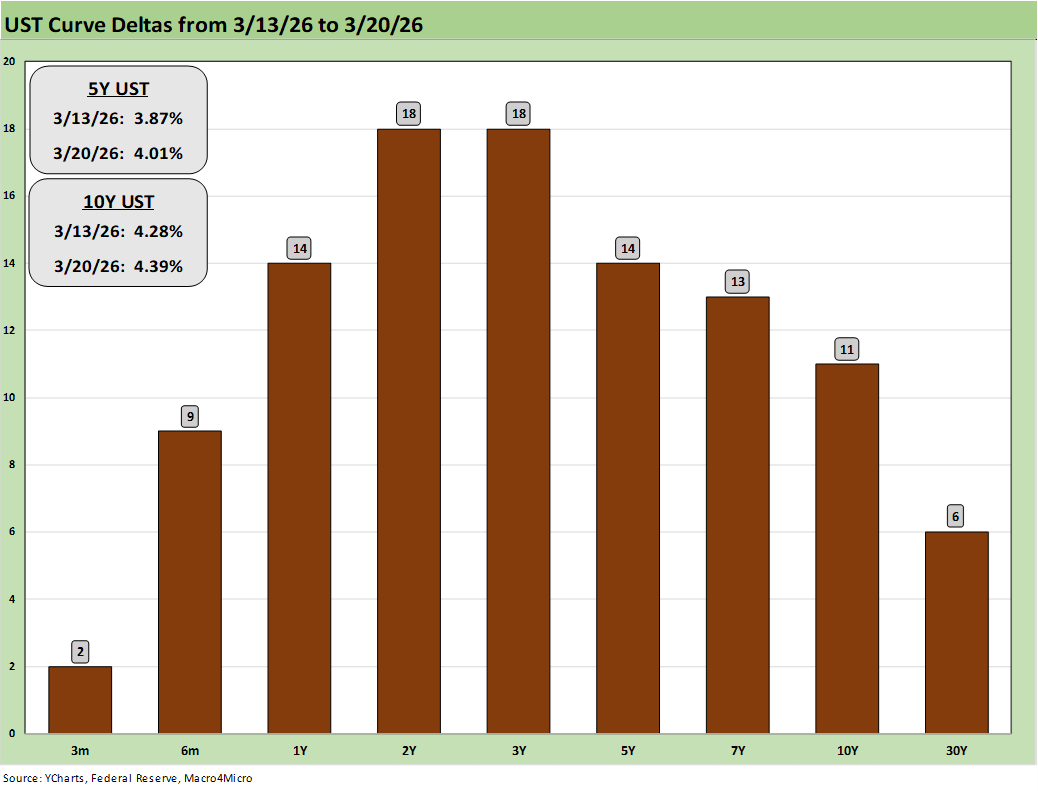
The above breaks out the UST deltas for the past week in what was a bad news week for the yield curve. As we cover in a separate chart set, all the bond ETFs were negative in what was even a worse week for equities.
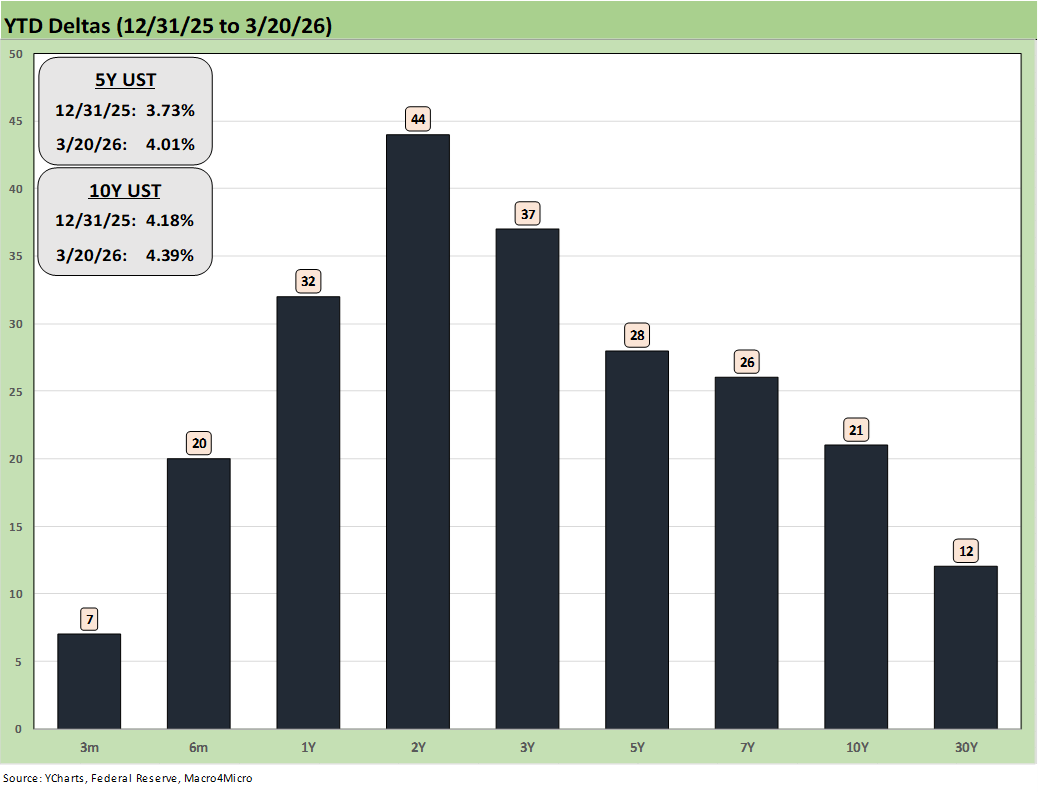
The above chart updates the running YTD UST yield curve deltas. The +44 bps on the 2Y UST reflects serious doubt on FOMC easing unless Trump can get Pirro to investigate the entire FOMC. We assume “Judge Jeanine” is still trying to get through Monetary Policy for Dummies. Alternatively, Trump can have Markwayne Mullin threaten to beat up Warsh and any other takers.
As we cover below, there is ample room for the 3M to 10Y slope to steepen based on historical medians. The energy and tariff pain adds to the strain on global “alliances” and potential UST demand challenge (as in ongoing insults and alienation do not promote UST exposure). We also will face a lot more trade clashes in 2026 on Trump tariff action. The record US deficits and funding needs make for a strain on bull flattening optimism if allies start to dial back UST holdings. Stagflation as a threat complicates the journey to a flattening outcome.
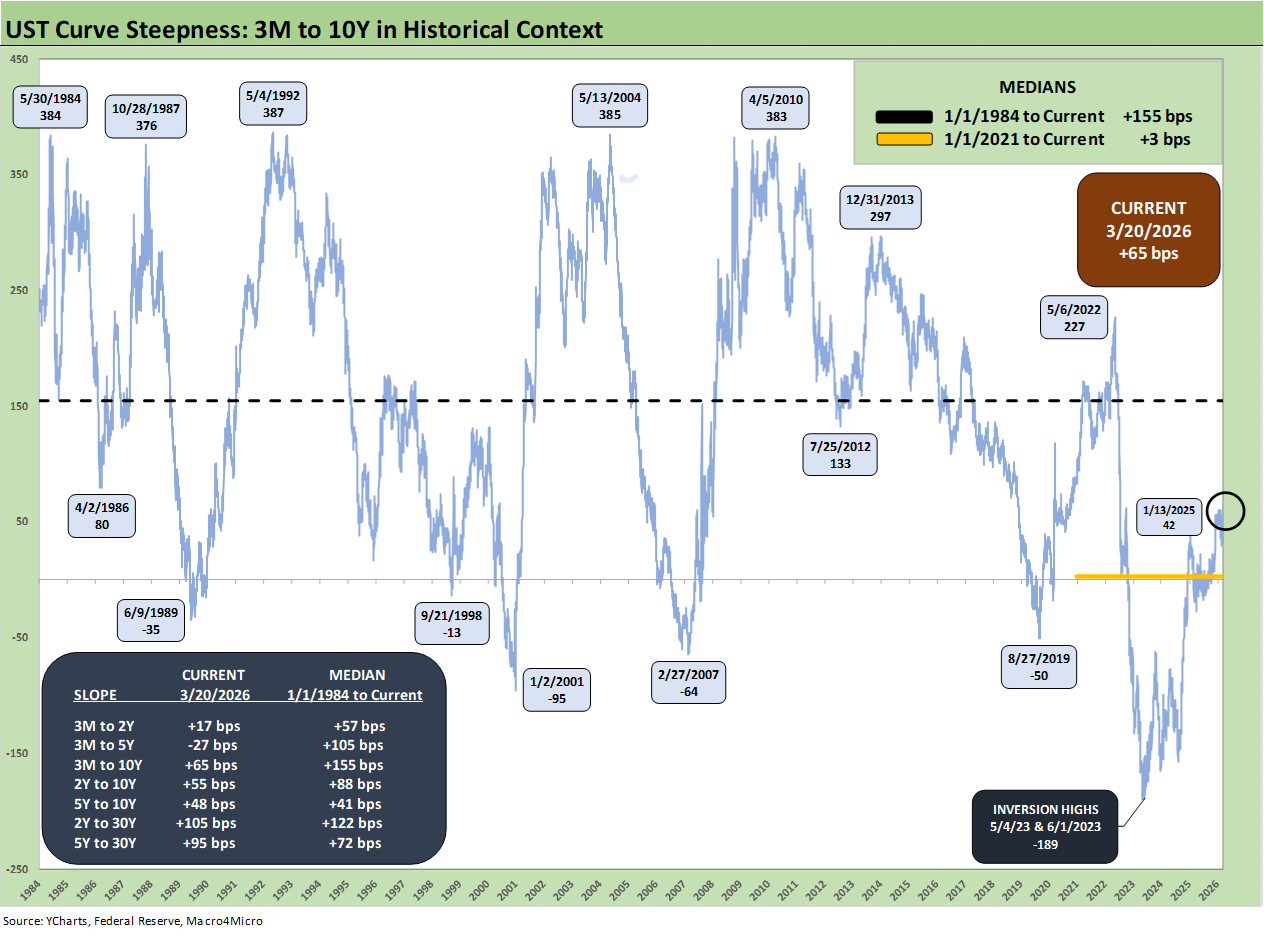
The above chart updates the 3M to 10Y slope since 1984. As a reminder, we chose 1984 as a starting point to isolate the distorting visual effects of the record steepening and inversions of the 1980-1982 stagflation double dip. That period saw Volcker prevail in the war on inflation (CPI 1% handle reached by1986).
We detail the UST segment slopes in the box with current levels and long-term medians. The lack of confidence in FOMC cuts during 2026 leaves the shapeshifting debate more about the 10Y UST area. As detailed earlier, the 10Y UST is higher by +21 bps YTD with 3M UST +7 bps higher. The 2025 period posted a bull steepener. As of now, the 2026 action has been a bear flattener from 2Y to 30Y.
See also:
New Homes Sales Jan 2026: The Nays Carry 3-19-26
Producer Price Index Feb 2026: Getting Warmer 3-18-26
Industrial Production Feb 2026: Capacity Utilization 3-16-26
Market Lookback: The Gulf of Cause and Effect 3-15-26
Market Commentary: Asset Returns 3-15-26
PCE Inflation Jan 2026: Personal Income & Outlays 3-13-26
GDP 4Q25 Second Estimate: Sharp Move Lower 3-13-26
Housing Starts Jan 2026: Total Starts Up, Completions Up, Permits Down 3-12-26
CPI Feb 2026: It’s Making You Wait… 3-12-26
Existing Home Sales Feb 2026 3-10-26
Market Commentary: Asset Returns 3-8-26
Payrolls Feb 2026: Into the Weeds 3-8-26
Employment Situation Feb 2026: Payrolls Get Ugly 3-8-26
VIX: Market Still Not Getting the Vapors 3-6-26