
Footnotes & Flashbacks: State of Yields 6-2-24
We update yields in a mixed week for the UST curve and low action in spreads. We look at the 2Y to 30Y slope.


"I think I might hear the consumer cracking..."
The modest UST steepener on the week left bond returns slightly negative but without much new direction from the PCE release or 1Q24 GDP revisions on the direction of the FOMC path.
A fresh round of jobs data is dead ahead this week, but we see the latest FOMC meeting and dot plots on June 11-12 along with the latest CPI release.
The drama in Washington and in the courts is not doing much of anything for UST since consumers are still chugging along even if easing back a bit in recent metrics with 2024 and 2025 earnings forecasts unfazed.
The market and street seem inclined to stay out of the election projection business. Policy handicapping for valuation present greater “client offense risk” than confidence in a reliable forecast of policy outcomes.
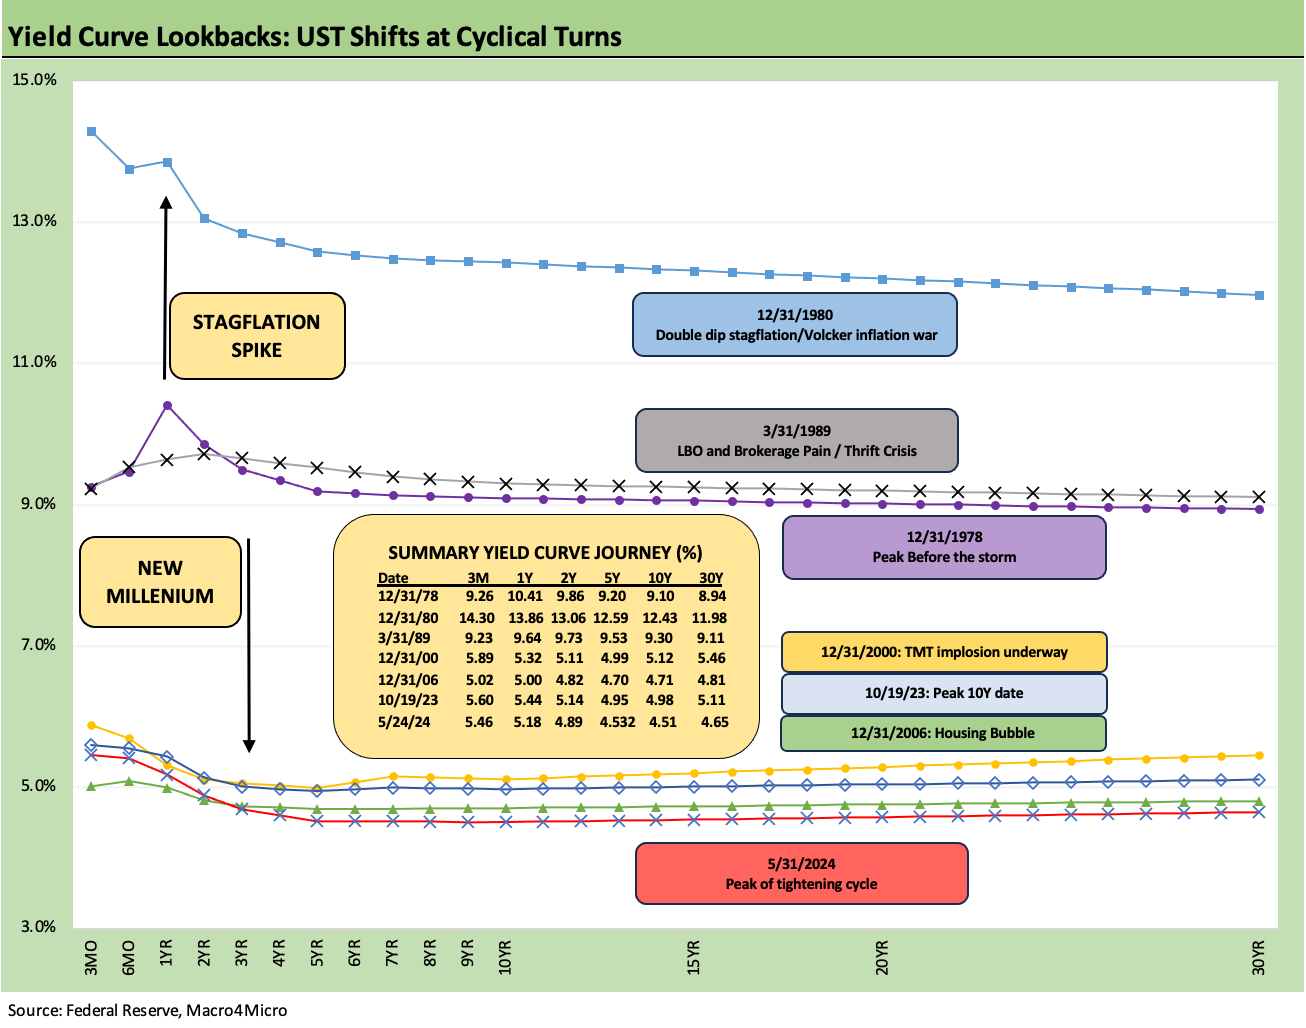
The above chart updates the running UST curve histories from the Carter years to current times. We highlight the pre-ZIRP cycles and the latest post-ZIRP period for a better mix of historical frames of reference.
As much of a shock as the 2022-2023 tightening cycle has been for many accustomed to the free money and ZIRP years, the reality is that current UST rates are low when looking back across less artificially distorted markets.
After years of listening to Washington talking heads complain about free money and recklessly low rates, many now run for office by criticizing “runaway interest rates” and economic carnage in an economy with record high payroll count, record GDP and numerous equity benchmarks at record highs in recent weeks (i.e., S&P 500, NASDAQ, Dow).
All the modern economic cycles since the Volcker stagflation years have had their problems with examples of excess and downside threats, and this one is no different. The post-2000 economies pale in comparison to those seen in the 1980s and 1990s under Reagan and Clinton, but the last 3+ years have shown the best median growth rates of the new millennium, the highest employment additions (total payroll count), and the fewest crises and bubble fallout periods to this point.
The distinctive problem has been inflation and the related repricing effects on the food, durable goods, and shelter menus since 2020. That price pain could make all the difference in an election year. There are not many examples of inflation being an election killer over time, but the main ones are Ford and Carter. After that, core inflation was held in check. The fickle nature of politics will decide whether these interest rates are unacceptable to voters when in fact the current UST levels are low in the context of pre-crisis periods (before the global banking system and European sovereigns almost melted down).

The above chart updates the shift from the 10-19-23 highs of the UST. We include the running YTD increase in UST deltas. The UST has delivered a beating to YTD bond returns in 2024, with the curve now closer to the Oct 2023 highs than to the UST curve at the start of the year.
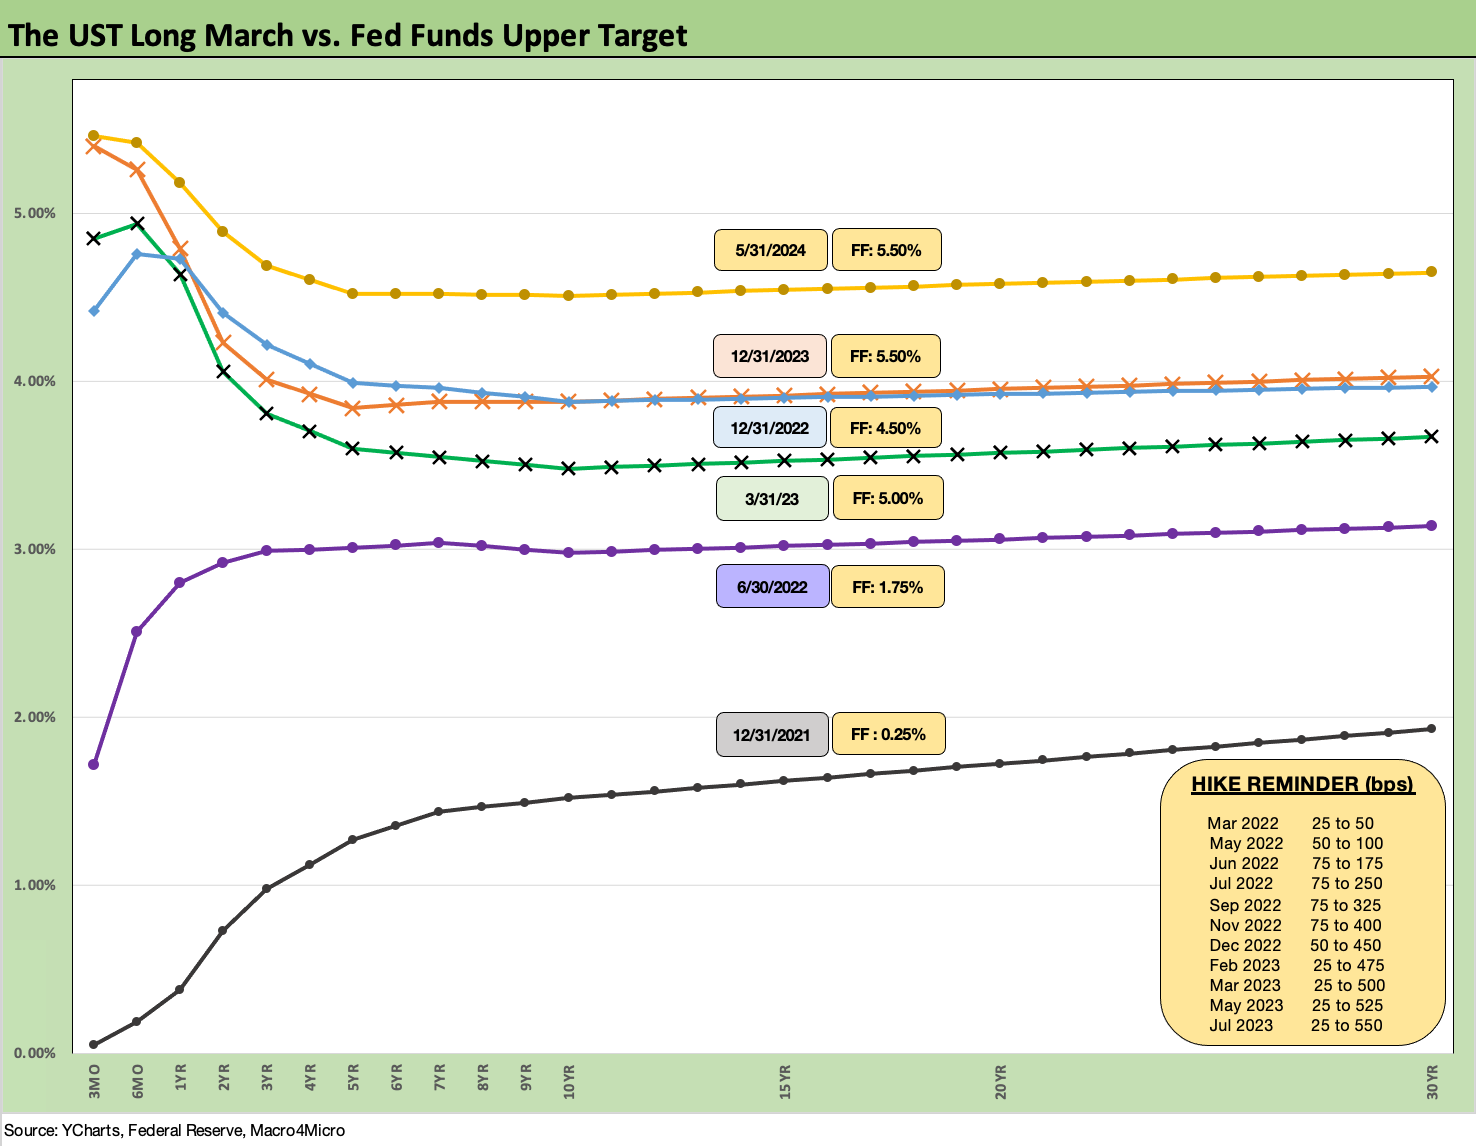
The above chart simply plots the movement of the UST curve across the tightening cycle from the 12-31-21 period across some notable dates in 2022-2023. We also include a memory box for the FOMC actions along the way.
This chart highlights the convergence of the 12-31-22 and 12-31-23 UST curves out the maturity spectrum despite the 100 bps differential in fed funds. This is our gut check on whether easing on the front end would necessarily bring the long end down with it. That 2022 vs. 2023 UST convergence says, “not so fast.” The supply of bonds and massive refinancing needs will not help. A lot of other ingredients go into the UST shift recipe across international demand, the liability management targets of the UST maturity planning, inflation, the dollar, etc.
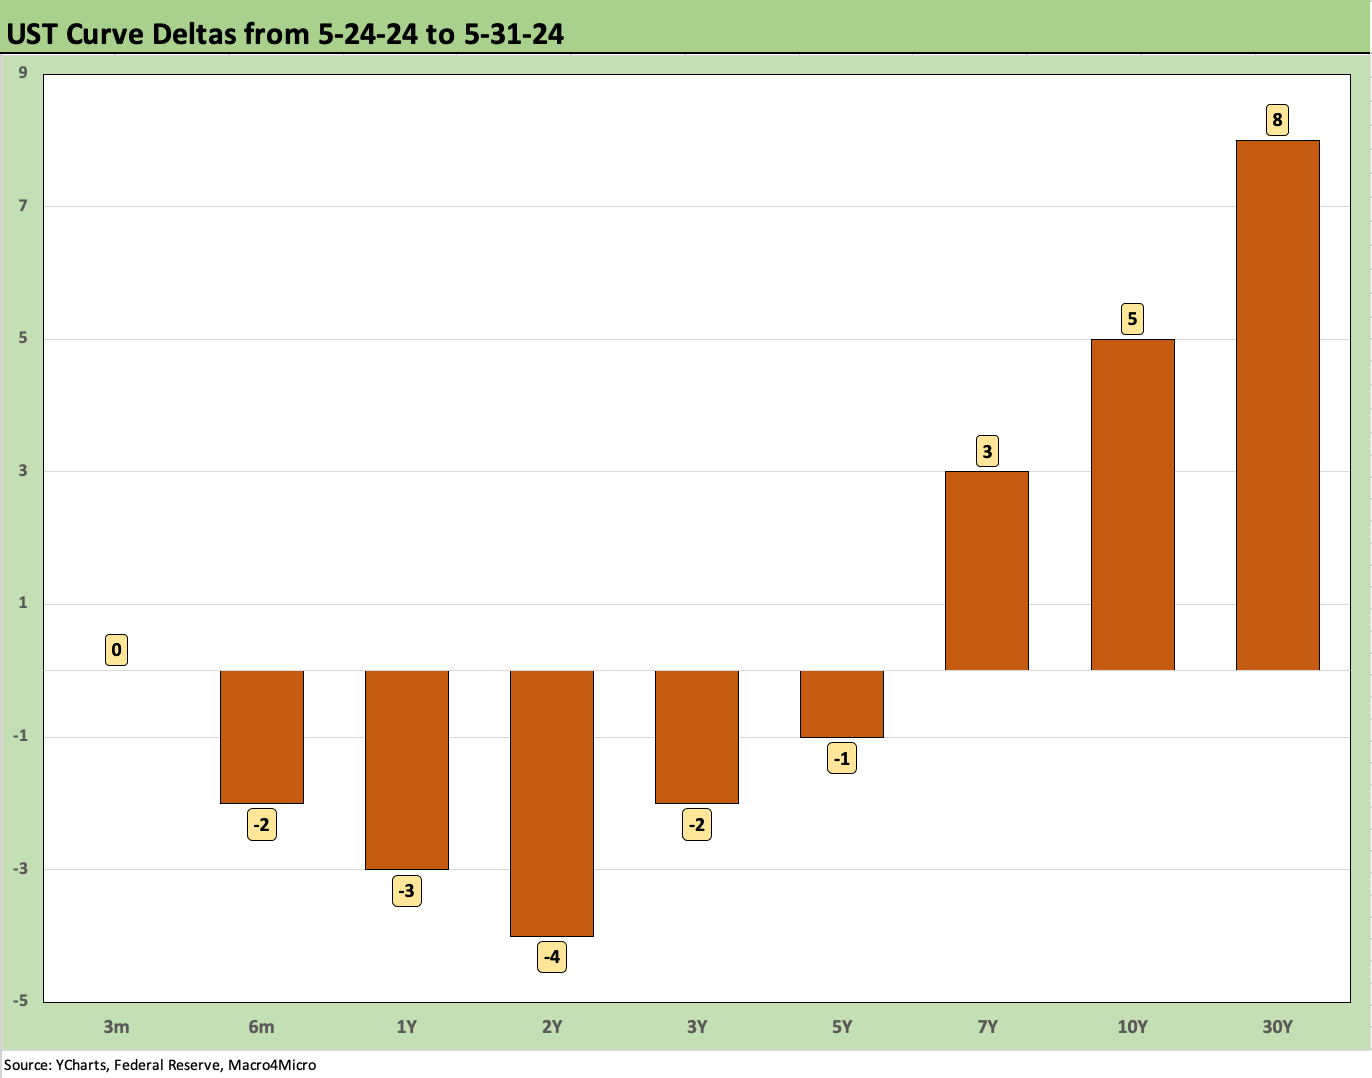
The above chart updates the UST deltas for the week. We see some modestly lower rates on the front end and modestly higher on the long end. Duration loses the fight again.

The above chart offers an updated visual on the UST deltas and pattern from the peak date for the 10Y UST (10-19-23).

The above chart updates the delta and pattern from the start of 2024. That has been a rough ride for bonds and duration returns.

The above updates our weekly mortgage chart where we frame the latest Freddie Mac 30Y UST benchmark and UST curve vs. those seen in the peak year for homebuilding (2005) and the period in mid-2006 when the RMBS cracks and subprime quality woes were starting to creep into the light. We use June 2006 for that purpose.
For this past week, the 30Y mortgage rate ticked higher and moved back over 7.0% to 7.03%. We have seen a very narrow range in recent weeks. These rates are shocks for entry level buyers and for those looking to sell and move but who hold 3% mortgages. That is where the builders have picked up share of total homes sales through creative incentives from their mortgage operations.
The housing markets get a lot of attention in our work at the macro level and in single names. For the most recent housing sector trends, see New Home Sales April 2024: Spring Not Springing Enough 5-23-24, Existing Home Sales April 2024: Pay More, Get Less, but More Available 5-22-24, Housing Starts April 2024: Recovery Run Rates Roll On 5-16-24.
For some recent single name work that helps shed some light on the ability of the builders to push through this tightening cycle, see Credit Crib Note: NVR Inc. 5-28-23, Toll Brothers: A Rising Tide Lifts Big Boats 5-23-24, Credit Crib Note: Taylor Morrison 5-20-24). The margin performance and cash flow fundamentals have been impressive.

The above chart updates the running yields on the IG index and HY index. We use the pre-crisis medians of 6.1% for IG Corporates and 9.3% for HY bonds as the more useful frames of reference in what we now see as a post-ZIRP world and somewhat normalized UST backdrop. The lows of 2020 in IG index yields offer an eye-opener at sub-2.0% handles and HY in 2021 at sub-4%. No wonder IG and HY yields look extremely generous even at very tight spreads. The risk premiums are anything but generous even if these all-in yields have not been seen since 2008 outside of spread spikes (e.g., 2016).

The above chart takes a similar approach to what we did with mortgages except we use late 1997 and mid-2007 for credit market peaks and very tight spreads. We plot the IG index on the horizontal lines and the UST curves for 12-31-97 and 6-29-07 (based on trading day close).
Today’s UST curve levels are much lower out the curve, but all these markets had very tight IG spreads including a record low of +53 bps in Oct 1997. At +88 bps on the IG index to end last week, there was minimal movement of -1 bp over a slow, holiday-shortened week.
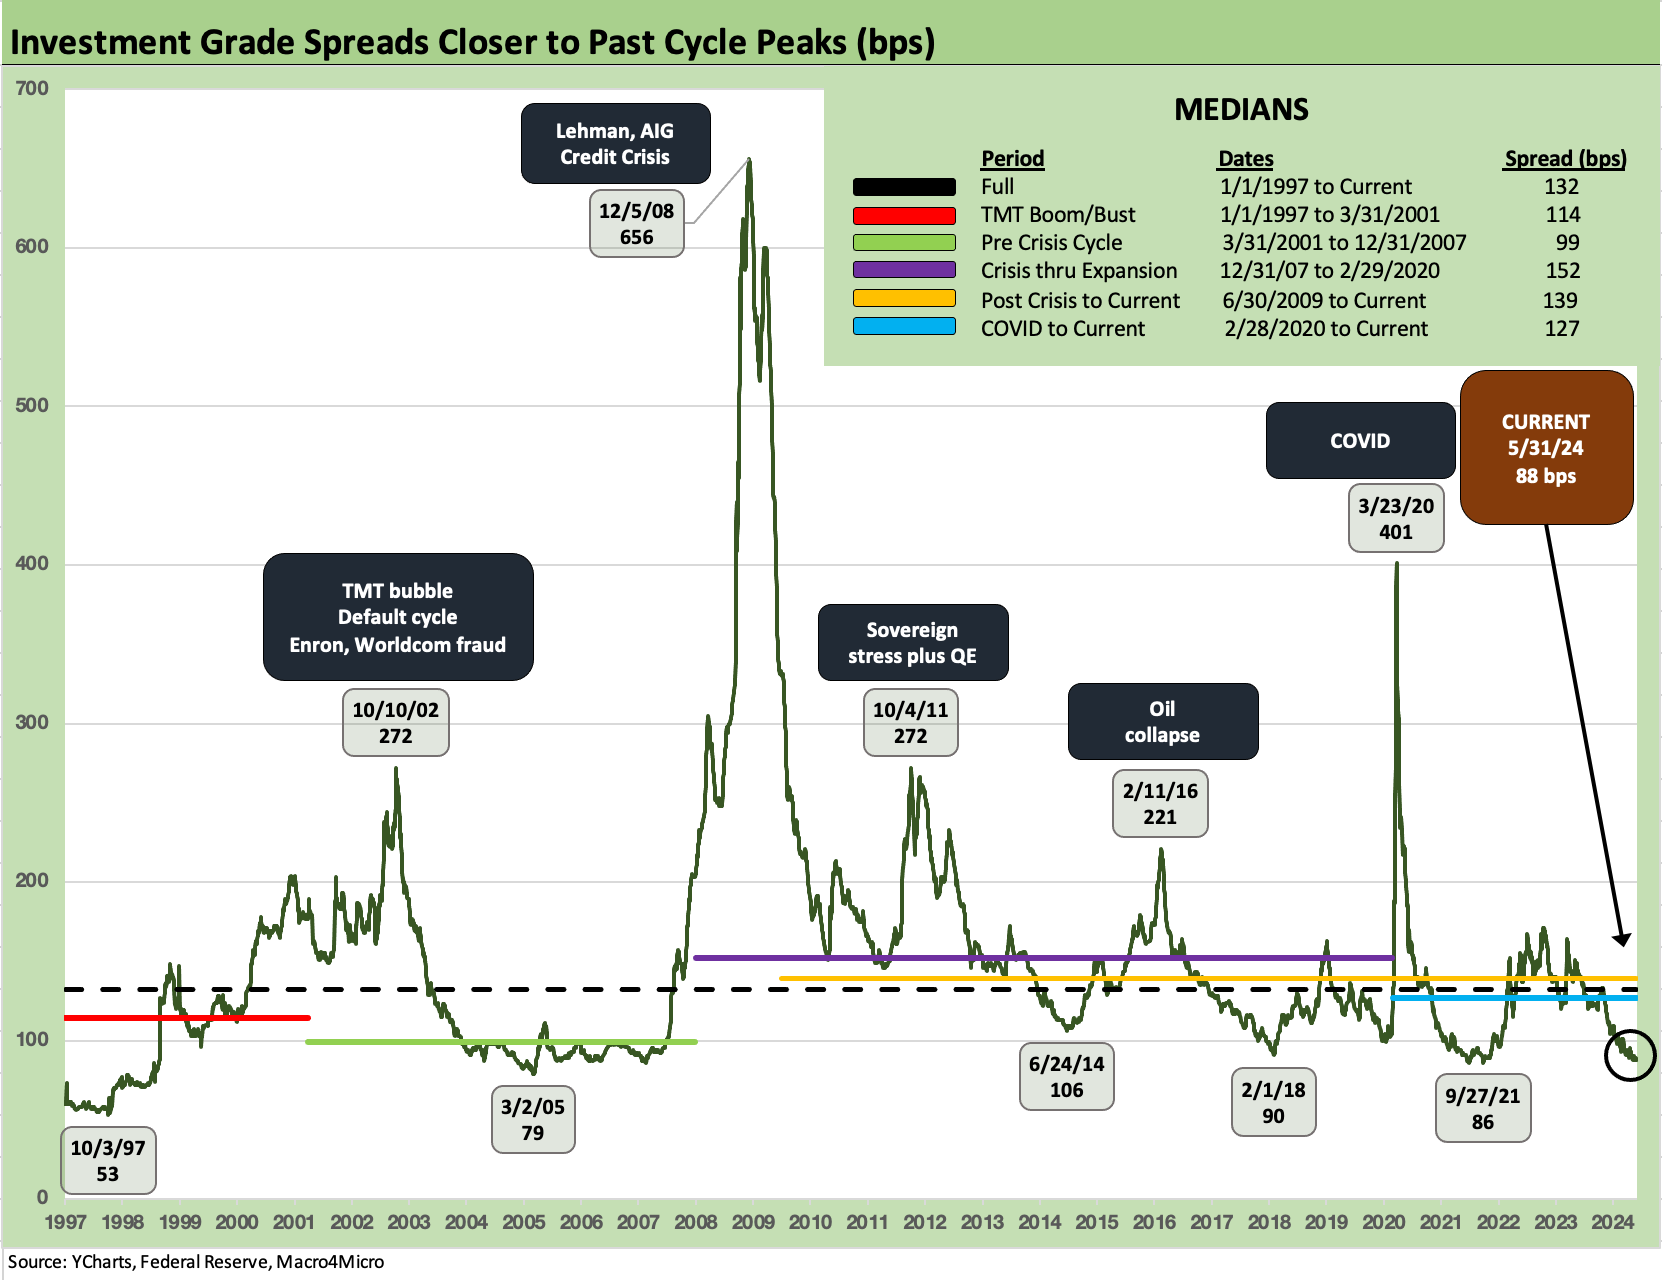
The above chart provides some history of the time series of IG spreads with some of the lows and highs noted. Current IG spreads of +88 bps are well inside all the period medians and long-term median of +132 bps framed in the box in the chart. The 1997 low in Oct 1997 at +53 bps was other worldly with year-end 1997 at +70 bps. The 1997-1998 average was +95 bps.
The current IG OAS is below the +93 bps average of 1H04 to 1H07. The 1H07 period alone averaged +86 bps. In other words, some earlier cycles highlight how IG spreads can stay compressed for a protracted period.
The +88 at Friday close is modestly above the May 2005 low of +79 bps and just above the Sept 2021 bps low of +86.

The above chart does the same exercise for HY spreads with the current price action calm of late but with +9 bps of HY index (ICE) widening the past week to +320 bps. Some rebalancing impacts drove the CCC tier wider by +30 bps on constituent shifts, but that is heavily tied to quirks of index mix changes rather than material risk repricing in HY.
Current HY bond index yields are relatively compressed across these three periods presented with UST levels lower today but HY OAS much lower at points in late 1997 and mid-2007. The June 2007 and current HY index yields are very close at 7.96% at the end of June 2007 vs. 8.04% to end last week. June 2007 HY posted tighter spreads at +298 bps to end June 2007 after hitting a low point below +250 bps early in June.
For 1997 and its 8.6% YTW at 12-31-97, the lows of +244 bps in Oct 1997 saw spreads head wider to +296 bps by year end (12-31-97). At +320 bps to end last week (5-31-24), HY index spreads are close to some very intensely risk-friendly HY markets.

The above chart updates the “HY OAS minus IG OAS” differential. This metric can be used as somewhat of a proxy for the credit compensation you get when stepping down from the IG basket into the speculative grade basket.
There are the usual asterisks of rating tier mix and industry mix with the main difference across the timeline being the BB heavy mix in today’s speculative grade index relative to the “HY Classic” focus on the B tier and below in the 1990s and earlier (daily OAS histories essentially started in 1997).
For the HY vs. IG OAS differential, the current +232 bps widened out by around +10 bps this past week but is well inside the long term median of +329 bps and the pre-crisis (2001-2007) cycle median of +309 bps and post-COVID median of +282 bps.
As we look back at low points in the differential, there is nothing quite like the +147 bps lows of June 2007, but the +187 bps of Oct 1997 is at least modestly closer. Low HY index spread dates such as June 2014 (differential of +228 bps) and Oct 2018 (differential +205 bps) did not hold up for long and were subject to almost immediate widening over the following weeks. The same is true for June 2007. In contrast, the 1997-1998 period was fairly resilient until the summer of 1998 whipsaw with Russia and LTCM market events that sent the Fed to the rescue.

The above chart updates the “proportionate risk premium” for HY spreads. We frame the risk premium (spreads/OAS) divided by the 5Y UST on the basis that it reflects the incremental yield received vs. the risk-free asset.
The metric is just a simple twist on the old theme of getting paid more for higher risk. At 0.71x, the current compensation is well below the long-term median from 1997 of 1.96x. We see low points along the way of 0.49x in June 2007 and 0.39x in May 1997.
The conclusions for absolute spreads and proportionate spreads are the same – very tight and offering low credit risk compensation. That view will still turn on an investors view of the market risk profile for a given industry mix and ratings tier mix and how long fundamentals can hold up. The equity markets are sending forward looking signs and earnings guidance pointing at steady fundamentals. 1Q24 results and guidance were also quite constructive on average.
Similarly, the theoretical bias in credit assets is that steady refinancing needs will materially increase the amount of current coupon debt and offer higher current cash generating assets as such refi and extension unfolds. The duration call had proven much trickier in this market, but the bias is for lower UST rates barring an inflation relapse.
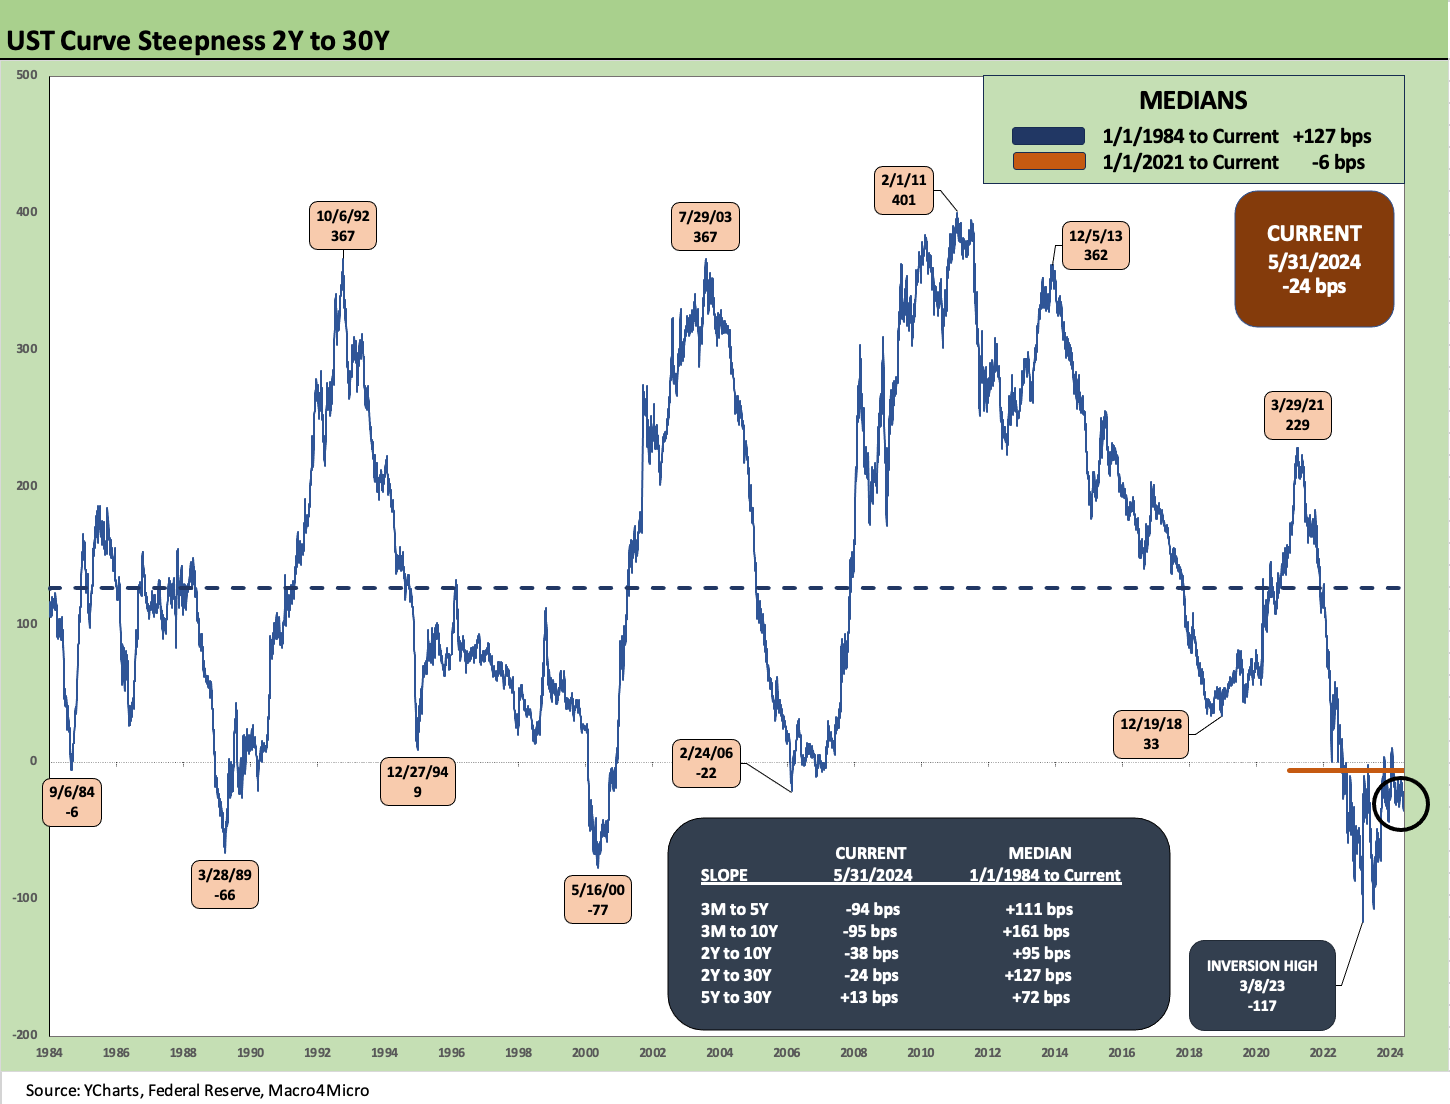
The above chart updates our weekly UST curve slopes with the recent metrics and long-term medians in the chart embedded in the box. For this week, we plot the long-term timeline of the 2Y to 30Y slope. Like most UST segments, the inversion continues at -24 bps, which is well below the peak inversion of -117 bps. The current slope for 2Y to 30Y is +151 bps away from the median of +127 bps.

The above chart plots the same 2Y to 30Y but shortens the timeline to the start of 2021 ahead of the tightening cycle. We see a peak slope of +229 bps in March 2021 before the bear inversion down to -117 bps in March 2023 and -107 bps in July 2023 ahead of the current -24 bps.
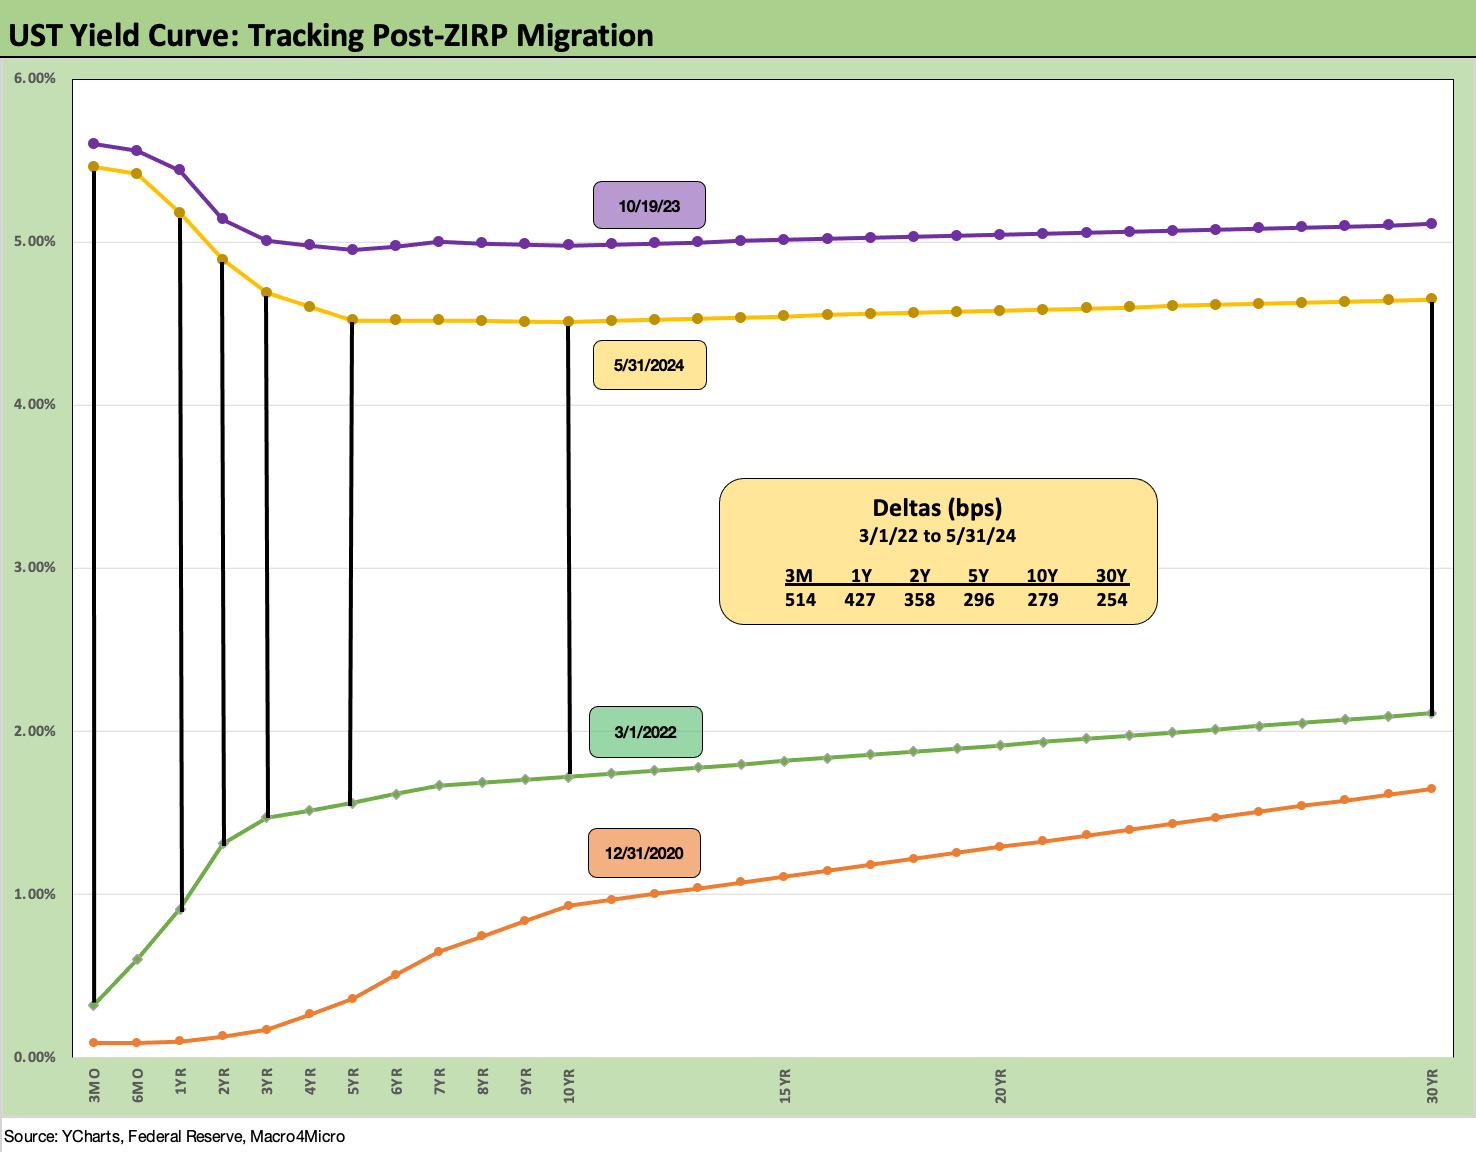
We wrap with our usual chart that captures the running UST deltas from March 1, 2022 in the month that ZIRP ended (effective March 17). We break out the cumulative UST deltas in the box with the 12-31-20 UST curve and peak UST curve of 10-19-23 when the 10Y closed just under 5.0%.
For the next two weeks, it is all about jobs, the FOMC meeting, CPI, and trying to avoid a tsunami of Washington BS.
See also:
Footnotes & Flashbacks: Asset Returns 6-2-24
PCE, Income and Outlays: Lower Income and Consumption, Sideways Inflation 5-31-24
1Q24 GDP: Second Estimate, Moving Parts 5-30-24
Footnotes & Flashbacks: State of Yields 5-27-24
Footnotes & Flashbacks: Asset Returns 5-27-24
Memorial Day: Ponderings for Donny the Dodger 5-26-24
Durable Goods: Staying the Cyclical Course 5-24-24
New Home Sales April 2024: Spring Not Springing Enough 5-23-24
Industrial Production April 2024: Another Softer Spot 5-16-24
Housing Starts April 2024: Recovery Run Rates Roll On 5-16-24
CPI April 2024: Salve Without Salvation 5-15-24
Retail Sales April 2024: Get by with a Little Help 5-15-24
Consumer Sentiment: Flesh Wound? 5-10-24
April Payroll: Occupational Breakdown 5-3-24
Payroll April 2024: Market Dons the Rally Hat 5-3-24
Employment Cost Index March 2024: Sticky is as Sticky Does 4-30-24
Systemic Corporate and Consumer Debt Metrics: Z.1 Update 4-22-24