
Footnotes & Flashbacks: Asset Returns 5-27-24
Another week with a small adverse UST move and NVIDIA stealing the headlines in the midst of weak overall equity performances.


AI meets IP law...coming soon to a courtroom near you...
In a week that saw a Harris Poll report that 49% of Americans think the S&P 500 is down this year, the semi-secret good news is that pension and retirement plans broadly are seeing good results in stocks while cash holdings ease some of the pain of inflation.
The past week did not help much in the overall picture as it ranked in the lower tier of YTD performance for the 31 benchmarks and ETFs we track at only 6 positive and 25 negative.
We see 4 of the Top 5 performers this week tied to tech or tech-centric ETFs with all 6 bond ETFs in negative range, the S&P 500 barely making it into the positive zone for the week on the back of a solid Friday, and Energy and Financial sectors seeing some setbacks.
Bond ETFs are still negative YTD with TLT’s negative return at twice the negative returns for LQD followed by AGG and GOVT.

The above chart covers the headline benchmarks we watch for debt and equity. We line them up in descending order of 1-year returns. HY has been the clear leader in debt LTM with double-digit, equity-like returns. For equities, it has been a great run where the #1 NASDAQ has dwarfed nominal long-term equity returns as an asset class. Even the #4 Russell 2000 has almost doubled long-term nominal returns on equities. As noted in the debt chart, the UST index has underperformed at levels below cash returns.
While the 1-month time horizon for the lines were all negative as recently as late April (detailed in our 4-26-24 Footnotes publication), the 1-month columns remain all positive for this week’s update. The running 1-month return numbers for debt see 3 of the 4 down sequentially with only UST very slightly higher with the rolling 4-week period.
For equities and the rolling 1-month numbers, they are all positive but 3 of 4 are lower sequentially with only NASDAQ higher after a strong tech week we detail further below in the Benchmark/ETF section. The Dow has been hit the hardest for the rolling 4 weeks with +1.76% down from +6.15% after a rough week (-2.3%) dropped into the new measurement period and an older week fell out.

The 1500 and 3000 series also flipped this past month. Looking back to the end of April, the 1-month returns were all negative except one positive with Energy. This week all are positive except Energy at negative.
Growth is winning for the month by a substantial margin, but looking back 3 months, 6 months and 1 year, we see a market with breadth that came on strong in the Nov-Dec 2023 stretch. The late 2023 rally made all the difference for many benchmarks and industry groups and notably small caps.
Energy and Real Estate have been volatile, but the strong performance of Industrials and Financials is a confidence builder in the state of the economy or at least reflects some conviction around where the market thinks it might head from here.
The rolling return visual
In the next section we get into the details of the 31 ETFs and benchmarks for trailing periods. Below we offer a condensed 4-chart view for an easy visual before we break out each time period in the commentary further below. This is a useful exercise we do each week looking for signals across industry groups and asset classes.

This week’s eye-grabber is the adverse shift in one week returns at a 6-25 score on positive vs. negative after so many all-time highs in large cap indexes and a score of 26-5 last week. One week does not make a trend, and we still see an overwhelming bias towards positive in the 1-month, 3-month, and 1-year charts. The 1-year mix still is 30-1 with only the long duration 20+ Year UST ETF (TLT) in the red.
The Magnificent 7 heavy ETFs…
Some of the benchmarks and industry ETFs we include have issuer concentration elements that leave them wagged by a few names. When looking across some of the bellwether industry and subsector ETFs in the rankings, it is good to keep in mind which narrow ETFs (vs. broad market benchmarks) get wagged more by the “Magnificent 7” including Consumer Discretionary (XLY) with Amazon and Tesla, Tech (XLK) with Microsoft, Apple, and NVIDIA, and Communications Services (XLC) with Alphabet and Meta.
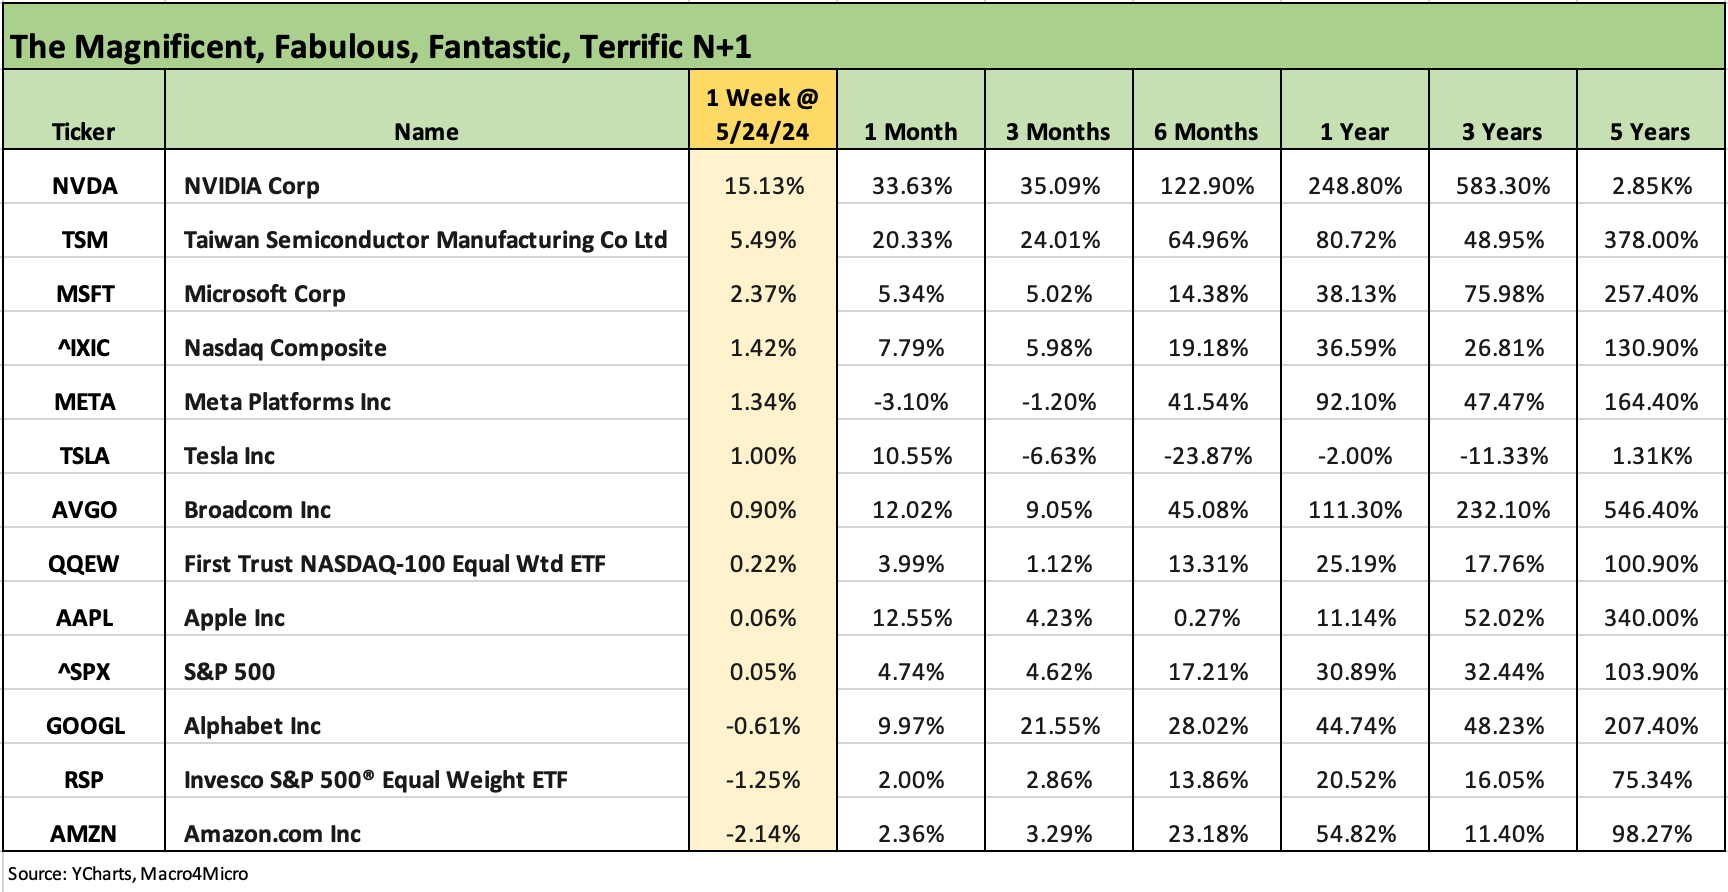
We recently added the above chart to the weekly so we can track the headline mega-names and see which might have wagged certain ETFs or the broader capitalization weighted benchmarks. We line up some of the major large cap Tech-centric names in descending order of total returns for the most recent week.
We include the S&P 500 and NASDAQ along with the equal weighted NASDAQ 100 Equal Weighted ETF (QQEW) and the S&P 500 Equal Weighted ETF (RSP). A table of the big tech names from the Mag 7 to the broader collection of “headline types” serves to streamline the weekly review process if one of the big ETF names is impacting performances.
NVIDIA once again dominated the story line this past week beating expectations and new guidance upping expectations yet again. For the week, we see only 2 beat the 3% line with NVIDIA crushing it at +15.1% and Taiwan Semiconductor at+5.5%. We see 2 of the Magnificent 7 in the red (AMZN, GOOGL) along with the Equal Weighted S&P 500 (RSP).

The 1-week return mix of 6-25 highlights the subpar week. The top 4 are all tech related or tech-centric with Tech ETF (XLK), NASDAQ (IXIC), Communications Services (XLC), and the Equal Weighted NASDAQ 100 ETF (QQEW). The top quartile included negative returns for TLT and GOVT at #7 and #8. The S&P 500 at #6 was barely positive after a Friday rally and the high dividend BDC ETF (BIZD) at +0.1% was #5.

The running 1-month numbers saw a shift from last week’s 30-1 to this week’s 26-5. We see the energy related ETFs in the bottom 3 positions including the Energy ETF (XLE) in a near dead heat with E&P (XOP) as the Midstream ETF (AMLP) was 3 spots off the bottom. Transport (XTN) and Regional Banks (KRE) round out the bottom 5.
Tech (XLK) and NASDAQ (IXIC) retook the lead over Utilities (XLU) on some very strong numbers this week with NVIDIA pulling numerous tech names along as well. We see the Equal Weighed NASDAQ 100 ETF (QQEW) in the top quartile. Other top quartile performers for 1-month includes EM Equities (VWO) and Base Metals (DBB) with the S&P 500 and small caps (RUT) rounding out the lower end of the top quartile mix.

The 3-month posted a moderately negative shift from last week’s 29-2 to this week’s 25-6. The Transport ETF sits in last place just ahead of Consumer Discretionary (XLY) and Real Estate (XLRE). XLY has had a Tesla and Home Depot problem, among others. The defensive Health Care ETF (XLV) and two bond ETFs (TLT, GOVT) round out the negative line items. AGG and LQD squeezed into positive territory but sat in the upper end of the bottom quartile.
The leaders of the 3-month stretch are similar to last week with Base Metals (DBB) and Utilities ETF (XLU) way out in front. Energy has been volatile and held down the #3 and #4 spots with the E&P ETF (XOP) and Energy (XLE) switching places this week. The XLE and XOP results really swing around and both were battered this past week on weaker oil prices ending Friday at a $76 handle (looks like oil is bouncing back Monday).
Among notable movers in the latest rolling 3-month rankings is the Homebuilder ETF (XHB), which fell from the top quartile in last week’s 3-month rankings down to the lower end of the second quartile in this week’s rolling 3-month returns.
XHB has been an extraordinary performer but is starting to see some second-guessing on the ability of the lead names to sustain the sequential growth many hope for in the peak selling season. As we cover in our housing sector and single name work (see New Home Sales April 2024: Spring Not Springing Enough 5-23-24), the builders are posting up very strong numbers, but the valuation debate does not leave much room for disappointment in equities.

The above chart revisits the exceptionally strong LTM asset performance overall with 30-1 positive. The fixed income returns as reflected in the bond ETFs are a case study in underwhelming with 4 of the bottom 5 comprised of bond ETFs (TLT, GOVT, AGG, LQD). HYG just edged out EMB in making it across the line into the bottom of the third quartile on spread compression and less duration exposure.
As of this past week, the Homebuilding ETF (XHB) is still holding down a comfortable lead at #1 over the Tech ETF (XLK), Communications Services ETF (XLC), the NASDAQ (IXIC) and Financials (XLF) at #5. We see the S&P 500, BDC ETF (BIZD), and Industrial ETF (XLI) rounding out the top quartile with Base Metals (DBB) and Regional Banks (KRE) just across the line.
KRE has been volatile, and the 1-year time horizon started some weeks after the turmoil of March and April 2023 around regional bank failures and deposit outflow fears. Anxiety in the regional bank sector around commercial real estate and deposit resilience remains a wildcard waiting for more asset quality headlines wrapped around earnings season. News from real estate exposed funds (redemptions, etc.) are in the spotlight as more UST curve uncertainty tied into FOMC and inflation trends. PCE inflation is due this week.
See also:
Memorial Day: Ponderings for Donny the Dodger 5-26-24
Durable Goods: Staying the Cyclical Course 5-24-24
New Home Sales April 2024: Spring Not Springing Enough 5-23-24
Footnotes & Flashbacks: State of Yields 5-19-24
Footnotes & Flashbacks: Asset Returns 5-19-24
Industrial Production April 2024: Another Softer Spot 5-16-24
Housing Starts April 2024: Recovery Run Rates Roll On 5-16-24
CPI April 2024: Salve Without Salvation 5-15-24
Retail Sales April 2024: Get by with a Little Help 5-15-24
Consumer Sentiment: Flesh Wound? 5-10-24
April Payroll: Occupational Breakdown 5-3-24
Payroll April 2024: Market Dons the Rally Hat 5-3-24
Employment Cost Index March 2024: Sticky is as Sticky Does 4-30-24
PCE, Income, and Outlays: The Challenge of Constructive 4-26-24
1Q24 GDP: Too Much Drama 4-25-24
Systemic Corporate and Consumer Debt Metrics: Z.1 Update 4-22-24