
April Payroll: Occupational Breakdown
We look across the payroll deltas by occupation in a light month with a below consensus increase in jobs.


“It’s probably time to test that deep job market so I can work with real patients.”
Services continued to carry the ball for the increased payroll count with Goods and Government light but the Health Care and Social Assistance line heavy in Services.
Durable goods did not show up this month with motor vehicles and parts in the red while nondurables posted a small increase.
In Services, health care was the clear leader while warehousing and transportation showed its resilience along with retail trade.
Earlier we already published our top-down view and historical trend lines for the payroll markets (see Payroll April 2024: Market Dons the Rally Hat 5-3-24). In this commentary, we get into the occupation lines.
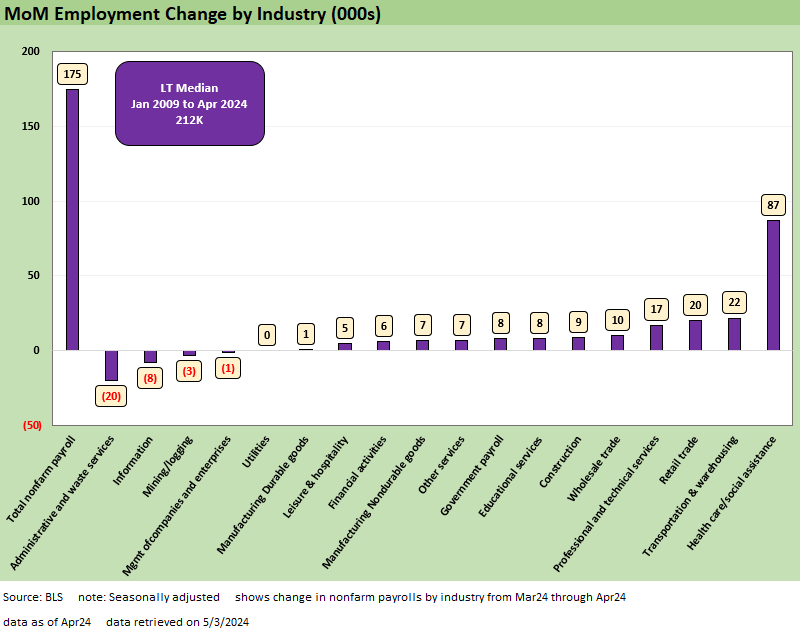
The above chart details the mix across the +175K in job additions in April. The softer number for the month is modestly below the median from Jan 2009 of +212K per month and comes off the back of a very strong March at +315K job adds (after upward revision from +303K).
The composition of the month is similar to other softer months in recent memory where strong growth in Health Care and Social Assistance remains on its own path somewhat distinct from the rest of the job market. Retail trade rounded out the Top 3 this month with +20K adds as retail keeps seeing slow-but-steady growth over the past few months.
Post-COVID details…
The following section updates more of the line items in the payroll mix from the April 2024 release. We frame some key occupation groups across recent history and in the post-COVID era.
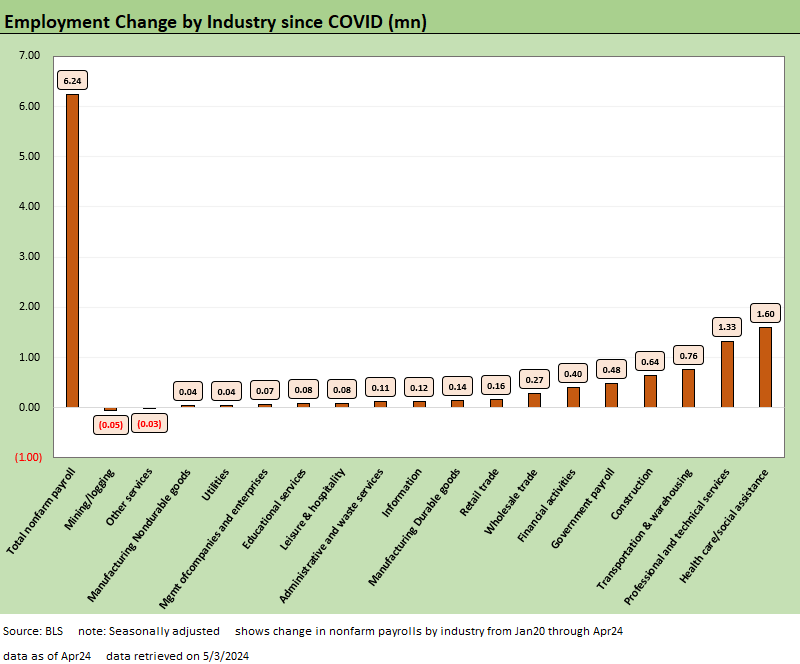
The above chart provides the running deltas vs. just before COVID (Jan20) to frame the shift in landscape in the post-COVID world.
As covered above, the latest release adds to the growth in Health Care and Social Assistance driven by the demographic trends of aging population as well as more affordable health care that makes treatment even possible.
Below that post-COVID constant in health care, Transportation & Warehousing at #3 and Construction at #4 stand out. The surge of “Amazonification” across supply chains and Amazon topping the transportation services list ahead of UPS and FedEx tells its own secular shift story. It comes as no surprise that the related hiring needs from warehousing and logistics evolution show up in the post-COVID jobs numbers. The supplier chain shocks of COVID encourages such investment in a world where trade stress and geopolitical uncertainty are more likely to be higher in the future as reshoring and onshoring ambitions and tariff threats mount.
Construction ties into that warehousing story somewhat, and construction payroll growth is evident in a high-multiplier-effect sector that flows to many other jobs. We cover the full range of construction line items further below.
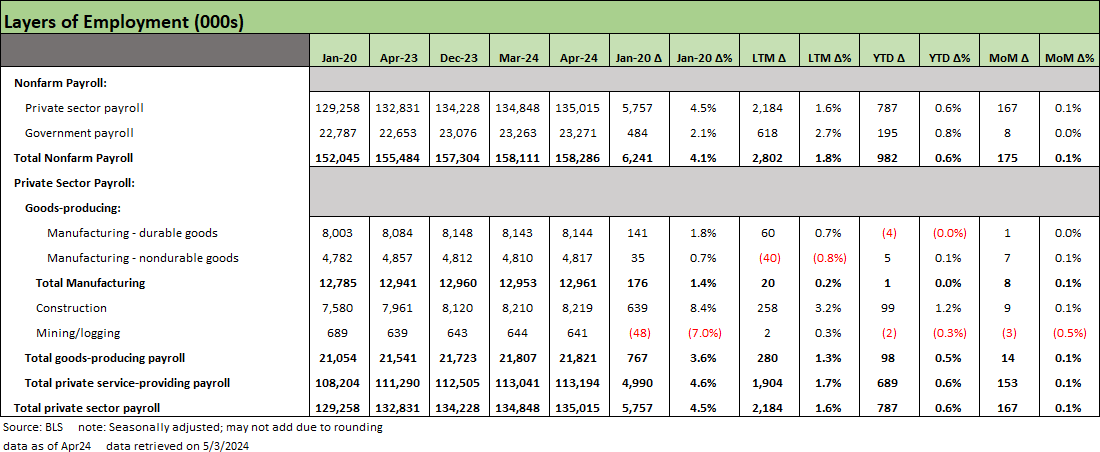
The chart breaks out the top-line sector payroll counts and deltas. Public sector payrolls were quite weak this month as government hiring was slow across the board. Both private goods and services saw 0.1% MoM changes, contributing positively to the headline print. Mining and Logging flips over to negative on a YTD basis as the secular decline continues.
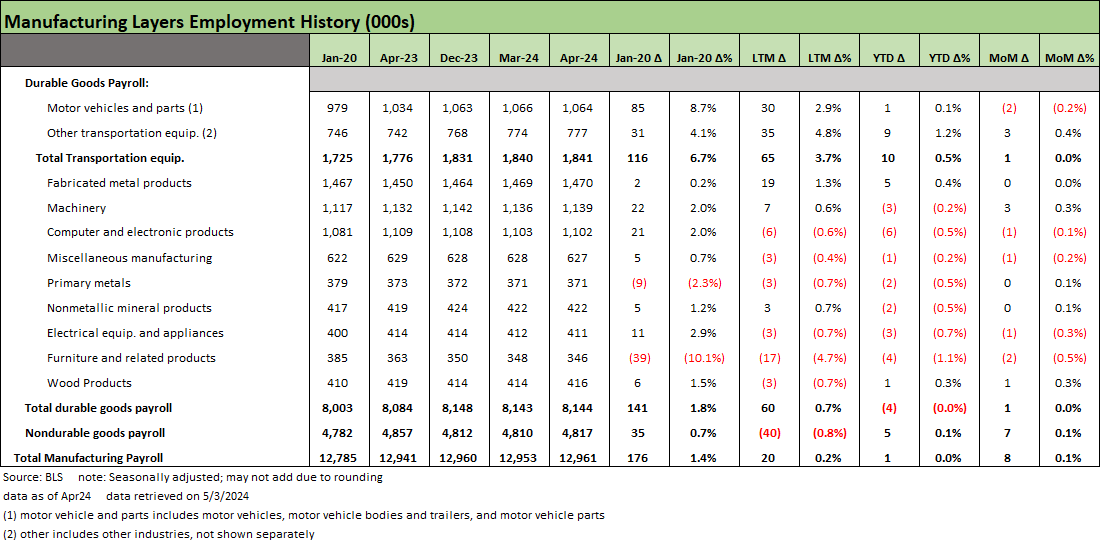
The above chart covers Manufacturing broadly but mostly drills into the durable goods layers. Durables LTM at +60K offset the -40K Nondurables job adds but so far this year Nondurables is slightly positive (+5K) and Durables slightly negative (-4K). Transportation Equipment continues to contribute a greater amount than the overall Durables additions LTM (65K vs 60K), so that hides a very mixed bag of manufacturing line items across the rest of the group.
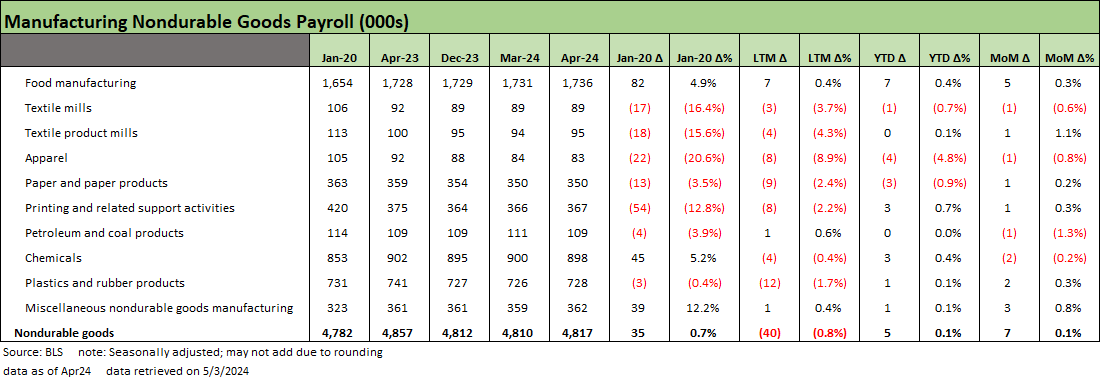
This chart covers the line items within Nondurables that makes up just over 3.5% of the private payrolls count. As covered above, the LTM delta is -40K and has only seen +35K since Jan 2020. Food manufacturing and chemicals make up the only positives in this group across the various time frames with all the other major categories in the red since Jan 2020.
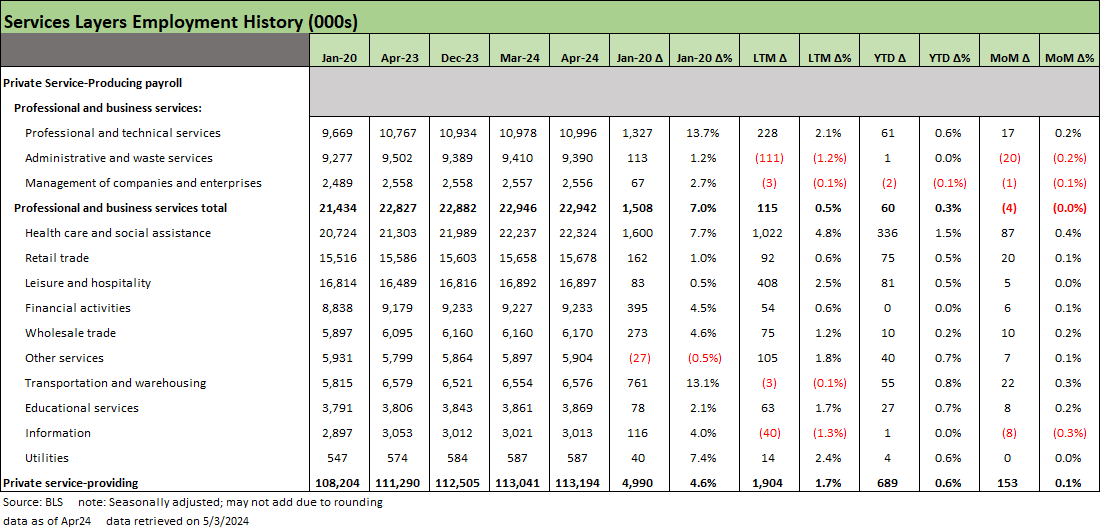
The Services payroll count is always where the lion’s share of job adds come from given that it is over 80% of private sector payrolls and over 70% of total nonfarm payrolls. Transportation and Warehousing stand out even more on a relative growth basis at 13.1% post-COVID vs. Health Care and Social Assistance growing only 7.7% across that same time.
We also see the tech layoffs story playing out as Information jobs have declined -40K LTM and -8K in April 2024. These higher visibility layoffs are small in the services context and often overshadow the massive additions within the sector.
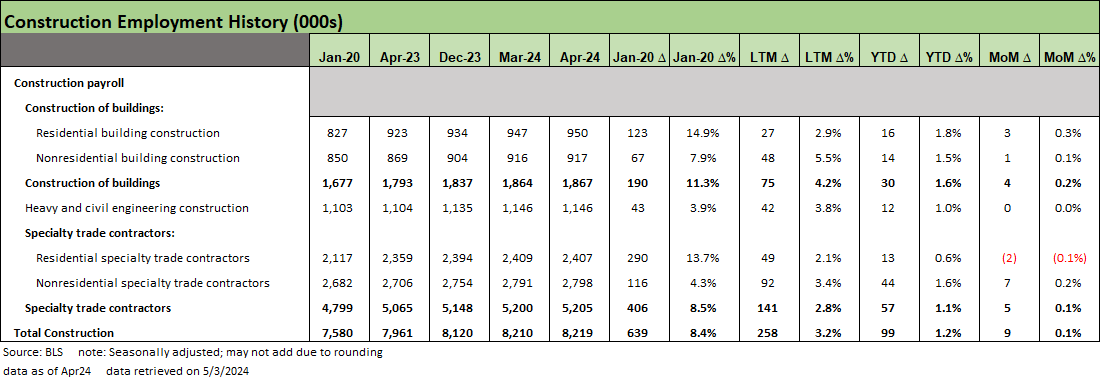
The above chart covers the construction line items that we look at regularly given the connection to real economic activity and policy initiatives enacted in recent years. A modest 9K adds this month frames up against +99K YTD and +258 LTM. Building construction job adds are relatively stronger, growing 75K LTM or 4.2% as the structural tailwind to homebuilding needs remains robust.
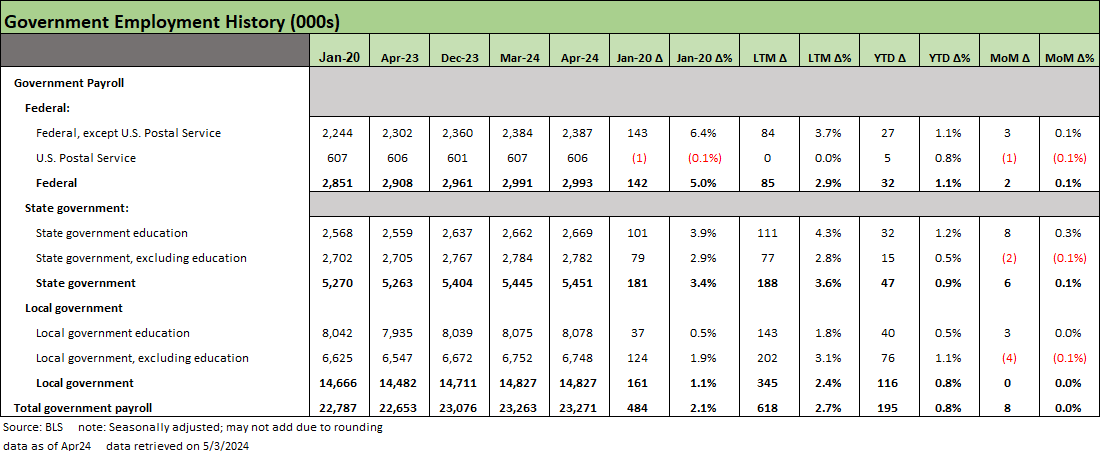
Lastly, we cover the government line items which hit the brakes this month after a decent start to the year. This month comes in as mixed and largely flat across the Government payroll stats. This LTM period (+618K) has seen government hiring go from negative to positive in the post-COVID period (+484K) with state and local leading the way at over 86% of the total Government adds LTM.
Contributors:
Kevin Chun, CFA kevin@macro4micro.com
Glenn Reynolds glenn@macro4micro.com
See also:
Payroll April 2024: Market Dons the Rally Hat 5-3-24
JOLTS March 2024: Slower Lane, Not a Breakdown 5-1-24
Employment Cost Index March 2024: Sticky is as Sticky Does 4-30-24
Footnotes & Flashbacks: State of Yields 4-28-24
Footnotes & Flashbacks: Asset Returns 4-28-24
PCE, Income, and Outlays: The Challenge of Constructive 4-26-24
1Q24 GDP: Too Much Drama 4-25-24
1Q24 GDP: Looking into the Investment Layers 4-25-24
Durable Goods: Back to Business as Usual? 4-24-24
Systemic Corporate and Consumer Debt Metrics: Z.1 Update 4-22-24