
Payroll April 2024: Market Dons the Rally Hat
A jobs number that is strong but well below consensus helps calm nerves after a rough ECI report, but the payroll count still supports growth story.


CIOs ponder impact of jobs on UST.
The April payroll number gave the market time off from outsized upside surprises in payrolls and also handed the UST market a sub-4% wage growth number (3.9%) after some troubling wage trends for 1Q24 seen in the ECI report (see Employment Cost Index March 2024: Sticky is as Sticky Does 4-30-24).
The unemployment rate ticked higher to +3.9% while the U-6 (marginally attached, part time for economic reasons) moved higher to 7.4% vs. the 6.6% (SAAR) a year ago at this time.
The Goods-producing needle barely moved at +14K while Services printed +153K with Government +8K to make up the +175K total.
We always go back to the idea that “record payroll isn’t bad for the economy” even if it stalls the FOMC in easing as the day saw stocks rally hard to end the week and the UST moving lower by midday.

The above chart plots the monthly payroll deltas since March 2022 when the tightening cycle got underway. We highlight the months below 212K which is the long term median from Jan 2009. The payroll count rose once again well ahead of demographic needs at +175K with the additions dominated by Services. We will look at the occupational mix in a separate commentary.
For those keeping score at home or work (that excludes Fox news or anyone on the GOP side of the aisle in Congress), there are no decreases in payroll over the tightening cycle and every month is at least in triple digits and outpacing demographic needs. That is an extraordinary stretch of high payroll additions. That is the good news.
The bad news is that high payroll additions make the last mile inflation battle more of a protracted siege. The Democratic side of the aisle may not be keeping score there in an election year, but at least the 3% handle CPI numbers are a long way from the 9% handle peak.

The above chart plots the total payroll adds/declines against the unemployment rate in a two-sided chart covering the timeline from Jan 2009 to April 2024. We separate out the wild numbers of COVID into a separate box to avoid blowing up the chart visuals.
The latest 175K adds is below the +212K median, but the 3.9% unemployment rate is well below the +5.4% median. The tick higher in the unemployment rate to +3.9% from 3.8% saw the total unemployed rise by 63K and the labor force grow by 87K to get to 3.9%. The peak adds in calendar 2022 just ahead of Fed tightening were +862K after the wild swings of 2020.

The above chart updates the U-3 vs. U-6 rate. The comparison is helpful in considering the trend line in structural underemployment or lower quality employment. As a reminder, the U-6 metric is defined with the numerator as “total unemployed + persons marginally attached to the labor force + total employed part time for economic reasons.” The denominator is “civilian labor force + workers marginally attached to the labor force.” The U-6 ticked higher to 7.4% from 7.3% in March in a modest move higher but well above the 6.6% of April 2023 a year ago.
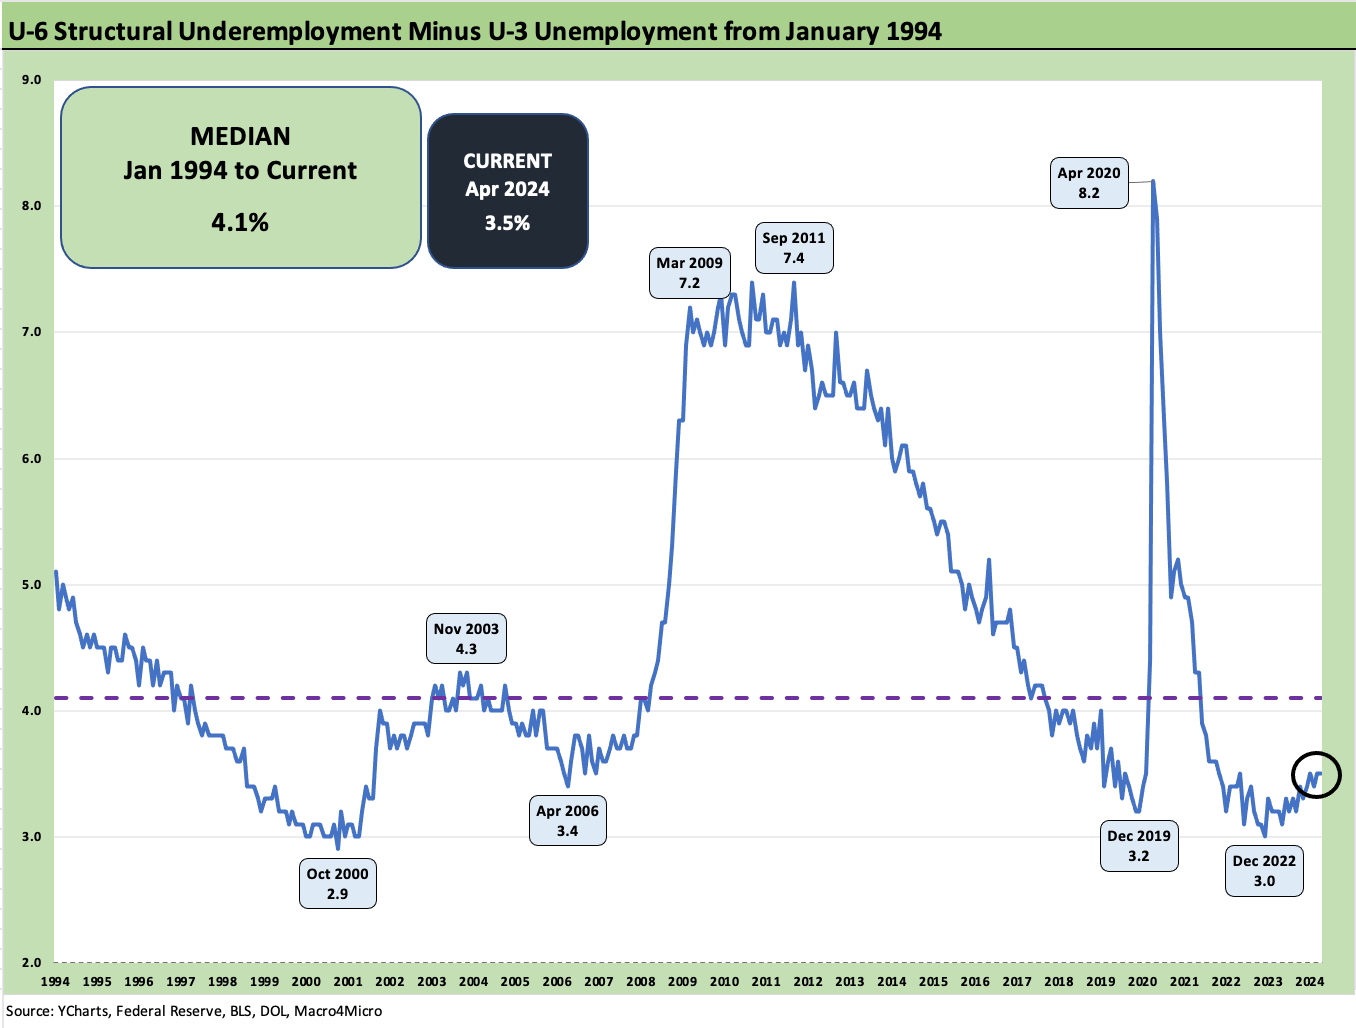
The above chart plots the differential of U-6 vs. U-3 (standard unemployment number) and we see the gap move sideways this month at +3.5% but above the lows of 3.0% in Dec 2022. The median from 1994 is 4.1%. The pre-COVID low was +3.2% in Dec 2019. The housing and credit bubble years saw a low of 3.4% in April 2006 while the TMT low tick was Oct 2000 at 2.9%. Interestingly, the credit cycle was well into a downturn in 2000 ahead of the “official” recession start date in March 2001 (see Business Cycles: The Recession Dating Game 10-10-22).

The above chart plots total payroll numbers vs. the unemployment rates. The recurring theme is that record payroll is a critical supporting variable for the PCE line in a record sized economy that is more diverse than any time in history. The “Mo paychecks, Mo consumption” rule is alive and well and PCE has held up impressively to the point where savings rates are uncomfortably low (see PCE, Income, and Outlays: The Challenge of Constructive 4-26-24).

The above chart updates payroll vs. job openings from the JOLTS report (see JOLTS March 2024: Slower Lane, Not a Breakdown 5-1-24). The job openings are trailing off from an exceptional peak over 12 million (March 2022) with the related inflationary demand issues set against a strained supply picture. The job openings at 8.49 million is well ahead of the long-term median of 5.64 million. That signals solid labor positioning even with a below consensus payroll number this month. As a reminder, JOLTS is posted at a 1-month lag.
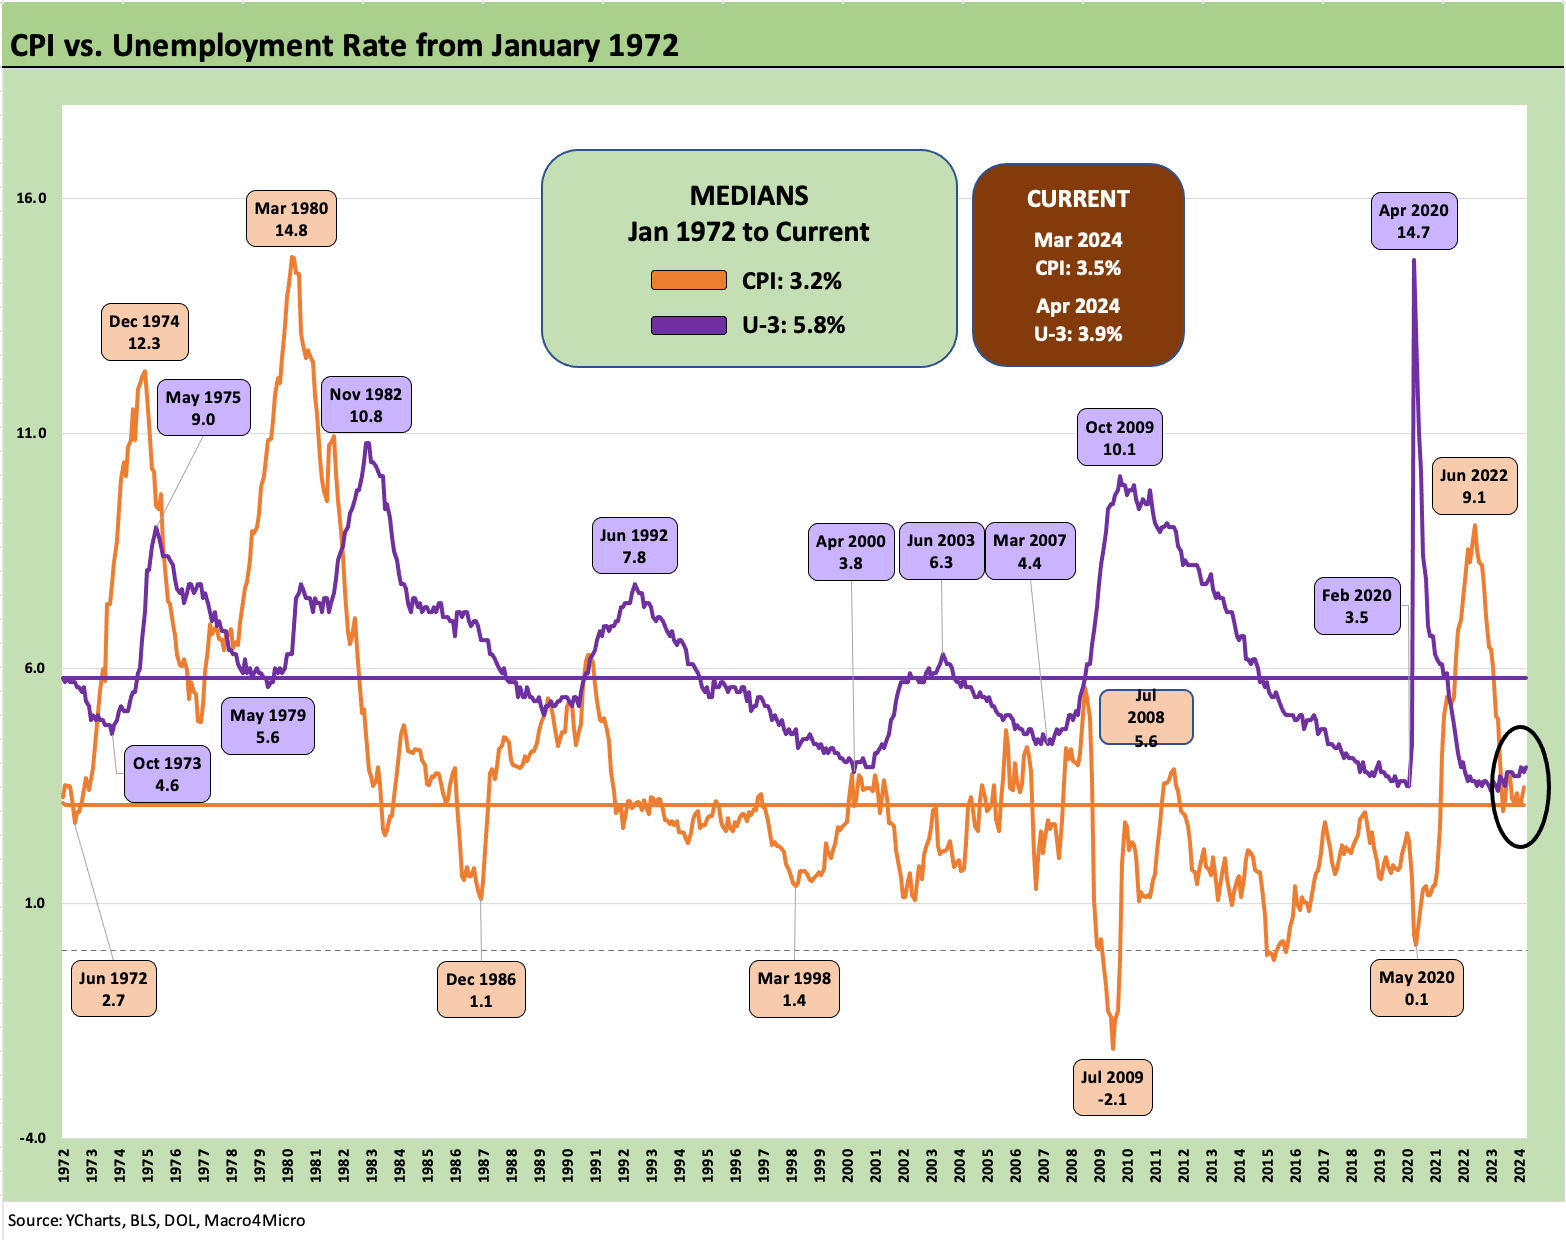
The above chart updates the CPI vs. Unemployment rate across the cycles. As market commentary gets into the “stagflation” debate, this chart offers some context on what real stagflation looks like back in 1974-1975 and in 1980-1981. It is not a term to toss around lightly but also a reminder of why it needs to be avoided like the plague by the Fed and their fiscal partners in economic stewardship over in that think tank known as Congress.
When a small group of crazies dictate the functioning of Congress, that stagflation risk is not lower. The Stag can show up, so it is not without risk. Try defaulting on UST in a debt ceiling standoff or try deporting more than 10 million people using the military. Try a trade war with China or “go medieval” on tariffs. Stagflation hasn’t shown up - yet (see 1Q24 GDP: Too Much Drama 4-25-24).
See also:
JOLTS March 2024: Slower Lane, Not a Breakdown 5-1-24
Employment Cost Index March 2024: Sticky is as Sticky Does 4-30-24
Footnotes & Flashbacks: State of Yields 4-28-24
Footnotes & Flashbacks: Asset Returns 4-28-24
PCE, Income, and Outlays: The Challenge of Constructive 4-26-24
1Q24 GDP: Too Much Drama 4-25-24
1Q24 GDP: Looking into the Investment Layers 4-25-24
Durable Goods: Back to Business as Usual? 4-24-24
Systemic Corporate and Consumer Debt Metrics: Z.1 Update 4-22-24