Consumer Sentiment: Flesh Wound?
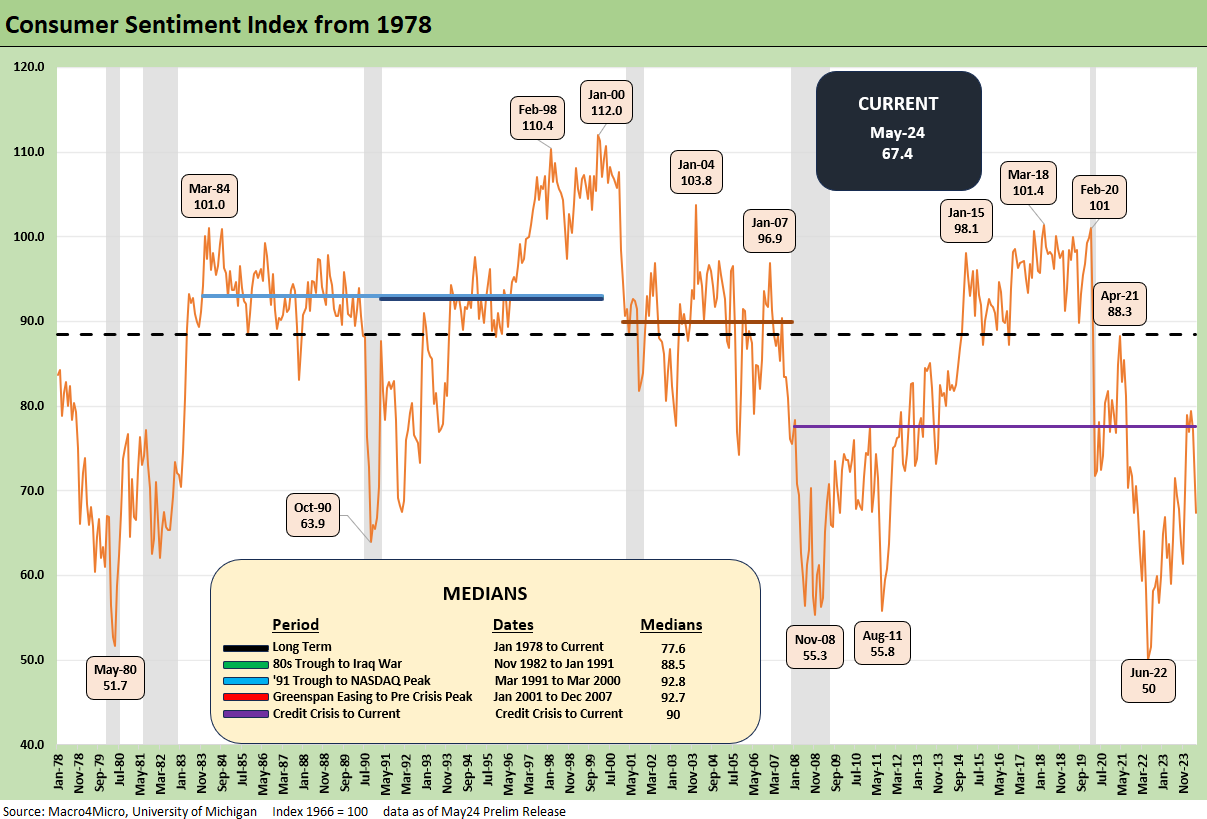
After a few quiet months, the U Mich consumer sentiment index took a sequential dive with inflation expectations edging higher.
OK so that was bad, but strong employment still has legs...
We do not generally rely too much on sequential consumer sentiment indicators based on past history, but this month reverses the big positive move of Jan 2024 from Dec 2023 (see Consumer Sentiment: Multiple Personalities 1-19-24 ). That being said, the reversal this month of -9.8 ties for #10 on the worst declines list with Dec 2012.
Under the heading of “the US is now a neurotic, hate-mongering nuthouse,” we see sharp declines in the consumer sentiment index by political party with the Democrats down by -10.9 to 90.2 and Republicans down by -8.6 to 52.1 while Independents are down the most by -12.3 to 60.2.
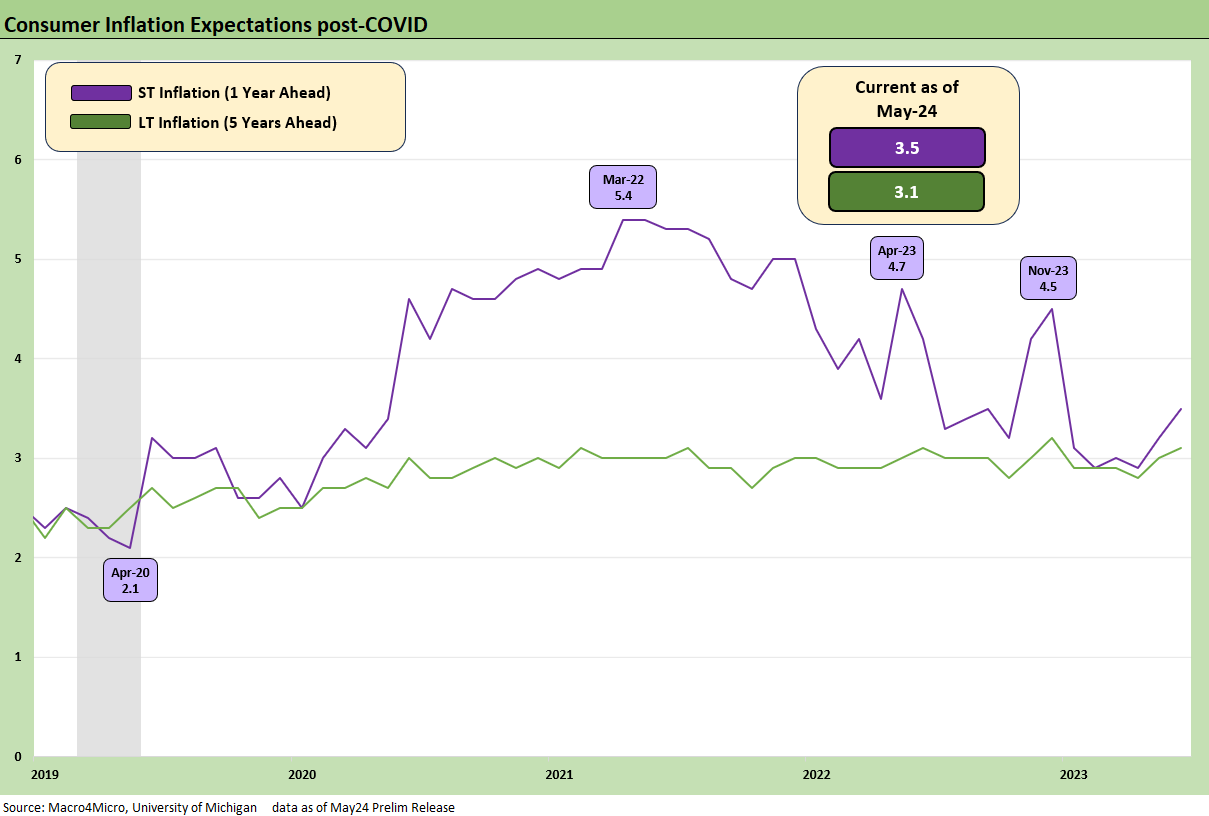
The 1-year inflation expectations index (CPI) ticked higher to 3.5% from 3.2%, and the Fed does not like negative signals on inflation expectations even if they find a more depressed consumer to potentially be helpful.
In last month’s look at the U Mich consumer sentiment, we wondered when political dysfunction would start to weigh more heavily on the minds of the left, the right, and the shrinking middle. Perhaps the very weak reading and sharp decline of the preliminary May 2024 report is letting us know.
We won’t go down that rabbit hole here, but the divergence of sentiment across political parties is getting stranger in a political environment that passed 1968 and is heading toward 1864. The common theme for May 2024 is that all the sentiment numbers for all parties are all going lower. There are no sure things for any party in this mess.
In truly disastrous markets for the economy (think Dec 2008) the sentiment metrics across parties can converge since some markets can bring a uniform view on what is truly bad (the collapse of the US bank system for example and mass layoffs). For now, it is more about the vitriol, fears of dictatorship, and just a general gutlessness in evidence from the talking head geniuses in Washington.
Beyond the credit crisis in late 2008, another example of convergence was June 1980 (when I first showed up in NYC for a job) when the Dem sentiment was 59.2 and Republican was 55.1 with 60.3 for “indies.” Maybe it was the 22% misery index (inflation + unemployment) that month? The consumer gets weirder and more confused today along with the country’s general sense of amnesia and ignorance (or indifference) to the idea of facts.
It is no surprise that the party differential in consumer sentiment really widened dramatically after the 2020 election. After all, election denialism and sacking the capital can drive mood shifts. The problem is that at some point, sentiment factors deviate from the facts on the ground when the extreme left Progressive whack jobs are screaming one thing and the hard right authoritarian/blackshirt/brownshirt zombies are screaming something else. This past week we even had Trump channeling Patrick Henry with his “Give me liberty or give me death” post. This is the same DJT who in 1968 lived by “Give me a Vietnam draft waiver or give me Daddy’s pockets to get me a doctor’s note!” No Patrick Henry there.
Fear of what comes next might even get the consumers savings rate back closer to the median (see PCE, Income, and Outlays: The Challenge of Constructive 4-26-24, Savings Rates: Context Across the Cycles 10-27-23) and start taking the edge off PCE outlays. At least there will be no more court cases until after the election. That said, the world does await the Supreme Court’s decision on immunity and the “Hitman Full Employment Act.” If we can get “no immunity” and no more court cases before the election, maybe the market might readjust to watching jobs and inflation. We can hope. But we doubt it.
The chart above updates the time series for the U Mich Sentiment index vs. Short-Term inflation expectations. As detailed in the chart at the start of this commentary, there is little to rival inflation’s impact (May 1980, June 2022) across history on consumer sentiment. Notable exceptions are the systemic crisis of late 2008 and the flashbacks to that event that came in Aug 2011 when Congress was threatening a UST default.
The next trip to that “shall we default” choice will be here after the new Congress and White House suit up (or stay put) in Jan 2025. For those keeping score at home, Trump recommended that Congress (the House) default in a CNN town hall meeting this past year before temporary sanity broke out in Congress.
The chart above updates the time series since 2019 for the short term 1-year inflation expectations vs. the 5Y expectations. Those are not all that bad if taken in the context of the long-term differential of CPI vs. PCE. The long-term differential of CPI vs. PCE is around -0.5%, so that +3.1% number is still above the 2.0% PCE target. In other words, the +3.5% short term and +3.1% long term will keep the Fed anxious on their usual expectations worry but could signal just holding the line longer. A 4% expectations number might change that handicapping.
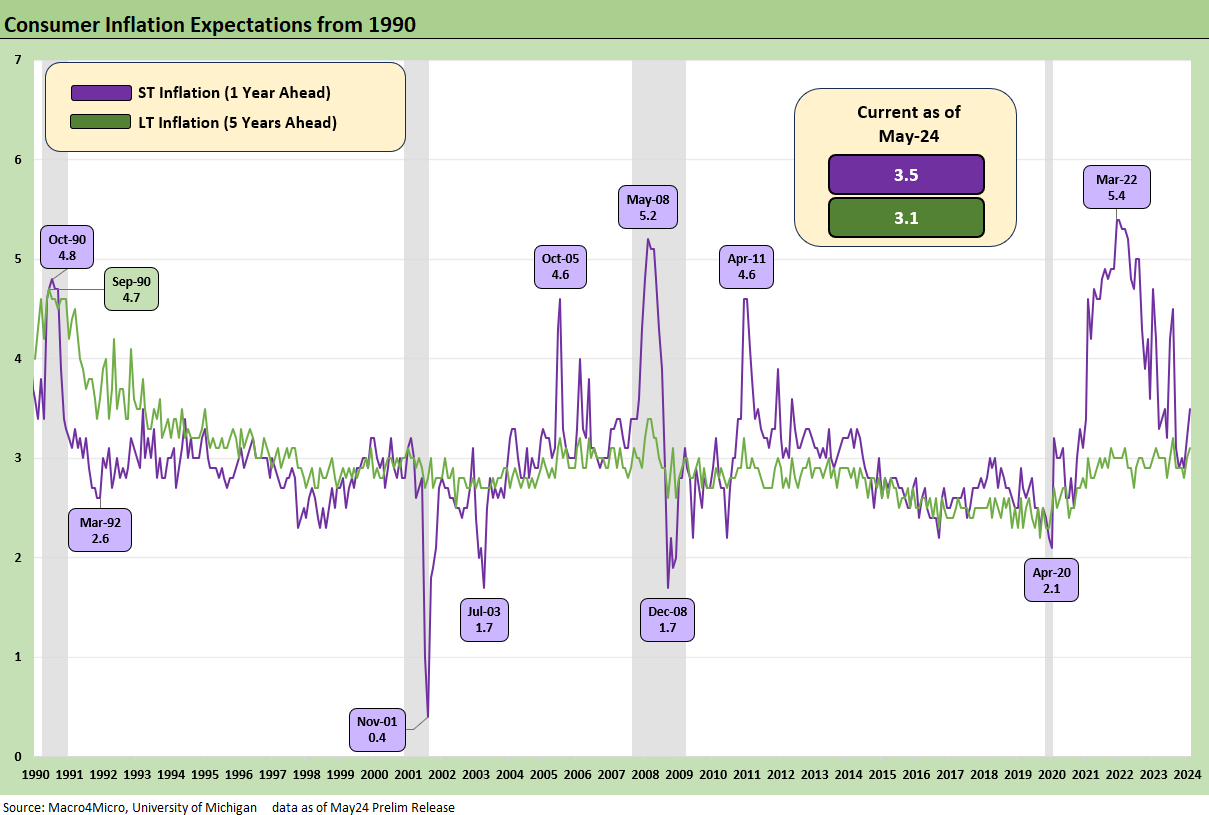
The chart above looks at the short term and long-term expectations as well but uses a timeline from 1990. The signal here is that 2.0% PCE equivalent in this chart using a half point rule of thumb for CPI vs. PCE is a real challenge vs. expectations histories and current numbers. After all, it has been a long, long time since the last bout under Volcker in the early 1980s when inflation relief took brutally high rates and an oil price collapse in 1986 to cement the victory.
Contributors
Glenn Reynolds, CFA glenn@macro4micro.com
Kevin Chun, CFA kevin@macro4micro.com
See also:
PCE, Income, and Outlays: The Challenge of Constructive 4-26-24
Consumer Sentiment: Do You Think Scary Thoughts? 4-12-24


