
CPI April 2024: Salve Without Salvation
The April CPI release brings moderation at the headline level at +3.4% and in the guts of the release after a rough stretch.


Powell’s Easing Odyssey: “Now, if I can just put the wax into my ears.”
The odds get better in the FOMC debate, but the Services numbers stay sticky on a day when Retail Sales were dialed back and offered some additional sentiment support for FOMC mind-reading.
With consumer credit metrics deteriorating and saving rates in the unsustainable zone, there is some hope for relief from the consumption line with Durables and some key sub-categories deflating including both new and used vehicles.
“All items less shelter” ticked down to +0.3% MoM (vs. +0.4% in March) and to +2.2% YoY (+2.3% in March), but total Services still sits at a +5.3% YoY with a slight MoM downtick to +0.4% from +0.5%.
“All items less energy” was only flat MoM at +0.3%, so the oil price X factor is still a crucial variable as energy flows into so many aspects of Goods and Services pricing at a lag with the flow-through of effects on materials to operating costs to freight and logistics. WTI at $78 today looks better than WTI near $82 to end April.
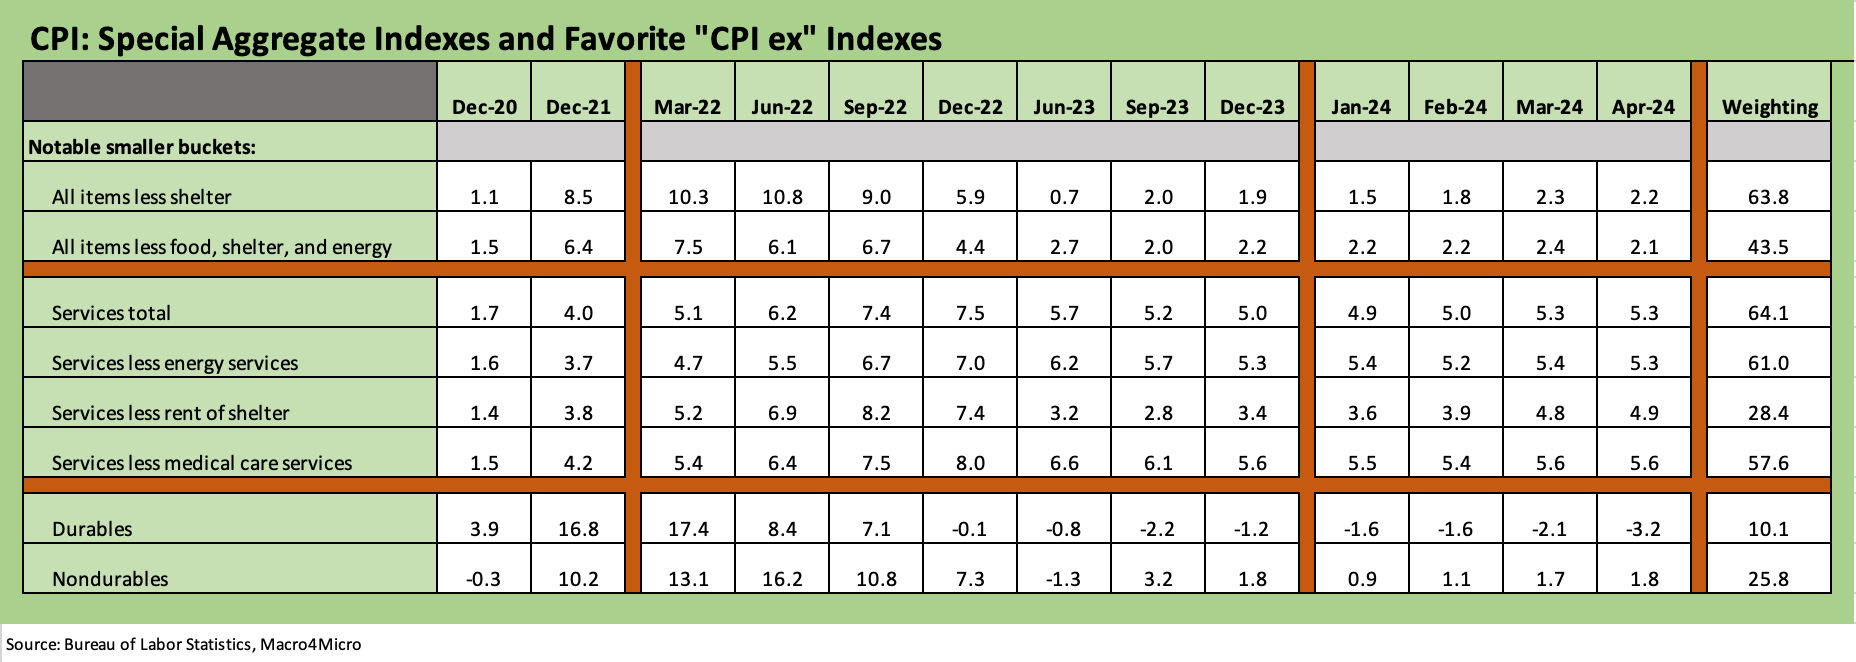
The above chart updates the time series for the Special Aggregates indexes for some more frames of reference. These offer more prisms and different angles on inflationary pressures or where progress is being made. If you are of the school that some major CPI index lines violate the “consumer checkbook rule” such as Owners’ Equivalent Rent (we see OER as more egghead theory than substance), some of these metrics resonate on the substance of the inflation trend line. In other cases, they simply help the thought process.
No matter how you play with the numbers, there is no hiding from Services inflation in a services economy. You can slice and dice the Services CPI index a number of different ways from its 64% weighting perch, but the headwinds are still there at +5.3% YoY in April in a month where it ticked down from +0.5% to +0.4% MoM. Services ex-Energy made the same move. “Services less rent of shelter” made a big move lower MoM from +0.8% in March to +0.2% in April. That still barely moved the needle for the YoY “Services less rent of shelter” index to +4.9% after +4.8% in March.
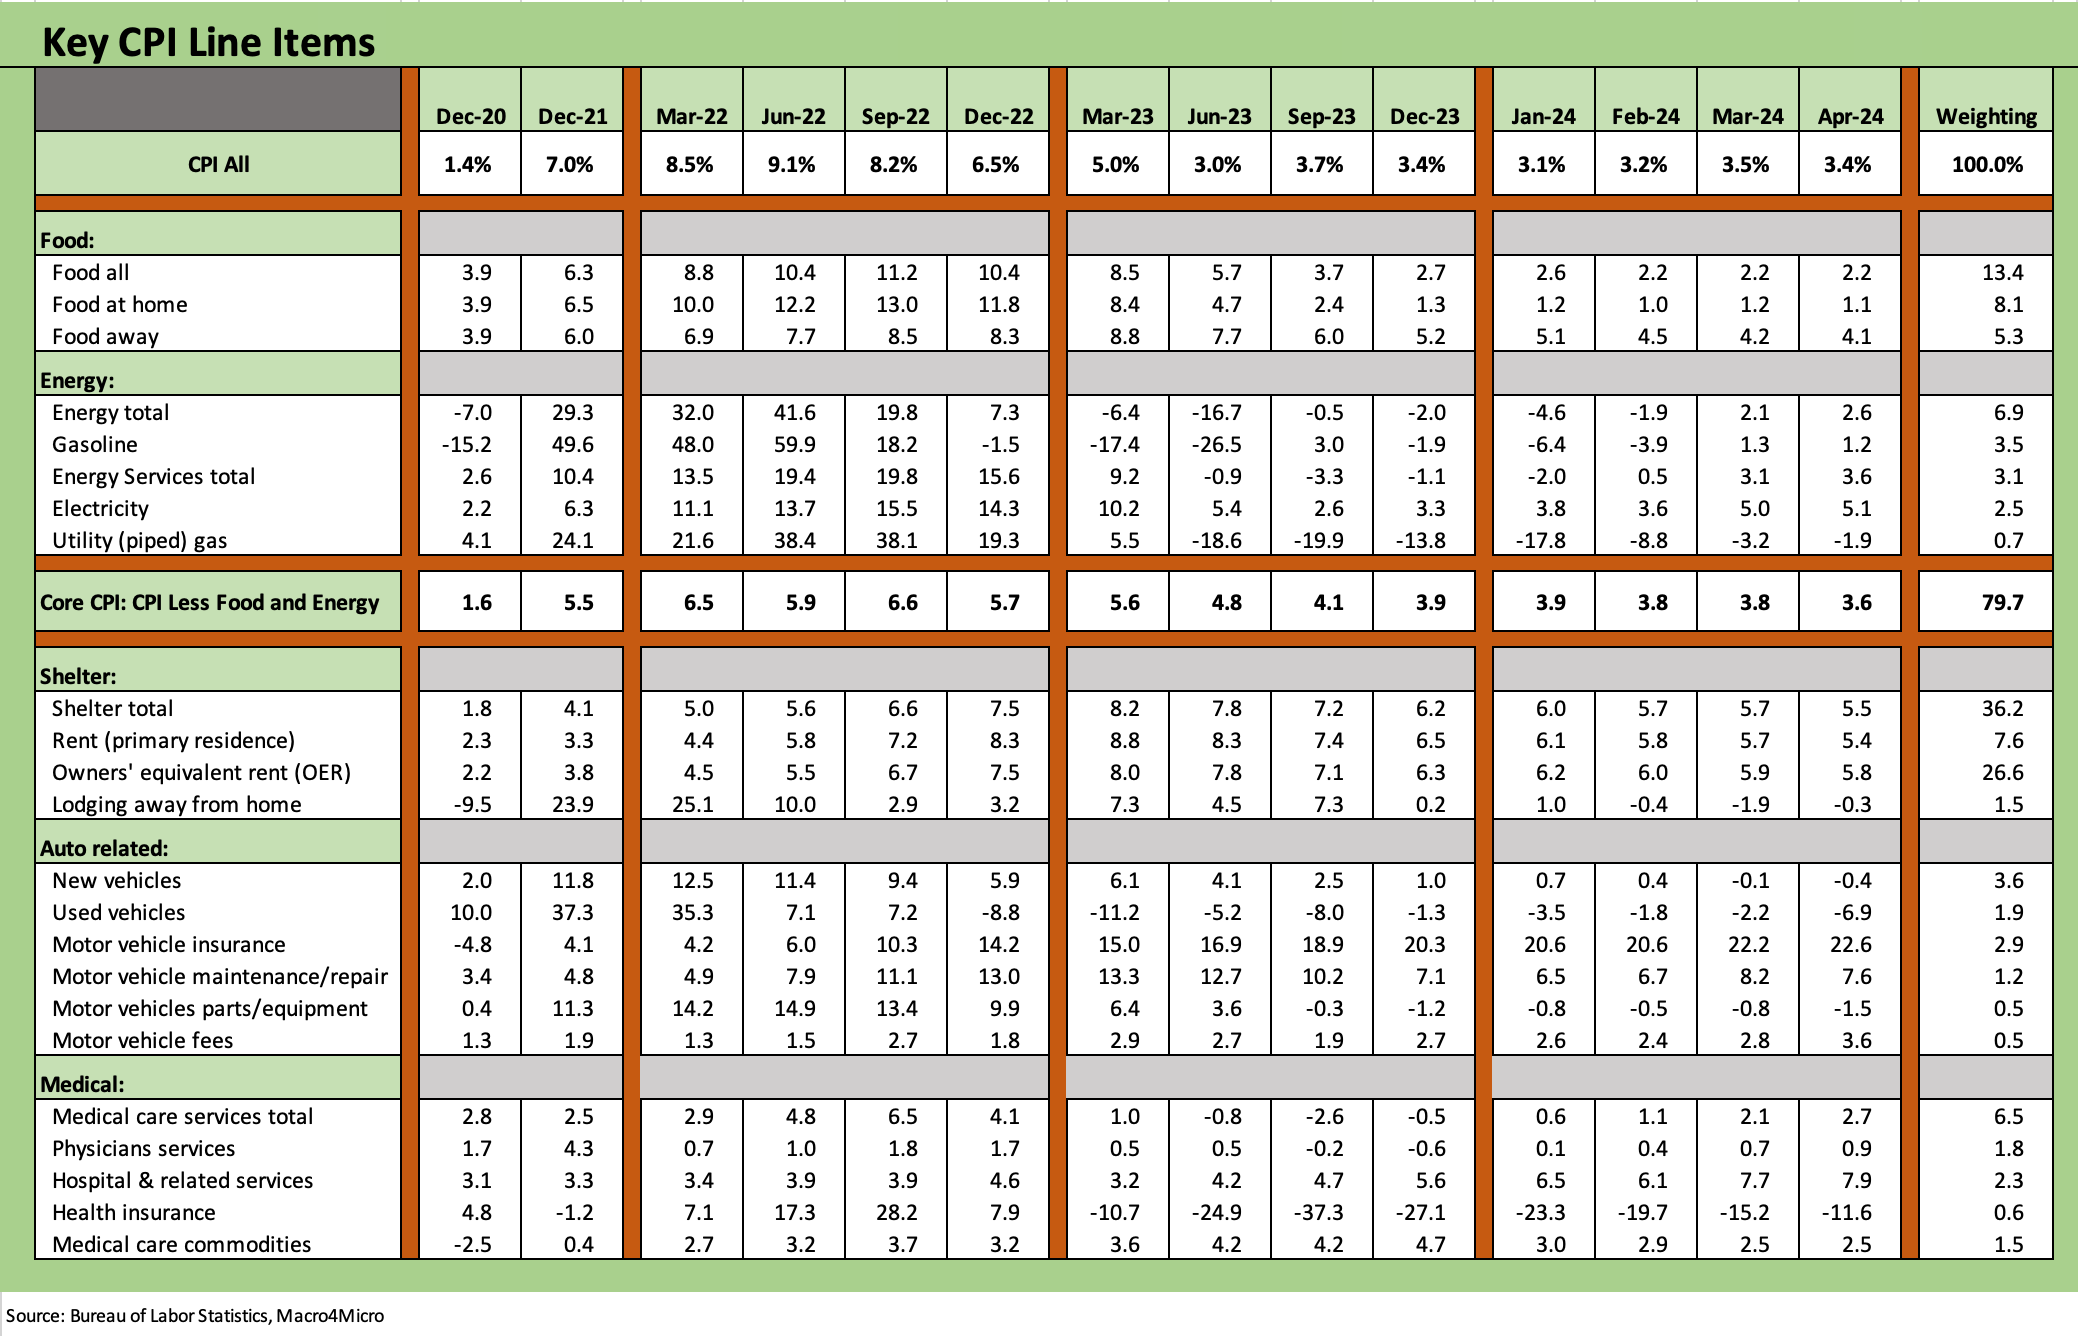
The above chart runs through the main events of the Big 5 on inflation that comprise around 75% of the CPI index. Taken in tandem with the key add-ons we include in the next chart after the Big 5, the two charts cover almost 87% of the CPI index.
Food
Food at home weighed in at only +2.2%, essentially flat to the prior two months and in a different universe than the double digits of 2022. Food away from home of +4.1% edged down sequentially from 4.2%.
Food is the political dagger since it hits everyone directly in terms of household cash flow. Even for the well-heeled, the reaction can be something like “Hey, that $8 bag of coffee is now $16. Wow. Someone will get blamed for that in an election year.” Everyone sees the problem even if the debates around the cause is often incomplete, contrived, dishonest or just plain stupid. Clearly PCE has not suffered from a top-down macro standpoint, but the food CPI line is an emotional one for many that gets revisited every week or even every day.
Those of us who came of working age in the 1970s remember how brutal it was for households at vastly higher interest rates. That is a reminder of why “higher for longer” is not so high when looking back to the Volcker years. It can get a lot worse.
Food has very different dynamics than energy, which can spike and plunge in dramatic fashion. Food inflation can go down, but unlike Energy it almost never deflates in aggregate (see Inflation Timelines: Cyclical Histories, Key CPI Buckets 11-20-23 ). Some food lines deflate (e.g. this month eggs and apples), but the total has a bitter history in cooperating to the downside.
Energy
Energy did a lot of damage across the tightening cycle with Russia-Ukraine and relative discipline by OPEC. However, the natural gas glut that comes with record oil and natural gas production in the US (with a hefty tally of “associated gas” production from the rise of unconventional oil drilling and the Permian boom) has kept some of the CPI in check along the petrochemical chain with natural gas heavy feedstocks. In other words, it could have been a lot worse.
The fact remains that there was record oil and natural gas production printed in 2023 despite the political noise around the term “energy independence” that has seen its definition butchered in political double-talk. The interesting twist is that energy policy has in fact been a brake on energy production, which clearly could have been a lot higher and likely would have pushed prices lower.
If some of the dumb and blind knuckleheads pushing the “Trump made the US energy independent and Biden killed that” theme just use the facts and concepts the right way and play it honestly, they could win the inflation point. That might involve taking some fact allergy pills first and going on a high concept diet.
Shelter
At a 36.2% weighting in the CPI index, Shelter drives the bus on the headline numbers even if many other line items drive more of the consumption patterns for more households. We are a broken record in past notes on our view that OER is a purely theoretical drill that does not drain the bank account of those with no mortgage or a low fixed rate with their house much more valuable today than a few years ago. OER is 26.6% of the index, so it is a distortion. Maybe we should tell the homeowner with no mortgage and a home rising in value to “stop inflating us” (!?).
We have covered this topic in a range of housing sector research and single name work, but the problems in housing right now are rooted in supply-demand imbalances exacerbated by the “Golden Handcuffs” effect that gets discussed in our monthly existing home sales analysis each month. Having a 3% mortgage is a great thing unless you want to move. Homebuilders continue to be the beneficiary of a shift in home sales mix to new vs. existing (see New Home Sales March 2024: Seasonal Tides Favorable 4-23-24, Existing Home Sales March 2024: Not Something Old, Something New 4-18-24).
Autos
April saw deflation on both new and used vehicles. We have addressed some of the volatile trends in used vehicle pricing in our work on the used car dealers (see Carvana: Counterattacking in Style 5-6-24, CarMax FY 2024: Secular Neutral? Or Cyclical Gear Shift? 4-16-24). We also covered the extreme volatility of used car depreciation (that is, the value of the car now vs. when it was purchased) in our recent work on car rentals (see Credit Crib Note: Hertz 5-14-24, Credit Crib Note: Avis 5-8-24).
Some auto deflation on the durables lines is good news, but the repricing of autos in both new and used does not change the major setback in affordability even if we see more months of deflation. The cost of financing is also a grim part of the monthly budget demands with financing rates so much higher. CarMax with its higher quality prime-heavy counterparty customer mix posts contract rates of over 11%. Lower credit quality customers/borrowers in auto finance broadly face much higher rates.
The auto inflation bucket we detail above was our “roll your own” version of auto inflation since it is a far more important part of the consumer life than just what we see in new or used vehicle inflation (see Automotive Inflation: More than Meets the Eye10-17-22). That is even before we factor in the price of gasoline, which we drop in the energy bucket above but makes auto as a household expense even more daunting during times of oil price spikes. Auto insurance inflation remains brutal.
Medical care
Medical care remains well in check overall at +2.7% for services. The same is the case on the “medical commodities” side at +2.5%. We would expect most people would guess those numbers are higher given health care sector labor shortages and inherent tendencies of pharma companies to rip your eyes out and gut your wallets when they can.
Health insurance is also in deflation mode. The health care trends have a big flashing light over them ahead of an election year when the rules of the road in health care in 2025 could be very different depending on who wins. There are not too many John McCains left in Washington who will turn their thumbs down on killing ACA. For many in the Senate and House, the location of their thumbs is somewhat obvious. Some GOP members would cut them both off before bucking their leader’s fixation on killing Obamacare. As of now, there is still no GOP health care platform for 2025. There wasn’t any in 2020 either. The 2016 promise of “repeal and replace” remains a mystery.
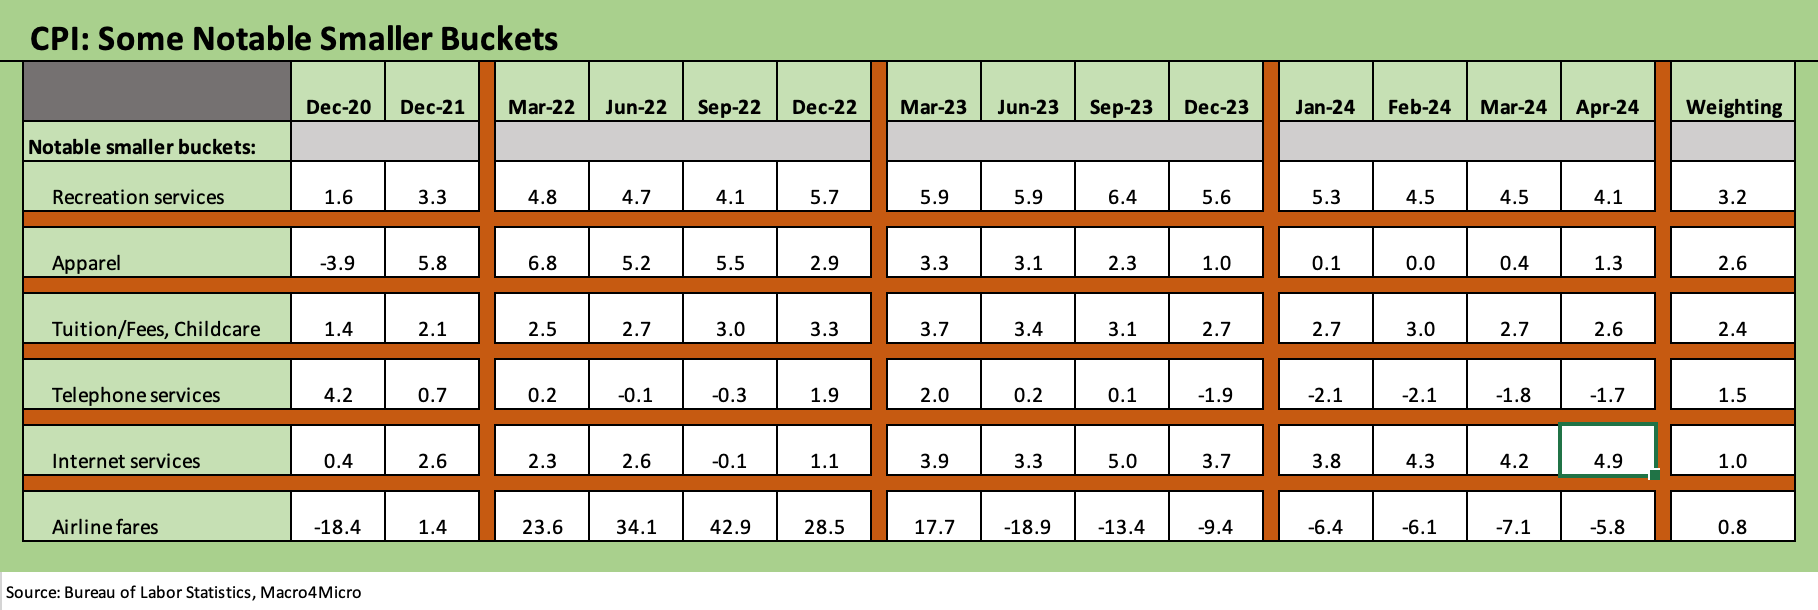
The above chart updates some of the inflation lines near and dear to many households. Two of the lines are in deflation mode YoY still but the overall count on higher vs. lower for YoY trends is 2 posted lower and 4 posted higher (note: 2 of those 4 “higher” are simply a function of less deflation YoY). The only metric in this add-on group over 3% is Recreation Services at +4.1% and Internet at +4.9%. In contrast to the YoY comparison, Internet services did move lower MoM while Recreation Services moved higher MoM.
See also:
Footnotes & Flashbacks: State of Yields 5-12-24
Footnotes & Flashbacks: Asset Returns 5-12-24
Consumer Sentiment: Flesh Wound? 5-10-24
April Payroll: Occupational Breakdown 5-3-24
Payroll April 2024: Market Dons the Rally Hat 5-3-24
JOLTS March 2024: Slower Lane, Not a Breakdown 5-1-24
Employment Cost Index March 2024: Sticky is as Sticky Does 4-30-24
PCE, Income, and Outlays: The Challenge of Constructive 4-26-24
1Q24 GDP: Too Much Drama 4-25-24
1Q24 GDP: Looking into the Investment Layers 4-25-24
Durable Goods: Back to Business as Usual? 4-24-24
Systemic Corporate and Consumer Debt Metrics: Z.1 Update 4-22-24