
Footnotes & Flashbacks: Asset Returns 6-2-24
An eventful, short week saw mediocre weekly asset returns and a mixed UST curve, but the focus was on impressive numbers for May’s scoresheet.


I’ll cross that bridge when I come to it…
If you believe “politics is policy” and sets the economic agenda when the world gets complicated, then the market will need to start sorting out lists of specific economic risks and opportunities for what comes after the election.
The theory is the market is forward-looking (obsessively so with the FOMC), but some topics are still on the shelf such as trade, tariffs, tax policy proposals (e.g., end of capital gains, taxes on buybacks, etc.), and debt ceilings that are the obvious ones to start considering now.
The next wave of variables includes the economic impact of ACA repeal and health care cost impacts for households, the macro fallout from mass deportations, and what a subjugation of the Fed to the White House might mean as these and more will start getting visibility in the handicapping drills ahead.
We roll into the June period ahead of midyear earnings reports (closer to the Election Day than New Year’s Eve 2023), and the US just took a fresh toxicity overdose with Trump’s guilty verdict and more rounds of accusations where the hard fact discussions will get dwarfed by the information wars.
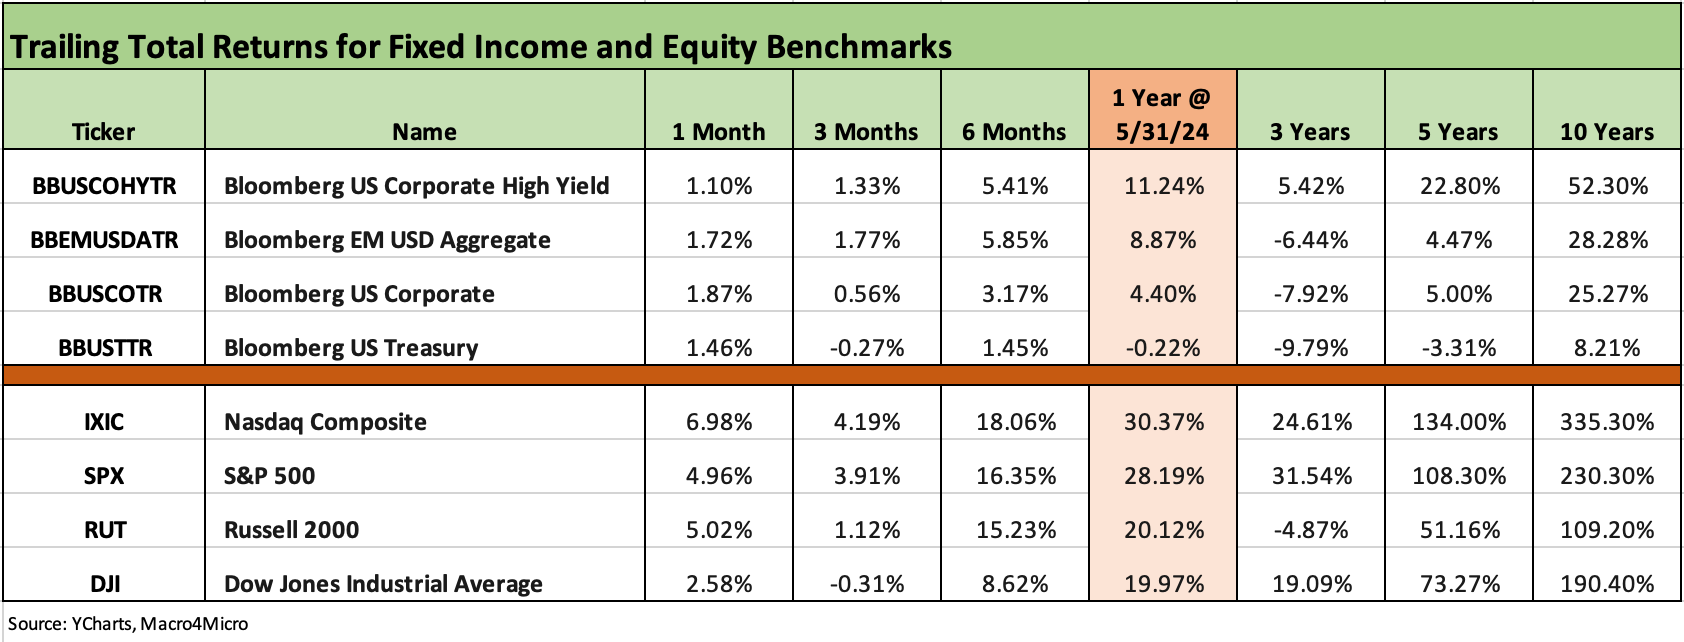
The past week was a wild one in so many ways when what most expected to be a hung jury came back with a sweeping verdict of guilty on 34 counts. The market was mixed for the holiday-shortened week but ended the month on a decent note on Friday. We detail the week in the ETF and benchmark section further below. As noted above our debt and equity high level benchmarks, almost everything is still positive for the trailing 1-month period after not too many weeks ago being all negative as recently as late April (detailed in our 4-26-24 Footnotes publication).
Let the next round of battles escalate…
We are not going to get caught up in the turbotoxins here other than to highlight that such high-level pyrotechnics tend to take attention away from the moving parts of the dismal science of economics and how the political and economic variables interact and overlap with each other. At some point, market risks and sea level economic activity (consumer spending, costs of funding, capex economics M&A opportunities, small business needs, etc.) will start to get handicapped in valuation. The easy way to get around it is to say “it is all baked in.” Too often it is half baked.
Away from war and geopolitics (a mushroom cloud tends to trump tax policy and tariffs, etc.) we have a short list we hope the candidates will opine on and take hard questions on as debates kick in. These are topics for coming months.
Our short list is just the tip of the iceberg even though there are a lot of sector level and industry levels issues as well that will have material credit quality and asset valuation impacts (EV policies, energy infrastructure spending, bank regs, crypto regs, etc.).
ACA repeal and healthcare reform: It would be nice to hear this landmark reform is not a target for repeal since that would be a crushing blow to the finances of so many households. If it is a target, the replacement can’t be “tell ya later.” The consumer debt burden is high enough now from credit cards to auto loans to student loans. Loss of health care or a spike in premiums would tip many into deep spending retrenchment and even bankruptcy. That would hit PCE lines in force and undermine asset quality in the financial system and drive credit contraction. Result: recession.
Trade and tariffs: We spent a lot of time on this topic back in the new NAFTA process (USMCA) and it will be back on the front page with China, generate more stress with Mexico, and inevitably pull in Europe at a time when the President in 2025 might not be a friend of NATO. We were following autos when the first NAFTA was getting rolled in during 1992 and 1993 with bipartisan support (from GHW Bush to Clinton). Tariffs are inflationary, earnings dilutive, and beg retaliation. We will be intrigued to see how this topic surfaces since both candidates are protectionist and want this to be a “my tariff is bigger than your tariff” moment. All we need to do is get Trump and Biden to agree to state the fact that “the buyer pays.” That’s a bigger problem for Trump who claims he collected “billions from China” but the same challenge applies to Biden.
Taxes: The Biden White House is stoking up its tax plan programs with no shortage of talking points already out there. While higher taxes are opposed by many and billionaires’ minimum taxes are opposed by few (but those with many dollars), among the least favorite for many in the markets is the tax on stock buybacks. That starts to be a genuine target for rightful accusations of socialism since it looks like an attack on owners’ property rights (shareholders own the company) and redirects the owners rights to some crew of progressives who usually cannot peel back even to a second layer (forget a third or fourth layer) on the economic multiplier effects. You often only get 5 minutes to speak in Congress. That encourages doing less homework on topics. Higher corporate taxes and progressive tax structures do not raise the ideological flags that we see in a tax on buybacks. In this rare case, “socialism” would be a very fair accusation.
Another one that flies lower off the headline radar screen is the deemed realization taxes on death that will be a dagger in the small business private equity asset class and hammer entrepreneurial economics and risk. That is a story for another day. This gets swept up in the wave of private credit and how private companies and small to medium sized enterprises will get treated. Yellen’s attempt to run a misdirection play on “farm and family-owned businesses” is an attempt to distract from the attack on small businesses with illiquid equity stakes.
Imagine the typical entrepreneur with children. Upon a parent’s death, they get presented with a major cash tax bill on a highly illiquid asset with no market. As a teacher, non-profit employee, or someone in the arts gets handed this stock from a dead parent they get a cash tax bill. Small business planning cannot include the need for a personal rule that “I just won’t die.”
Subjugation of the Fed: The street needs to tread carefully in politics, but there is a new reason to lay low with the Trump plan (a story broken by the not-so-liberal Wall Street Journal) to eliminate the independence of the Fed and have the Fed subject to White House and UST oversight. The idea of a real estate mogul (perhaps the most rate-sensitive large scale asset class in the markets) dictating rates is not too hard to see as the Mother of All Conflicts of Interest. The banks will not be comfortable with tweaking client sensitivity on this topic regardless, but the banks (and how it delivers topical research) will also face the potential that the White House (vs. the Fed) will end up as their direct overlord. The fact that many of these banks stopped lending to Trump companies is not an aphrodisiac at this point either. If you control the guns and the money, you have a serious amount of power at that point (Just ask Xi and Putin).
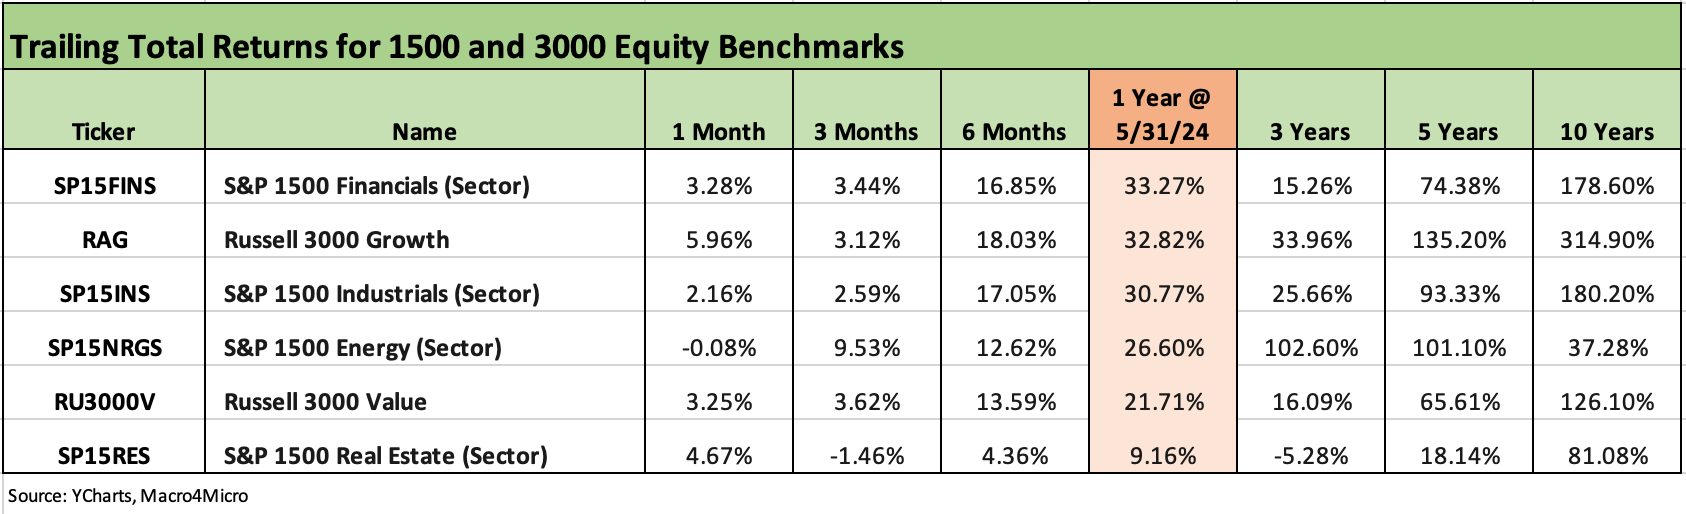
The above chart updates the 1500 and 3000 series, and we line them up in descending order of 1-year total returns. The 1-year numbers jump off the page with Financials now just ahead of Growth for this cut of the timeline after the turmoil of last spring gave financials some bruises (notably regionals). Seeing a 30% handle on returns for Financials, Growth, and Industrials certainly undermines the theme that asset returns and the risk rally are “all about tech.”
At least for the trailing 1 year, Energy and Russell 3000 Value are just behind the leaders at numbers that are more than double the long-term return on the equity asset class even in the face of higher rates and a tightening cycle. Energy will remain as volatile as always, but the Real Estate asset class will remain on everyone’s watchlist for the lumpiness of bad news. Real Estate gets wagged heavily by the UST curve. The easy variable that generates more optimism on real estate is if rates move lower (hold that thought around the Trump plans for the Fed).
The rolling return visual
In the next section we get into the details of the 31 ETFs and benchmarks for trailing periods. Below we offer a condensed 4-chart view for an easy visual before we break out each time period in the commentary further below. This is a useful exercise we do each week looking for signals across industry groups and asset classes.

The above chart highlights that we ended the week with just under half the 31 ETFs and benchmarks in negative range. That is when it is easier to pull back and cite the “best May since May 2009 for the S&P 500.” As a reminder, June 2009 was the cyclical trough (March 2009 the S&P 500 low) and the auto industry was collapsing but bank bailouts were working. By May 2009, oil had rallied off its collapse from triple digits (summer and early fall 2008) to the $30 range in early 2009 and then back to the high $60s in May 2009.
The very favorable symmetry of returns in the above chart are easy visuals for 1-month, 3-months, and 1 year. As we detail further below, we see only 2 names in the red (both in energy) for 1-month, a mixed bag of 7 line items in the red for 3-months including 2 bond ETFs, and only 2 in the red for the trailing year (both are bond ETFs).
The Magnificent 7 heavy ETFs…
Some of the benchmarks and industry ETFs we include have issuer concentration elements that leave them wagged by a few names. When looking across some of the bellwether industry and subsector ETFs in the rankings, it is good to keep in mind which narrow ETFs (vs. broad market benchmarks) get wagged more by the “Magnificent 7” including Consumer Discretionary (XLY) with Amazon and Tesla, Tech (XLK) with Microsoft, Apple, and NVIDIA, and Communications Services (XLC) with Alphabet and Meta.

We recently added the above chart to the weekly so we can track the headline mega-names and see which might have wagged certain ETFs or the broader capitalization weighted benchmarks. We line up some of the major large cap Tech-centric names in descending order of total returns for the most recent week.
We include the S&P 500 and NASDAQ along with the equal weighted NASDAQ 100 Equal Weighted ETF (QQEW) and the S&P 500 Equal Weighted ETF (RSP). A table of the big tech names from the Mag 7 to the broader collection of “headline types” streamlines the weekly review if one of the big ETF names is impacting performances.
This past week was not as kind to the broader mix of bellwether tech names with only two in positive territory in NVIDIA and Apple. We see 5 of the Magnificent 7 in the red for the week but with only Tesla negative for the 1-month period. Tesla is also in the red for 3 months, 6 months, 1 year, and 3 years. We see the 3-month period as more mixed for this group while 6 months is still all positive ex-Tesla.

The 1-week scoresheet shows the group of 31 weighing in at 17-14 in a mixed performance. We see 4 of the 6 bond ETFs in the red as a moderately adverse UST curve saw long rates rise slightly and short rates decline slightly.
Tech was sloppy on the week as evidenced in the Tech ETF (XLK), the Equal Weighted NASDAQ 100 ETF (QQEW), and NASDAQ (IXIC). TLT was the worst of the bond ETFs given the more notable move higher over the week in long UST. The HY ETF was able to barely edge across the line into positive range with EM Sovereigns just above at +0.1%.
The winners on the week included energy names with E&P (XOP) and Energy (XLE) at #1 and #2. Energy prices were moderate, but more M&A hit the headlines. Utilities (XLU), Real Estate (XLRE) and BDCs (BIZD) rounded out the top 5.
As we cover in our separate Footnotes publication on yields (to be posted later today), the week’s economic releases did not tell much of a catalyst story for inflation in the PCE release on Friday in terms of inflation metrics (see PCE, Income and Outlays: Lower Income and Consumption, Sideways Inflation 5-31-24).
The details on Income and Outlays did raise some questions on signs of consumer appetites trailing off, however, and that followed right on the heels of the second 1Q24 GDP estimate (see 1Q24 GDP: Second Estimate, Moving Parts 5-30-24), which posted a downward revision on the PCE line. That was a very different outcome from what we saw in the PCE revisions for 4Q23 (see 4Q23 GDP: Second Estimate, Moving Parts 2-28-24, 4Q23 GDP: Final Cut, Moving Parts 3-8-24).

As noted earlier, the 1-month timeline caught more headlines as a very healthy range of returns set off the usual lookbacks at the “sell in May, then go away” school of thought. We only see Energy (XLE) slightly in the red at -0.34% and Midstream (AMLP) at -0.2%. On a positive note, we see all bond ETFs in positive range with TLT even making it into the middle of the second quartile.
Looking at the top quartile, the fact that NASDAQ (IXIC), Russell 2000 small caps (RUT), the S&P 500 (SPX), and Midcaps (MDY) are all in the mix is a favorable statement on breadth and earnings expectations. The fact that Utilities (XLU) is sitting on top in such a strong month is a hard one to explain with so many moving parts in the cycle. XLU mixes defensive with interest rate sensitive.

The 3-month score of 24-7 has a very mixed bag in the negative zone with the cyclical Transports (XTN) on the bottom and Consumer Discretionary (XLY) second to last with material weakness in Tesla and Home Depot. The long duration 20+ UST ETF (TLT) is 3 off the bottom with Real Estate (XLRE) slightly less negative. The Equal Weighted NASDAQ 100 ETF (QQEW) is in the red in a sign of a lack of breadth for tech and the NASDAQ (IXIC) in the upper end of the second quartile.
For the leaders over 3 months, we see Base Metals (DBB) at #1 with a lot of headlines around bullish commodities bets and Utilities (XLU) a close second and well ahead of #3 for the BDC ETF (BIZD) and Energy (XLE) and E&P (XOP) rounding out the top 5.
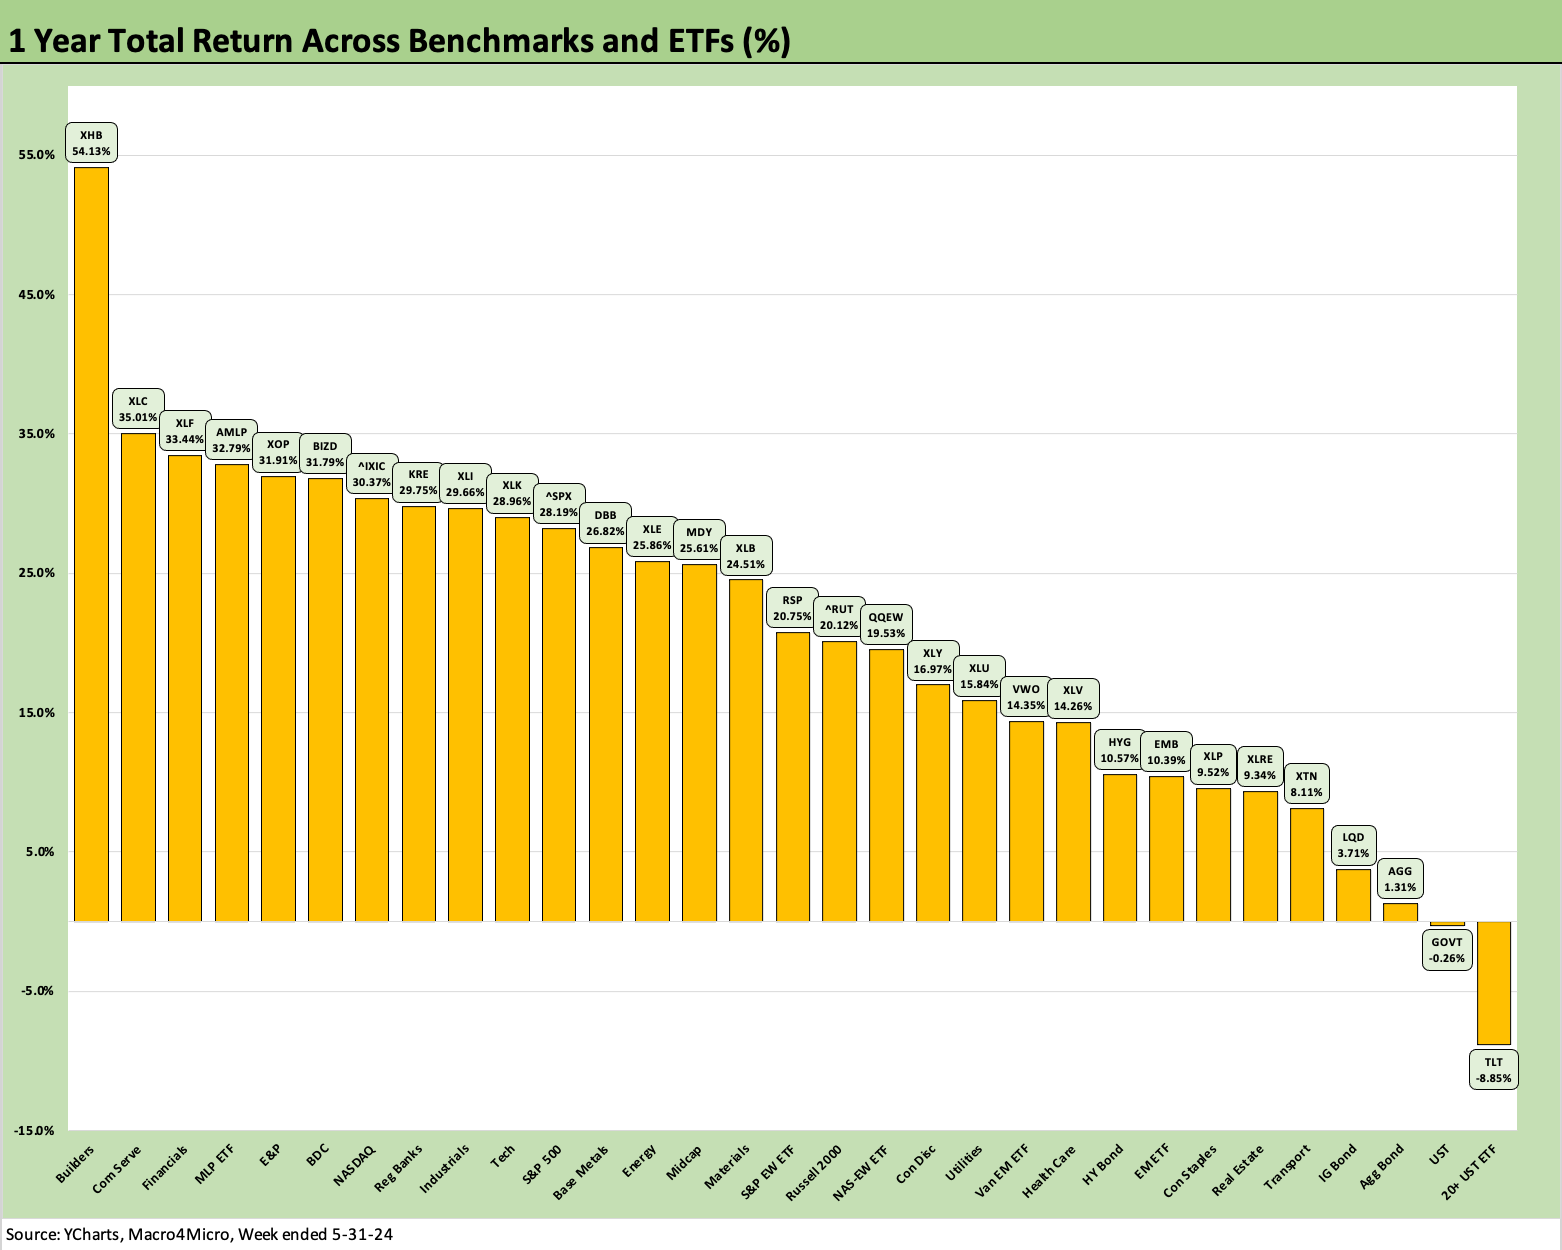
The trailing 1-year has not moved around materially in the upper ranks with the Builders (XHB) still on top and a diversified mix at a distant #2 starting with Communications Services (XLC) followed by Financials (XLF), the high income and less volatile Midstream sector (AMLP) and E&P (XOP) at #5.
The only two in negative range are the UST bond ETFs with long duration TLT in last at an ugly -8.8% and GOVT at a slight negative of -0.26%. The bottom 4 are all bond ETFs with 5 of the 6 bond ETFs in the bottom quartile.
The week ahead…
This coming week we have payroll headlines with JOLTS on Tuesday and Payroll on Friday. The market is still wrestling with consumer behavior and the past week brought only a few more data points on the direction of the cycle as we discussed in the PCE piece and updated GDP commentary (see links at bottom).
Along the way, we will see June 6 as a notable day worth pondering in the mix of all the hate, ignorance, dishonesty, and evidence of authoritarian leanings in the headlines each day. June 6 was of course D-Day and the allied landings at Normandy.
It is certainly worth giving some consideration to the events of that time and the battle against the Austrian Corporal who brought tens of millions of deaths to the world. He had failed in his Munich Beer Hall gambit in 1923 where that other dictator (the Italian one) had succeeded in his March on Rome in 1922. Both of those two authoritarians fought in WWI battles and knew violence first-hand and were ringside for the costs of war. They both make for interesting frames of reference in the age of Jan 6 (see Lucid Substack for some important expert topical research).
Those were critical junctures in history that are worth considering. For those keeping score at home, the United States was started before Germany or Italy were unified. That makes America the grown-ups as we approach 250 years in 2026. That is hard to tell some days. The short guy with the “gas mask stache” and the bald guy failed in the end. But they started small scale.
See also:
PCE, Income and Outlays: Lower Income and Consumption, Sideways Inflation 5-31-24
1Q24 GDP: Second Estimate, Moving Parts 5-30-24
Footnotes & Flashbacks: State of Yields 5-27-24
Footnotes & Flashbacks: Asset Returns 5-27-24
Memorial Day: Ponderings for Donny the Dodger 5-26-24
Durable Goods: Staying the Cyclical Course 5-24-24
New Home Sales April 2024: Spring Not Springing Enough 5-23-24
Industrial Production April 2024: Another Softer Spot 5-16-24
Housing Starts April 2024: Recovery Run Rates Roll On 5-16-24
CPI April 2024: Salve Without Salvation 5-15-24
Retail Sales April 2024: Get by with a Little Help 5-15-24
Consumer Sentiment: Flesh Wound? 5-10-24
April Payroll: Occupational Breakdown 5-3-24
Payroll April 2024: Market Dons the Rally Hat 5-3-24
Employment Cost Index March 2024: Sticky is as Sticky Does 4-30-24
Systemic Corporate and Consumer Debt Metrics: Z.1 Update 4-22-24