
PCE, Income and Outlays: Lower Income and Consumption, Sideways Inflation
Some support on the fundamental signals, but inflation stays stubborn and sticky.


The MoM inflation story was flat for the PCE price index with MoM Core PCE down very slightly while YoY was flat sequentially for both headline and core PCE in what overall was a sideways story on inflation for this month’s PCE release.
The primary relief on the inflation story was indirect via MoM income and consumption patterns with current dollar personal income and personal consumption expenditures down sharply MoM while real PCE YoY was down sequentially to +2.6% vs. March at +2.8%.
Real Goods consumption in April ticked lower YoY to +2.6% vs. March at +2.8% while real Services consumption ticked higher to +2.9% YoY vs. March at +2.8%, so the Services demand as a sticky inflation factor still lurks even if sequentially the Services PCE price index MoM ticked down from +0.4% in March to +0.3% in April.
Real PCE for Goods and Services is still well ahead of real Disposable Income growth of +1.0% YoY with the savings rate ending up flat at +3.6% for April, unchanged from the (materially revised) March lows.
The “fed funds minus core PCE differential” (using effective fed funds) remains around double the long-term median, so there is no escaping the reality that the FOMC remains restrictive in historical context. The easing debate continues but the 2.0% target is no easy task.
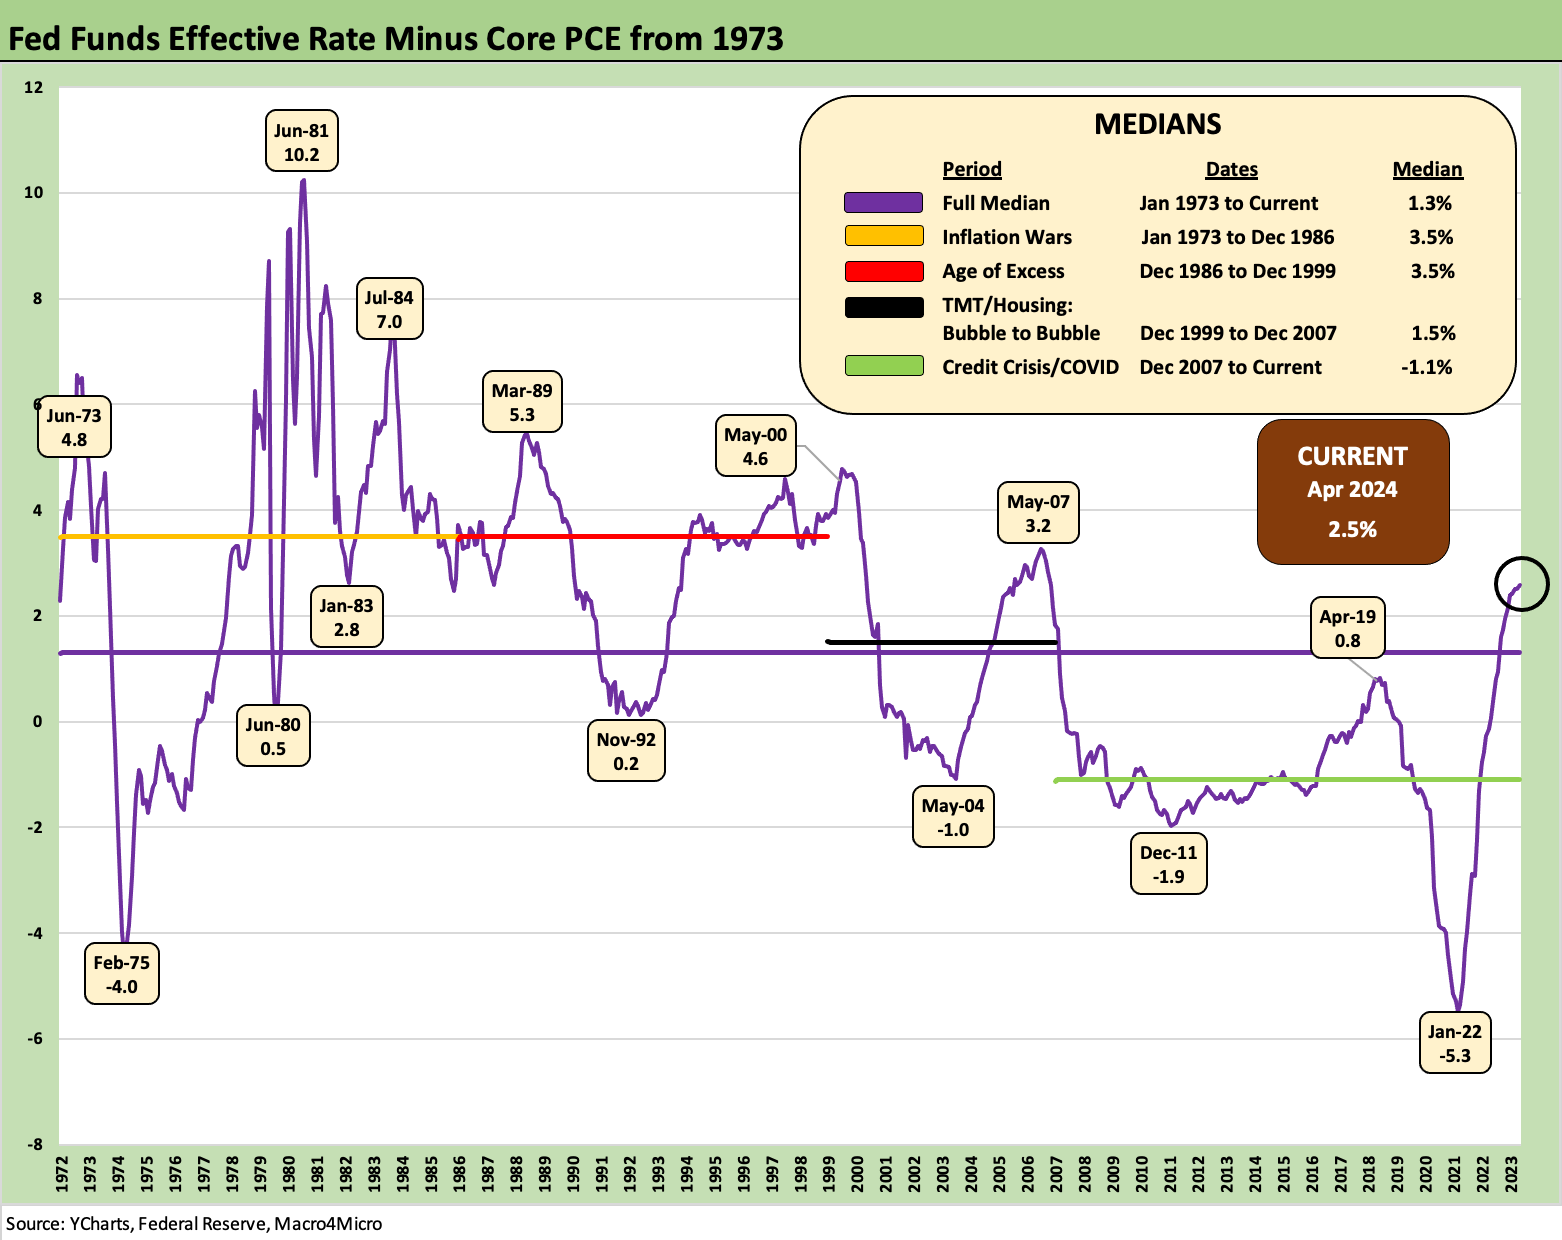
The chart above details real fed funds by framing effective fed funds rate vs. core PCE. This time series gives some historical context to how restrictive the FOMC is today vs. other periods across the cycle. An important point is that real fed funds are not anywhere near the early/mid 1980s or for that matter relative to some later highs in the differential such as the late 1980s and the late TMT cycle. In the end, the focus on inflation still rules these days, and the consumer income and outlays trends carry a lot of weight with the FOMC and the market on “consumer watch.”
While we were listening to some of the favorable feedback on today’s inflation numbers being bandied about on the business news channels, we don’t see much incremental progress in the overall inflation numbers. At least April was not a setback. The better news came out of the income and consumption moves sequentially.
Personal income in current dollars slid MoM to +0.3% from +0.5% in March and below the +1.1% of January. Personal Consumption Expenditures in current dollars was down MoM to 0.2% from +0.7% in March and deflated at -0.1% in chained dollars (2017). Real Disposable Income YoY in April dropped to +1.0% from +1.3% in March. That +1.0 % is lower than the fall 2023 and YTD monthly numbers.
Real PCE on the consumption side shows real Goods consumption YoY down to +1.9% from +2.8% in March. For Services, the same bucket showed real Services consumption at +2.9% YoY, up from +2.8% in March. The +2.9% YoY for Services is higher than the Sept 2023 to Dec 2023 numbers and the highest YTD.
The mix of data left us a bit perplexed hearing the cable crowd extrapolating from the MoM downtick in Services inflation from +0.4 to +0.3% as the good news without the broader mix of price index trends. That MoM move was a positive downtick, but the Services line is still the bigger inflation problem in the “last mile” journey.
The PCE numbers on the consumption side saw some downward revisions in PCE in this week’s second estimate for 1Q24 GDP (see 1Q24 GDP: Second Estimate, Moving Parts 5-30-24). On a side note, the market saw some dismal Chicago PMI data today with that metric hitting a 4-year low and 6 months of contraction range. The FOMC handicapping still shows the market moving away from the most bearish hawk scenarios, and the consumer is always going to be the linchpin.

The next series of charts run through our usual monthly collection that come with the PCE release. The above chart plots the timeline of PCE vs. Core PCE since 1997 as the market was running into the TMT cycle peak in the bull market 1990s. We see medians of +1.9% for PCE and +1.7% for Core PCE. When people ask “How can 2.0% be the target?” this period offers one set of data points. The 1980s was a market that really had not shaken the full effects of inflation anxiety (especially inflation fixation and the economic pain fresh in the mind of markets and the Fed). The low inflation 1990s after the Greenspan hyper-easing of the early 1990s had changed the mindset somewhat. This latest cycle has sent many scrambling back to the lessons of the 1970s and early 1980s. We have covered those periods in other commentaries.

The above chart uses the long-term timeline from 1972, and this chart shows how hard it is to get to 2.0%. We see +2.6% as the median PCE and +2.4% for core. As noted in the chart at the top, the restrictive policies of the Fed as reflected in fed funds were far more aggressive than today even long after inflation had buckled.

The above chart updates the PCE vs. Core PCE differential since that has really swung around over the years and notably on the Energy part of the equation. The long-term median on the differential is zero with April 2024 at -0.1%, down from the 2022 high of +1.9 % with the oil spike and well above the negative numbers when oil prices crash.
As we have laid out in other commentaries (see Inflation Timelines: Cyclical Histories, Key CPI Buckets 11-20-23), oil can dramatically whip around and reshape the headline vs core relationship, but food rarely deflates in aggregate even if some line items can demonstrate commodity like volatility. Food inflation can plunge but when it rarely deflates it is not by much.
That stubborn downside price history in the grocery store aisles is where the voter punishment comes into play as both Carter (1980) and Ford (1976) experienced. Biden could very well be next on that score. History is not kind even with very few data points in the postwar era. No matter how you debate the underlying causes of inflation, the judges are the ones in the checkout line.

The above chart updates the MoM % change from Jan 2022 for monthly disposable income (DPI) and monthly personal consumption expenditure (PCE) changes. We shorten up the timeline to frame the tightening cycle behavior and the steadiness of positive trends for the consumer that has kept the cycle rolling.
We exclude 2021 (addressed in the next chart) from the above chart since that was a timeline with all the wild swings from COVID and stimulus payments flowing into income stats and consumer reactions in spending. That would mess up the visual scale in the above chart.
We already covered the monthly stats above, and we also break them out across time in a chart below. The main takeaway is that the medians over this time horizon for DPI and PCE were close. We see DPI at +0.4% and +0.5% for PCE with the latest move a decline. We also see distortions happen along the way.

The above chart expands the same time series horizon from 2019 to current to underscore how dramatically the stimulus plans flowed into the numbers. We covered the stimulus swings in DPI and PCE in an earlier commentary (see Inflation Rorschach Test: Looking at Relief and Stimulus 2-7-23).
Pure stimulus for the consumer influences the spending patterns, and the effects had to be framed against severe supply-side distortions and problems. As the chart shows, the tight range at low month-to-month levels resumed quickly. We break out the monthly histories in the next chart.

The above chart updates the monthly history of DPI vs. PCE for some scanning and context. The Path to April shows the DPI trending lower while PCE is more erratic but well below the past two months.

The above chart updates the low savings rates now down in the sub-4% zone. We show some highs and lows. We look at this topic each month and in a more focused earlier commentary (see Savings Rates: Context Across the Cycles 10-27-23).
See also:
1Q24 GDP: Second Estimate, Moving Parts 5-30-24
Footnotes & Flashbacks: State of Yields 5-27-24
Footnotes & Flashbacks: Asset Returns 5-27-24
Memorial Day: Ponderings for Donny the Dodger 5-26-24
Durable Goods: Staying the Cyclical Course 5-24-24
New Home Sales April 2024: Spring Not Springing Enough 5-23-24
Industrial Production April 2024: Another Softer Spot 5-16-24
Housing Starts April 2024: Recovery Run Rates Roll On 5-16-24
CPI April 2024: Salve Without Salvation 5-15-24
Retail Sales April 2024: Get by with a Little Help 5-15-24
Consumer Sentiment: Flesh Wound? 5-10-24
April Payroll: Occupational Breakdown 5-3-24
Payroll April 2024: Market Dons the Rally Hat 5-3-24
Employment Cost Index March 2024: Sticky is as Sticky Does 4-30-24
Systemic Corporate and Consumer Debt Metrics: Z.1 Update 4-22-24
Credit Markets Across the Decades 4-8-24
Credit Cycles: Historical Lightning Round 4-8-24
Inflation Timelines: Cyclical Histories, Key CPI Buckets 11-20-23
Savings Rates: Context Across the Cycles 10-27-23