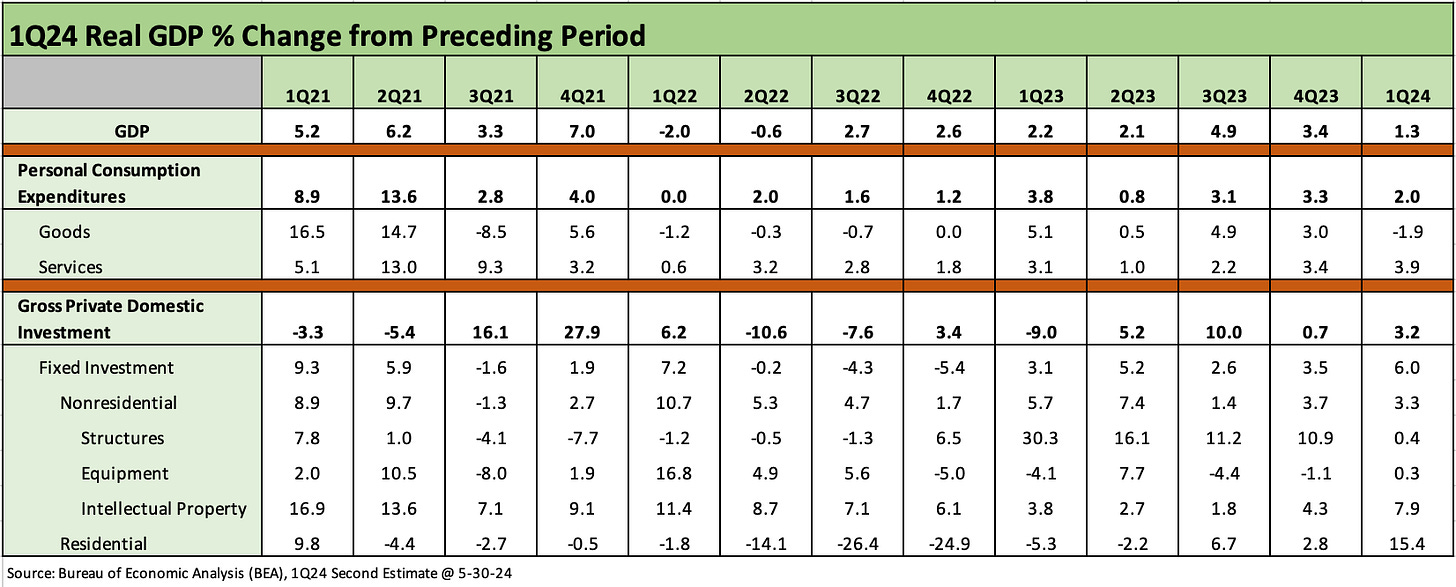
1Q24 GDP: Second Estimate, Moving Parts
The second estimate helps the “no hikes” story and offers some minimal, incremental support to the ease school.
Still in the game at 1.3%…
The modest downward adjustment to +1.3% at the headline GDP level from +1.6% was tied to the PCE line moving from +2.5% to +2.0% with +2.0% PCE still well above the worst quarter of 2023 when we saw +0.8% in 2Q23 as well as above 3 of 4 quarters in 2022.
The Gross Private Domestic Investment (GPDI) line was unchanged from the advance estimate at +3.2% with all lines positive and residential even higher in double digits at +15.4%.
The Government Consumption/Investment line ticked slightly higher to +1.3% from +1.2% with Federal negative but State and Local revised higher by +0.6% to +2.6% (state and local economy litmus test looks good).
The primary add-on adjustments that can swing the low GDP numbers (trade deficits and private inventories) only saw their negative GDP contribution rise from a combined -1.21% to -1.34% for a minimal additional haircut of -0.1% to headline GDP from the advance estimate.
The revisions of 1Q24 serve as some small amount of good news for ease advocates and UST bulls only in that the PCE number was lower. We get the latest PCE (Income and Outlays) tomorrow, and that will be a more timely indicator of how 2Q24 trends are heading in the consumer sector. We will also see how that flows into the Fed’s favorite PCE inflation metric. The PCE price index for 1Q24 was revised down by -0.1% to +3.3%. The market appears focused on consumer behavior patterns for good reason, but the GPDI investment numbers are still going strong in the revisions above.
The second estimate adjustments to 1Q24 GDP were notably different than the second estimate that came after 4Q23 GDP since last quarter saw bigger moves (see 4Q23 GDP: Second Estimate, Moving Parts 2-28-24). Besides a headline adjustment downward of -0.3% at the headline level, today’s release showed a material decline in the PCE line from +2.5 to +2.0%. The 4Q23 revision adjusted PCE higher to +3.0% from +2.8%. Then it went up again in the 4Q23 final numbers.
We break out the other deltas along key GDP line items and subcategories above. Besides the PCE line, the most notable line for us is the big downward revision in Goods and notably Durables. The stickiness of Services demand with Services growth at +3.9% also feeds into the most challenging part of the inflation story. GPDI was flat and Fixed Investment higher. The only GPDI line to revise lower was Equipment.
The above chart gives the longer timeline for GDP metrics that roll into the current revised numbers. The market is a long way from the two negative quarters of 2022 (1Q22, 2Q22) as the inflation shock was moving into the tightening cycle.
For Fed watchers, the debate is still up in the air. Our view has always been it is hard to have a recession with positive PCE and a consumer that wants to spend and does not blow up its own balance sheet (as in the housing bubble). The market in 2022 wanted to shout recession with low unemployment and solid PCE (see Unemployment, Recessions, and the Potter Stewart Rule10-6-22) That is where a forecast is different from the reality on the ground.
See also:
4Q23 GDP: Final Cut, Moving Parts 3-8-24
4Q23 GDP: Second Estimate, Moving Parts 2-28-24
4Q23 GDP: Strong Run, Next Question is Stamina 1-25-24
GDP and Fixed Investment: Into the Weeds 1-25-24
3Q23 GDP Final Cut: Swing and a Miss on 5%, Good Contact on PCE Prices 12-21-23
Tale of the Tape in GDP: Trump vs. Biden12-4-23
3Q23 GDP: Fab Five 11-29-23
Fixed Investment in GDP: The Capex Journey 10-30-23
GDP 3Q23: Old News or Reset?10-25-23


