
Existing Homes Sales April 2024: Pay More, Get Less, but More Available
Another round of subpar existing home sales shows prices and inventories both rising but sequential declines in sales volumes.


A rise in inventory helps a bit on availability but higher prices and stubborn mortgages are still making life difficult for the lower price buyers and first timers.
The “tenth consecutive month of year-over-year price gains” at +5.7% for April (to $407.6K) was an eye-catcher, but the good news for those able to buy was that unsold inventory rose by 9% sequentially and +16.3% YoY.
Positive home equity just got more positive for many homeowners who plan on staying put, but the golden handcuff factor (or “locked-in effect”) is still very much in place and continues to help builders gain in the overall share of total home sales in 2024.

The above chart updates the trend line for YoY increases/decreases for existing single family homes by price tier. We look at this more narrowly for the month in a chart at the end of this commentary, but the main trend has been upward in YoY volume deltas as potential buyers and sellers alike capitulate on the reality of mortgage rates. Other tailwinds are sustained job additions across the monthly payroll counts, rising wages, and more time to accumulate a down payment.
With inventory rising off the lows (but still low in historical context), there is also more to choose from. In a week when Toll Brothers just weighed in with banner earnings on the new homes side of the ledger, their numbers (at a cool $1 million average price for their most recent quarter) and the chart above highlight the strength of the high price tiers in this market. We see the top 3 price tiers growing the most and in double digits while the largest slice of the market (the $250K to $500K or 45% of the market) is at +7.6%. That +7.6% in fact marks major progress.
Growth in those price tiers still reflects YoY improvement and is a net positive for macro trends. While new homes have more multiplier effects across the economy, existing home sale transactions ring many cash registers as well. The residential investment lines of 1Q24 GDP were more impressive (see 1Q24 GDP: Too Much Drama 4-25-24), and we get a fresh set of revisions on those GDP lines next week with the second GDP estimate.
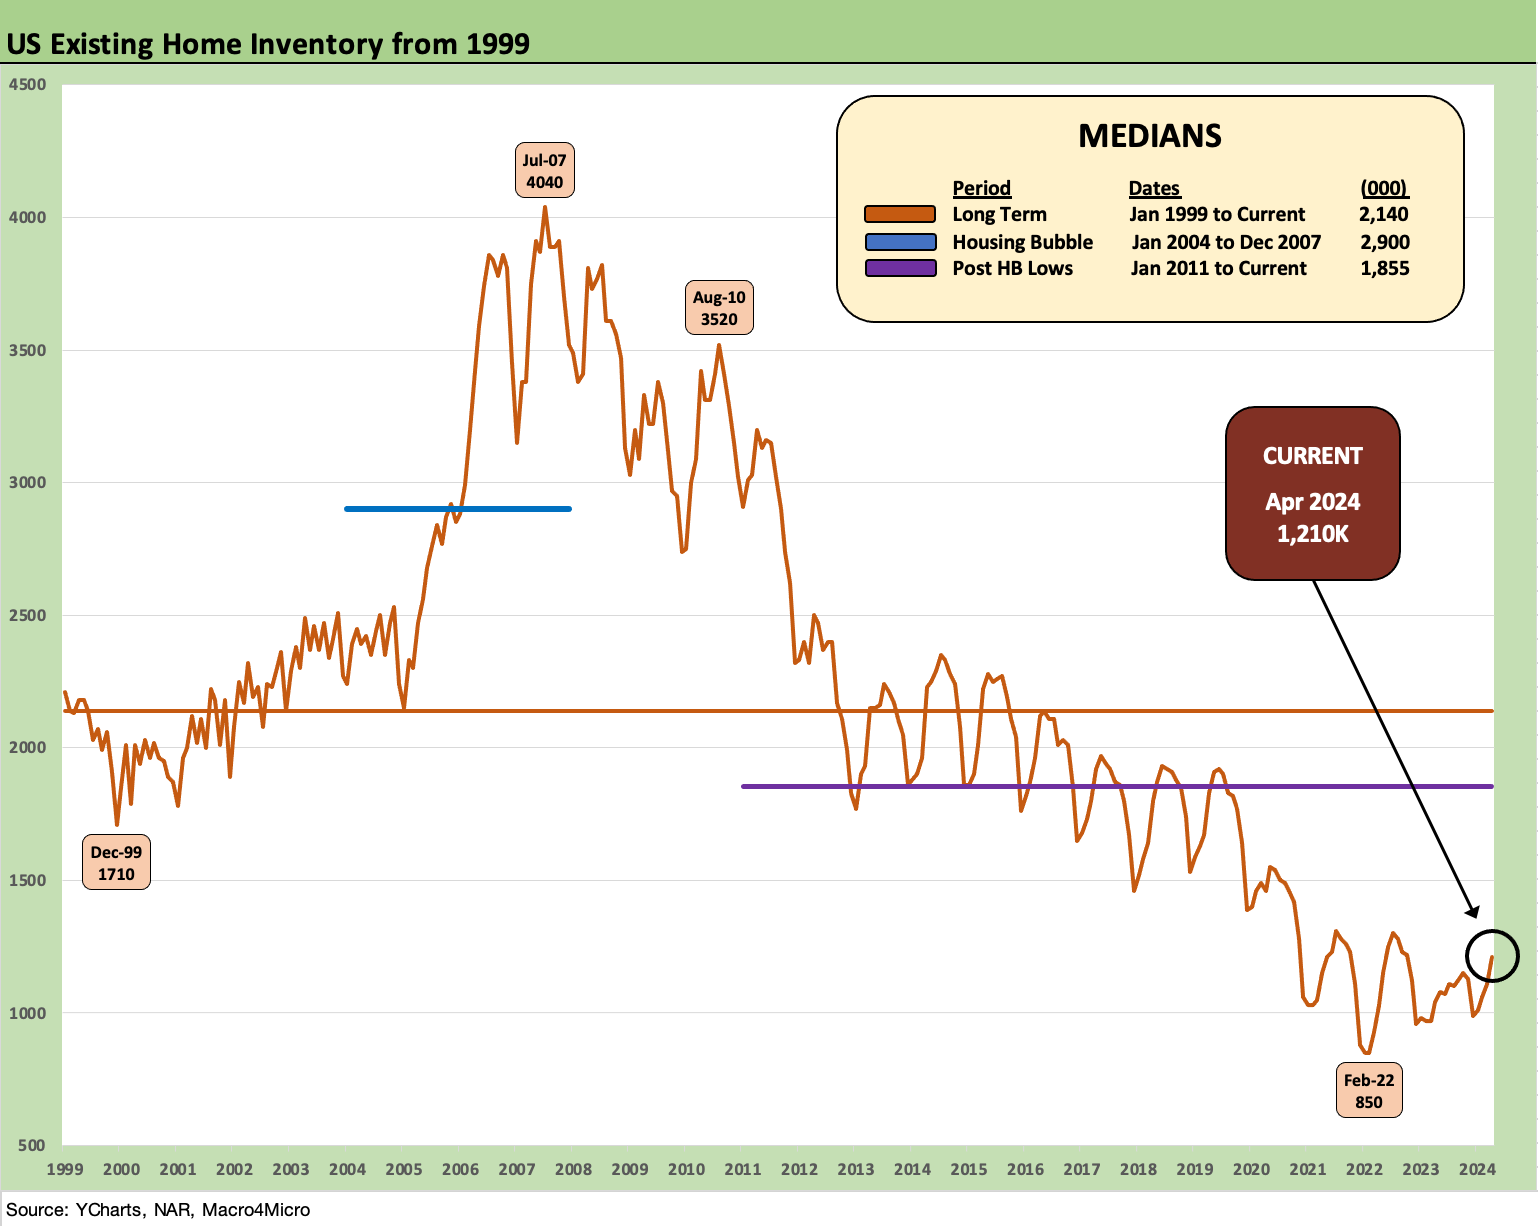
The above chart updates the time series for inventory levels, and the market remains dramatically below the long-term median (2140K) and well below the post-housing crisis median (1855K). The mortgage rate headwinds for buyers across price tiers remain a fact of life at higher home prices, but the constraint is especially the case for sellers sitting on low mortgage rates. That golden handcuff/locked-in effect is not going away during this peak housing season and will remain a distorting factor in the supply-demand dynamics.

The above chart updates the time series for existing home sales vs. new home sales in a two-sided chart. The latest new home sales stats will get updated tomorrow ahead of the holiday weekend. The theme of market share gains of total home sales by builders has been a recurring theme (see New Home Sales March 2024: Seasonal Tides Favorable 4-23-24). More existing inventory could open up a path to higher total sales overall using both existing and new, but April showed slightly less existing sales volumes despite the inventory growth.
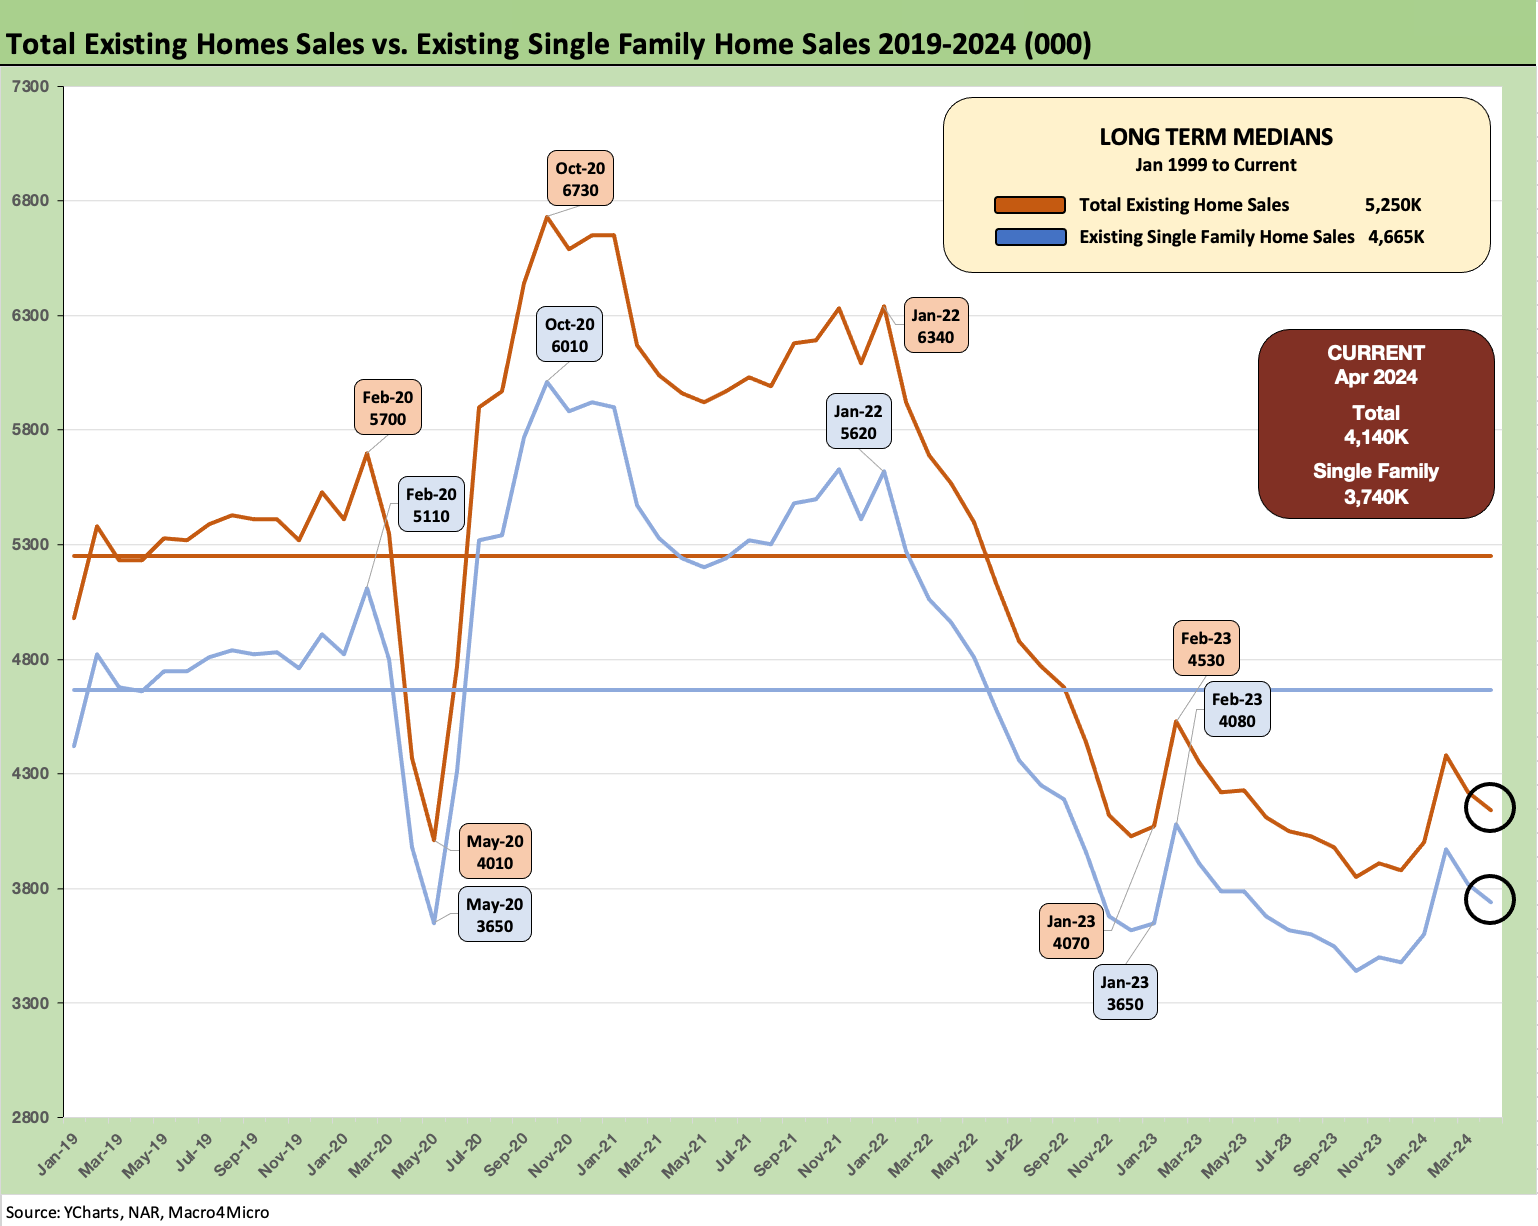
The above chart breaks out the timeline for single family alone vs. total existing. We see existing home sales of 4.14 million, which is well below the long-term median (from Jan 1999) of 5.25 million. The lower line is ex-condo/ex-co-ops.
Total single family ex-condos/co-ops declined sequentially to 3.74 million from 3.82 million. We saw 400K in condos and co-ops, flat to March 2024. The single family supply is running at 3.4 months and condo/co-ops at 4.7months as of April. That blends into 3.5 months overall in the face of slower selling rates. Those “inventory months” always come with the asterisk of regional and price tier mix.

The above chart updates the price trend line for single family since the start of 2020 ahead of COVID. The increases continue to $412.1K for single family only (as cited earlier, total existing was $407.6K). High mortgage rates and higher prices make for a tough combination for supply with demographics and protracted recovery and record payroll counts feeding the demand side – whether pent-up or in the market now.

The above chart updates the monthly existing home sales volume history from Jan 2021, when ZIRP was in place and record low 30Y mortgages (2.65%) were available in Jan 2021. We are a long way from the 6-handle peaks on volume before the tightening cycle.

The above chart updates the YoY volumes by price tier. We see progress in the sense that 5 of 6 were positive (with $100K to $250K essentially flat), but the trend favors the higher price tiers. The good news in the numbers is that the $250K to $500K tier has swung into the positive range this month in contrast to March as noted in the chart at the top of the commentary and in the March update (see Existing Home Sales March 2024: Not Something Old, Something New 4-18-24).
See also:
Credit Crib Note: Taylor Morrison 5-20-24
Footnotes & Flashbacks: State of Yields 5-19-24
Footnotes & Flashbacks: Asset Returns 5-19-24
Housing Starts April 2024: Recovery Run Rates Roll On 5-16-24
CPI April 2024: Salve Without Salvation 5-15-24
Consumer Sentiment: Flesh Wound? 5-10-24
April Payroll: Occupational Breakdown 5-3-24
Payroll April 2024: Market Dons the Rally Hat 5-3-24
Employment Cost Index March 2024: Sticky is as Sticky Does 4-30-24
PCE, Income, and Outlays: The Challenge of Constructive 4-26-24
1Q24 GDP: Too Much Drama 4-25-24
1Q24 GDP: Looking into the Investment Layers 4-25-24
PulteGroup: Strong Volumes, Stable Pricing 4-24-24
New Home Sales March 2024: Seasonal Tides Favorable 4-23-24
Systemic Corporate and Consumer Debt Metrics: Z.1 Update 4-22-24
D.R. Horton: Ramping Up in 2024 Despite Mortgages 4-19-24
Existing Home Sales March 2024: Not Something Old, Something New 4-18-24
Housing Starts March 2024: The Slow Roll and Ratchet 4-16-24