
Employment Cost Index March 2024: Sticky is as Sticky Does
With labor demand strong, the ECI stays above 4% again for the quarter and flat to Dec 2023 even if down from the highs of over 5% in 2022.


At a sticky time like this, we need to invoke the Scooby Doo Tar Monster.
The +4.2% Employment Cost Index shows broad-based cost creep across many industry groups and occupations both in private sector and government jobs, and that means more headwinds for the Fed easing story. The UST curve reacted accordingly.
We see “All Workers” wages and salaries at +4.4% YoY for 12 months, which ticked higher from +4.3% in Dec 2023 but is down from +5.0% in March 2023. It was higher by +1.3% for the rolling 3 months in March 2024 vs. +0.7% for the 3 months ended Dec 2023.
The theory is that such a rise in the ECI lines tells a story of inflationary pressure or margin pressure for companies or, behind door #3, the need for higher productivity or fewer workers for a given mix of tasks (cue the AI theme or the old-time trend of automation).
The higher rate of wage growth for union labor will get some headlines in an election year with a fair amount of organizing going on even if unions only comprise around 6% of the private sector work force.
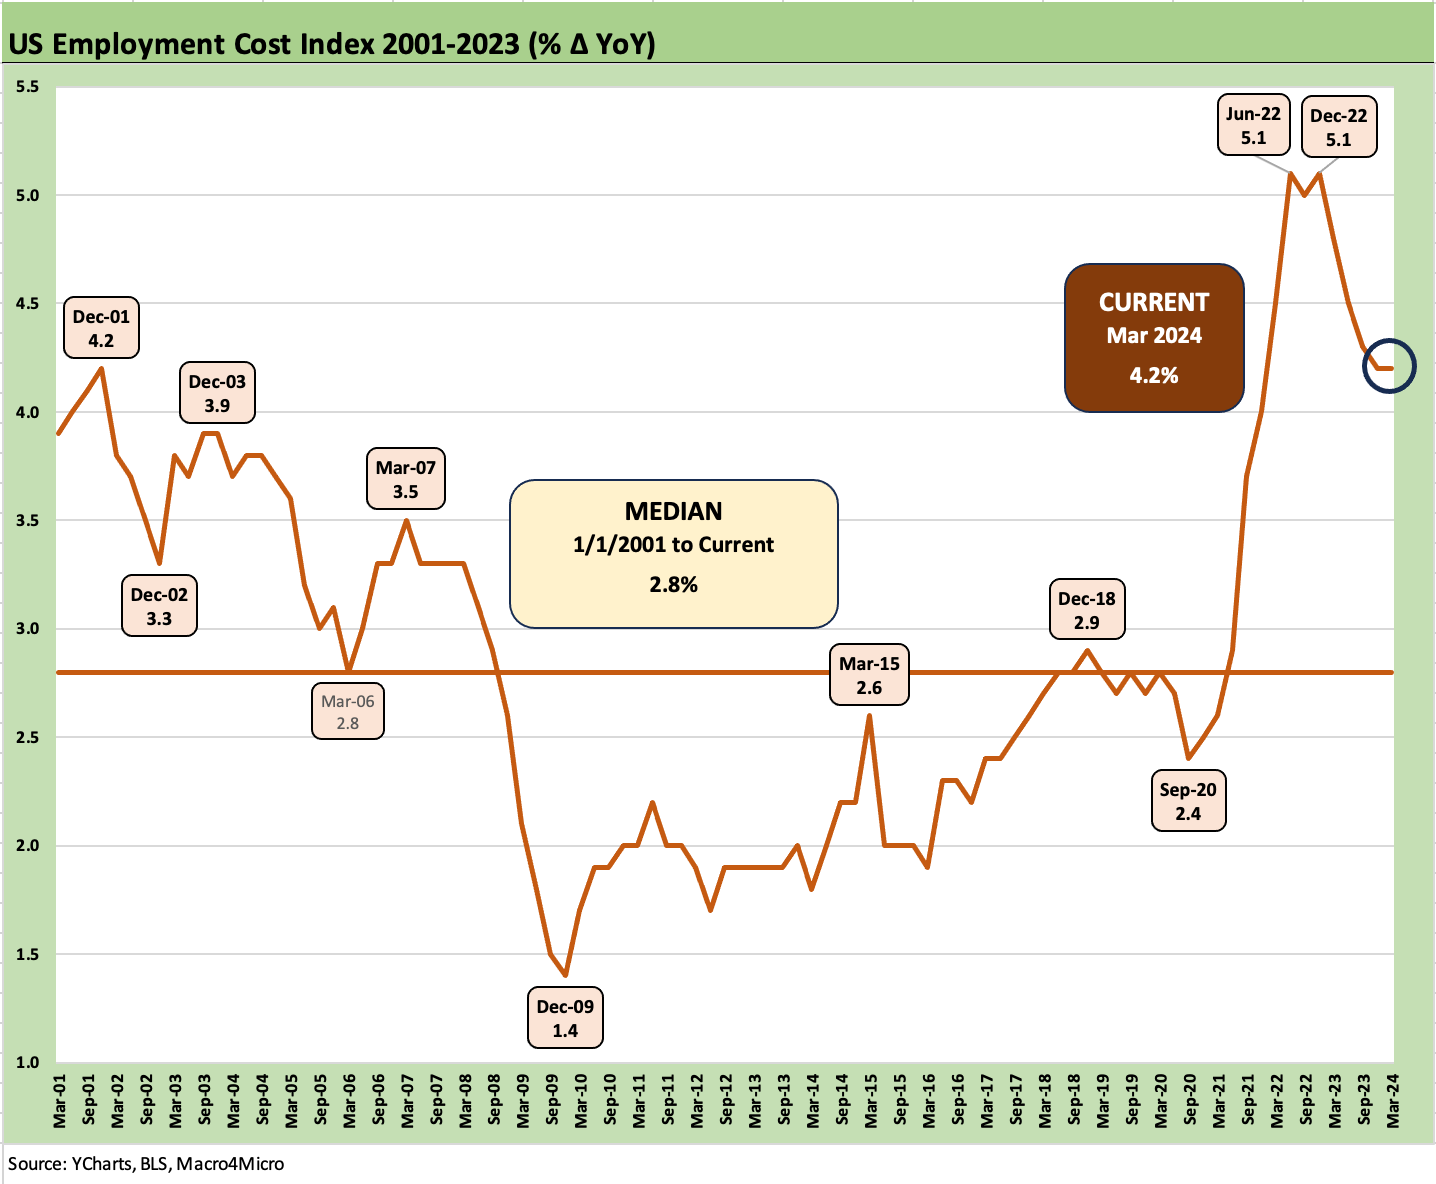
The quarterly Employment Cost Index (“ECI”) weighed in at +4.2%, which was flat to last quarter (see Employment Cost Index Dec 2023: Compensation Mixed Picture 1-31-24) and down slightly from the September quarter +4.3% (see Employment Cost Index Sept 2023: Expect the Expected 10-31-23).
The Sept 2023 ECI was not released until late Oct 2023, but inflation anxiety caused the UST 10Y to peak in the third week of Oct 2023 as the broader data in the late summer and early fall was not supportive. Then of course the big rally of Nov-Dec arrived, so all hope is not lost on the UST dynamics from here. The data is just not helping now. That is not good when the phrase “data dependent” is nonstop.
The bears might begin wailing like Cassandra in a mood swing (stagflation is here, layoffs coming, margin squeeze dead ahead, the Fed must tighten, etc.), but the fact is that wages are rising faster than inflation in a good way for households. That helps explain the sustained PCE power (see PCE, Income, and Outlays: The Challenge of Constructive 4-26-24) at a time of record payroll counts.
It is very hard to have a recession with positive PCE, tight labor, and a high rate of fixed investment (see 1Q24 GDP: Too Much Drama 4-25-24, 1Q24 GDP: Looking into the Investment Layers 4-25-24). Something has to fade to get us there. It may be hard to have a recession, but it is also hard to ease.
A few highlights from the ECI release away from the headline number…
ECI for Service-Producing industries: The ECI for Total Compensation in Services was +4.3%, ticking higher from +4.2% in Dec 2023 but down from +4.9% in March 2023. The 3-month rate of increase rose to +1.4% from +0.6% (not seasonally adjusted). The Services increase was higher than Goods-Producing, which was +3.9% in March, flat to +3.9% in Dec 2023. For Goods, the 3-month number rose from +0.8% in Dec 2023 to +1.3% in March 2024.
All Workers Wages and Salaries: The 12-month YoY of +4.4% for wages and salaries ticked up from +4.3% in Dec 2023 but is down from +5.0% in March 2023. The 3-month number of +1.3% moved higher sequentially from +0.7% in Dec 2023, so that is a tough trend.
Union wages and salaries, private industry: Despite being a very small slice of the private sector at around 6% of the private sector employee base (32.5% of public sector, 10.0% all workers), we see Union worker wages and salaries growth at +6.3% YoY for 1Q24. That is up from +5.4% in Dec 2023 and marks a notable increase from +4.2% in March 2023. Some might be surprised that Service-Producing unions weighed in at +7.3% YoY and outpaced Good-Producing at +4.4%. The Services line at +7.3% was up from +6.2% in Dec 2023 and up materially from +4.6% in March 2023.
We get JOLTS tomorrow and Payroll on Friday, so those remain important inputs as always but perhaps more important these days. The UST bulls are looking for some relief on the inflation themes after a tough 1Q24 for Fed easing optimists. First up is the FOMC this week who will have today’s ECI data point as a negative and the JOLTS number on the screen tomorrow with ISM Manufacturing to name two.

The above chart plots the long term ECI time series vs. the Unemployment Rates from the start of 2001. The ECI index shows a median of +2.8% across those years with the unemployment median at +5.4% ahead of a fresh number coming on Friday.
This timeline comes with the history of wage stagnation and low inflation and the political theme of “capital winning, labor losing.” That changed with the recent inflation spike – the first in four decades – showing renewed labor pricing power with favorable supply-demand fundamentals.
There is plenty of debating room for all parties on the trend of wages outpacing inflation with both good news and bad news to play with depending on where you sit. On the one hand, the wages have not caught up to the cumulative repricing of so many “baskets” on the household priority list (food at the top of the list). On the other hand, the trends show real wage growth and pay hikes above inflation.
The menu pain extends to many aspects of life from housing to new and used cars, auto insurance, travel and leisure, general recreation, etc. Some of those line items are even deflating now (e.g. used cars) but the repricing over a few years is still on the all-in sticker price or in the bar code for food at the grocery store.
The bottom line is the ECI was bad for inflation and fed funds easing handicapping.
See also:
Recent ECI Commentaries:
Employment Cost Index Dec 2023: Compensation Mixed Picture 1-31-24
Employment Cost Index Sept 2023: Expect the Expected 10-31-23
Employment Cost Index: Rings of the Redwood 7-28-23
Employment Cost Index: Slow Motion 4-28-23
Employment Cost Index: Labor vs. Capital …Tide Turning or Swirling? 1-31-23
Macro:
Footnotes & Flashbacks: State of Yields 4-28-24
Footnotes & Flashbacks: Asset Returns 4-28-24
PCE, Income, and Outlays: The Challenge of Constructive 4-26-24
1Q24 GDP: Too Much Drama 4-25-24
1Q24 GDP: Looking into the Investment Layers 4-25-24
Durable Goods: Back to Business as Usual? 4-24-24
Systemic Corporate and Consumer Debt Metrics: Z.1 Update 4-22-24