
Housing Starts April 2024: Recovery Run Rates Roll On
We look at a housing sector rolling into the peak spring and summer run rates and watching their working capital.

Single family starts were essentially flat from March 2024 (-0.4%), but the solid YoY increase stays on trend with single family starts +17.7% YoY as activity (and homebuilders) keep buzzing as single family completions rose by double digits (+15.4%) sequentially, as well as YoY (+13.6%).
With the South and the West region comprising around 82% of the single family starts count, those two regions are driving the bus with the South (59.3% of total) up +16.6% YoY and the West (22.5% of total) at +18.4% YoY.
Multifamily posted a very strong sequential move in starts from March to April 2024 at +31.4% but is down hard YoY at -32.9% as multifamily completions rose by +18.1% and supply keeps entering the market.
In the end, the sequential total starts run rates were up +5.7% from March to April 2024 but essentially flat YoY (-0.6%) as rising single family gets offset by a plunge in multifamily starts (-32.9% YoY).
The homebuilding sector has been one of the wilder story lines of 2023 and 2024 in terms of the equity performance against the market, and that includes the battle with “all comers” including tech (see Footnotes & Flashbacks: Asset Returns 5-12-24). It has been quite a run for homebuilders.
The breadth of strength across PCE and Fixed Investment includes a material, double-digit growth component from residential investment in the first estimate on 1Q24 GDP (see 1Q24 GDP: Too Much Drama 4-25-24, 1Q24 GDP: Looking into the Investment Layers 4-25-24). Employment trends (see Payroll April 2024: Market Dons the Rally Hat 5-3-24) join a number of factors bringing tailwinds to the homebuilders along with a range of other releases that have been torturing the UST bulls this year (see links at bottom).
As we have routinely discussed in our housing sector research and single name work, the builders have been able to navigate the ugly mortgage rate market creatively using various incentives including mortgage buydowns and fee relief to capture market share of total sales (for some recent single name work, see PulteGroup: Strong Volumes, Stable Pricing 4-24-24, D.R. Horton: Ramping Up in 2024 Despite Mortgages 4-19-24). Monthly payment shock on new or refinanced mortgages causes imbalances that have dislocated the housing sector supply-demand fundamentals on the back of low existing inventory for sale.
The good news for builders is that a downward shift in the UST curve into the summer or early fall would be greeted with a lot of completed inventory and homes under construction. That would make for a banner year and a lot of new starts and permits to plan, thus supporting the economy.
The underlying downshift in the UST curve would of course have to be tied to lower inflation and not a macro shock or a geopolitical shock (escalating trade war, Ukraine-Russia spilling into other territories, Iran and oil slow disruptions in Gulf, etc.). There is always that threat of some outlier events (example: 1,000 heavily tattooed, unshaven “patriots” with uniforms of blue suits and ugly red ties storm the Capitol and White House with assault rifles next Jan 6, House extremists reach across aisle to choke the other members, etc. The usual Washington fare. Then we have a new larger choir to praise.). Then again, the market might have that priced in already.
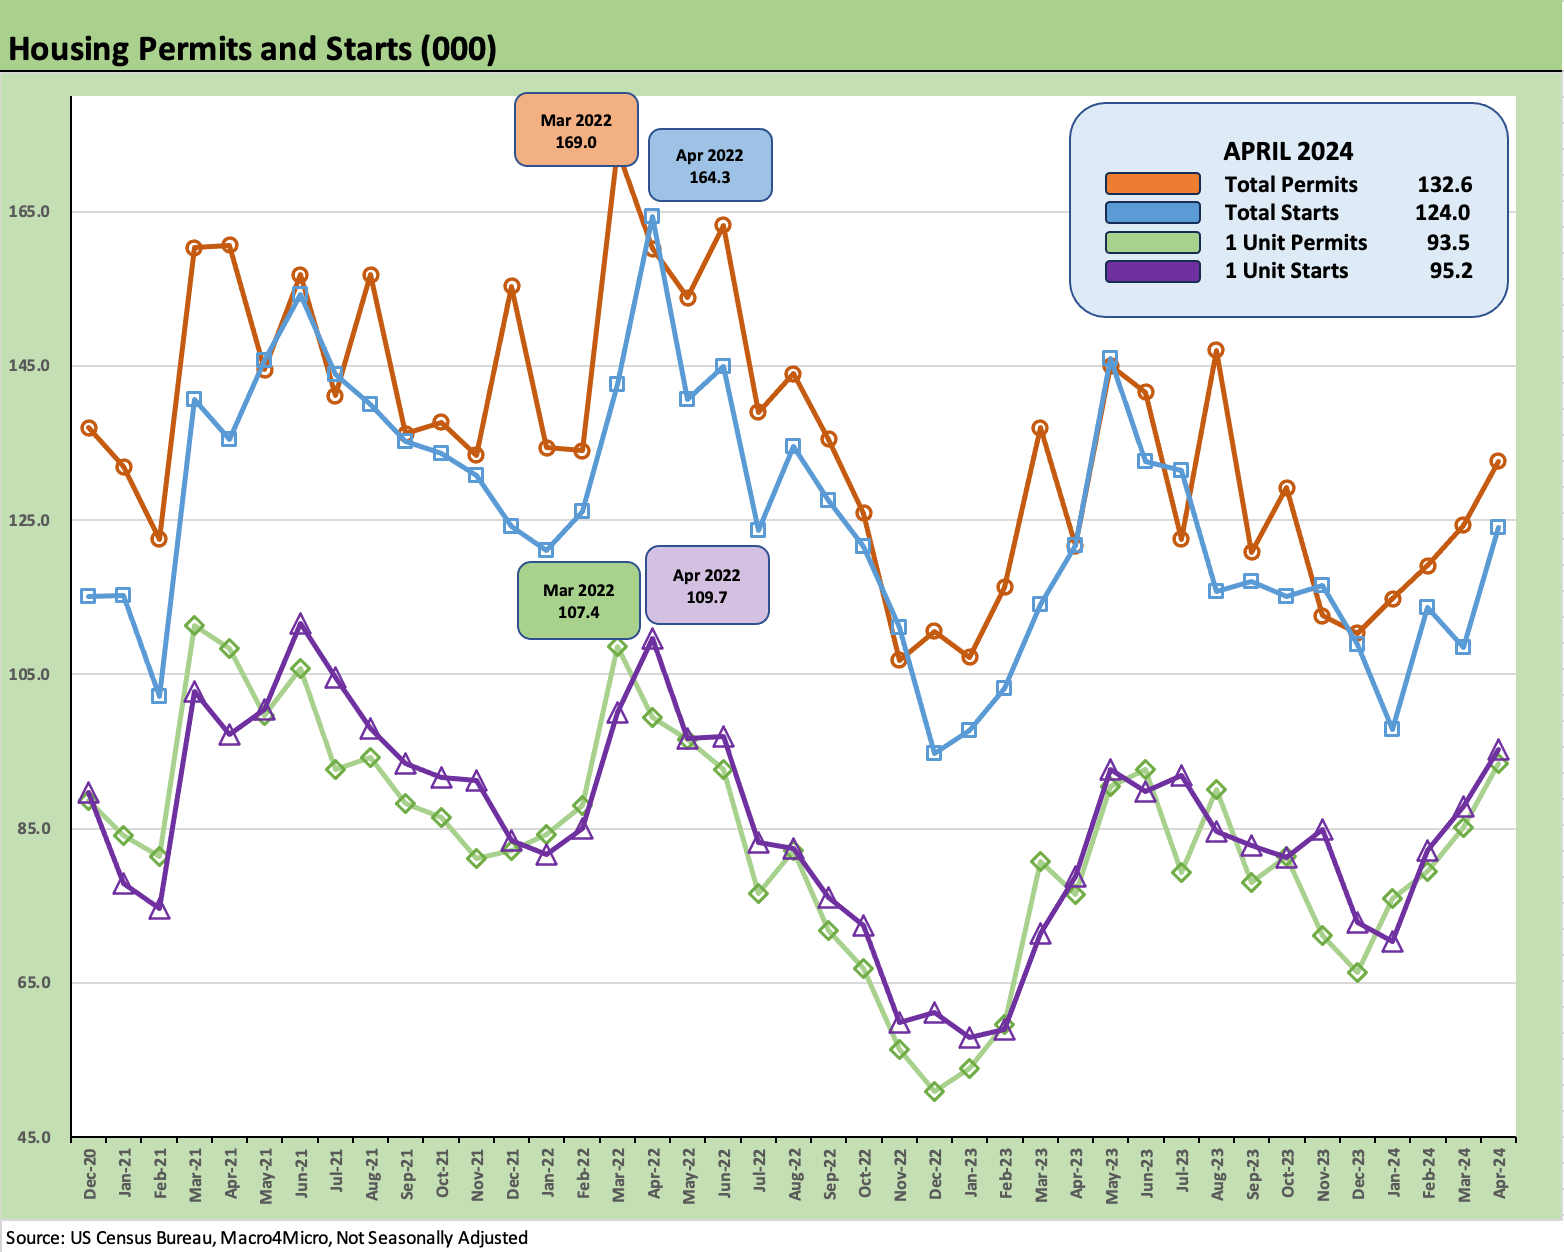
The above chart updates the path of permits and starts (not seasonally adjusted, “NSA”) since the start of 2021 when ZIRP was still in place and mortgage rates were in a different universe. We have lines for both for permits and starts for each of the total and single family trend lines.
The starts NSA numbers give a closer estimate on what is being seen on the ground without the SAAR adjustments. We see housing starts in total and for single family both moving higher. The NSA permit trends are also bullish for future activity.
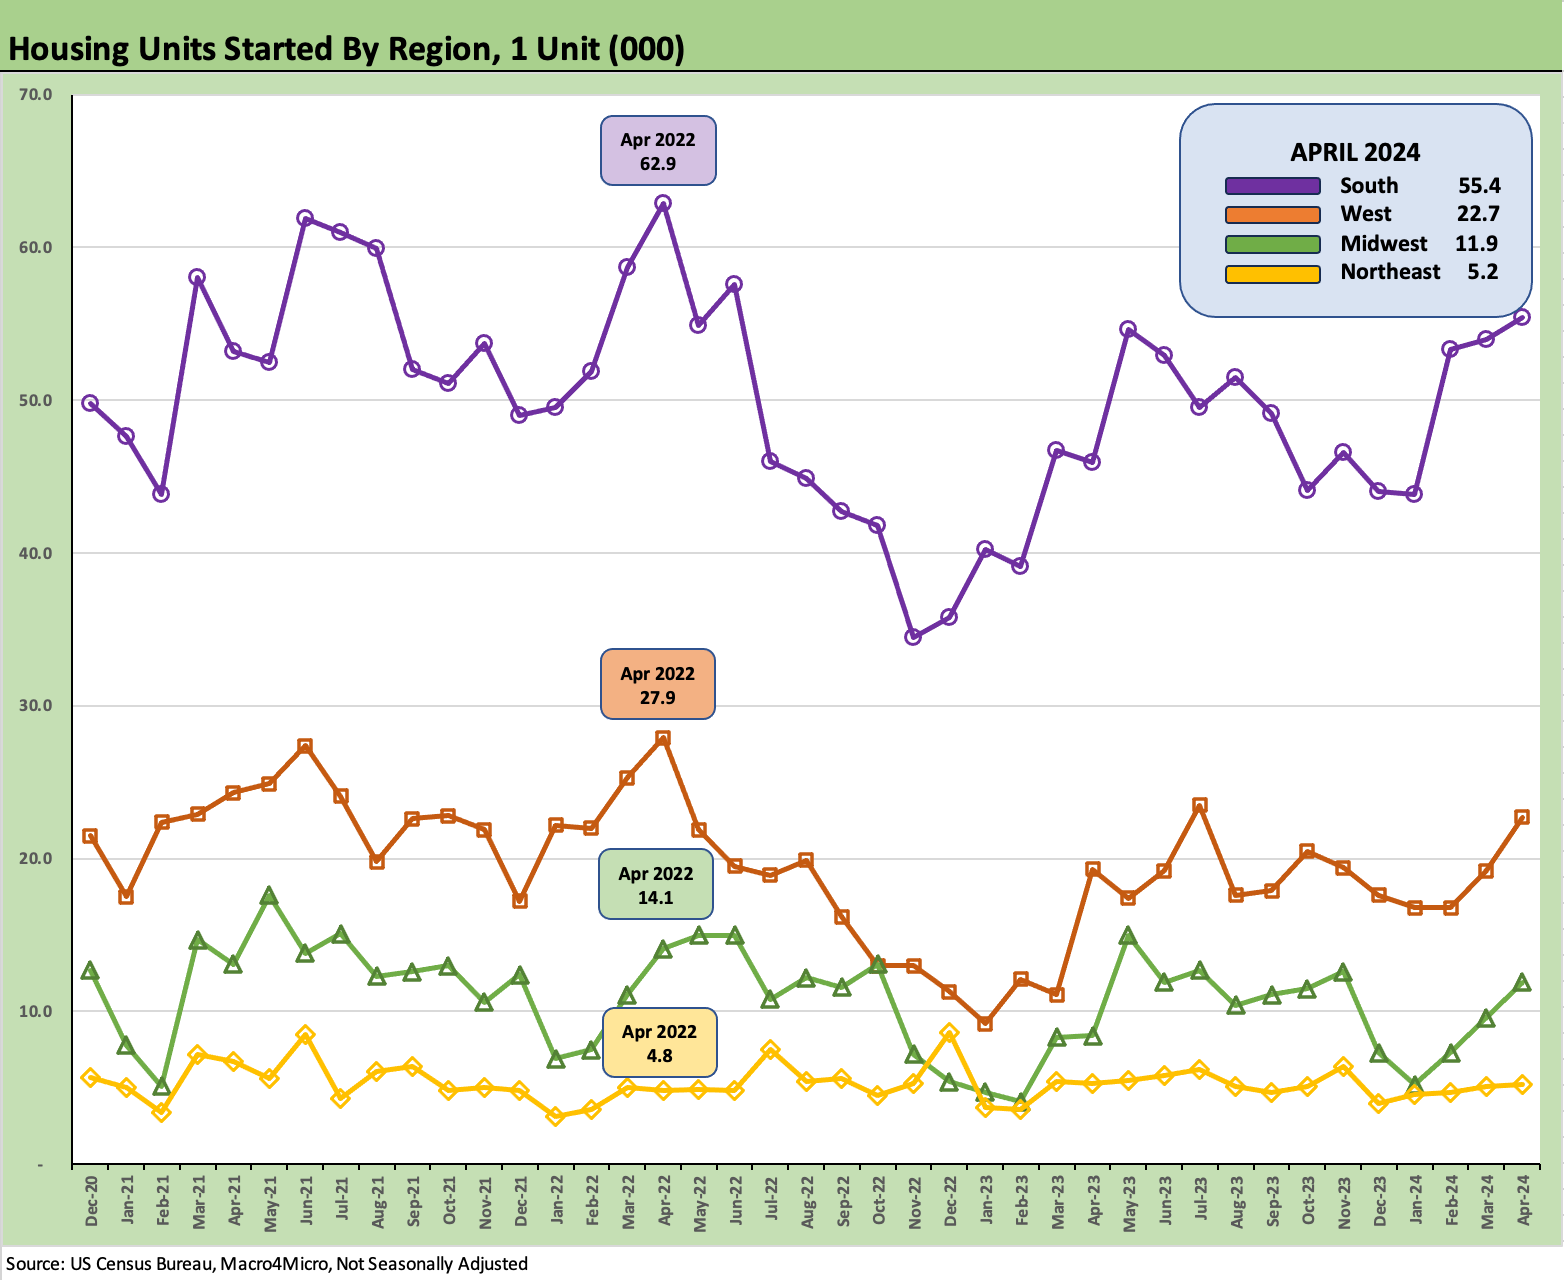
The above chart posts NSA total starts by region, and we see the 3 largest regions rising and only the small Northeast market in a sideways stall.
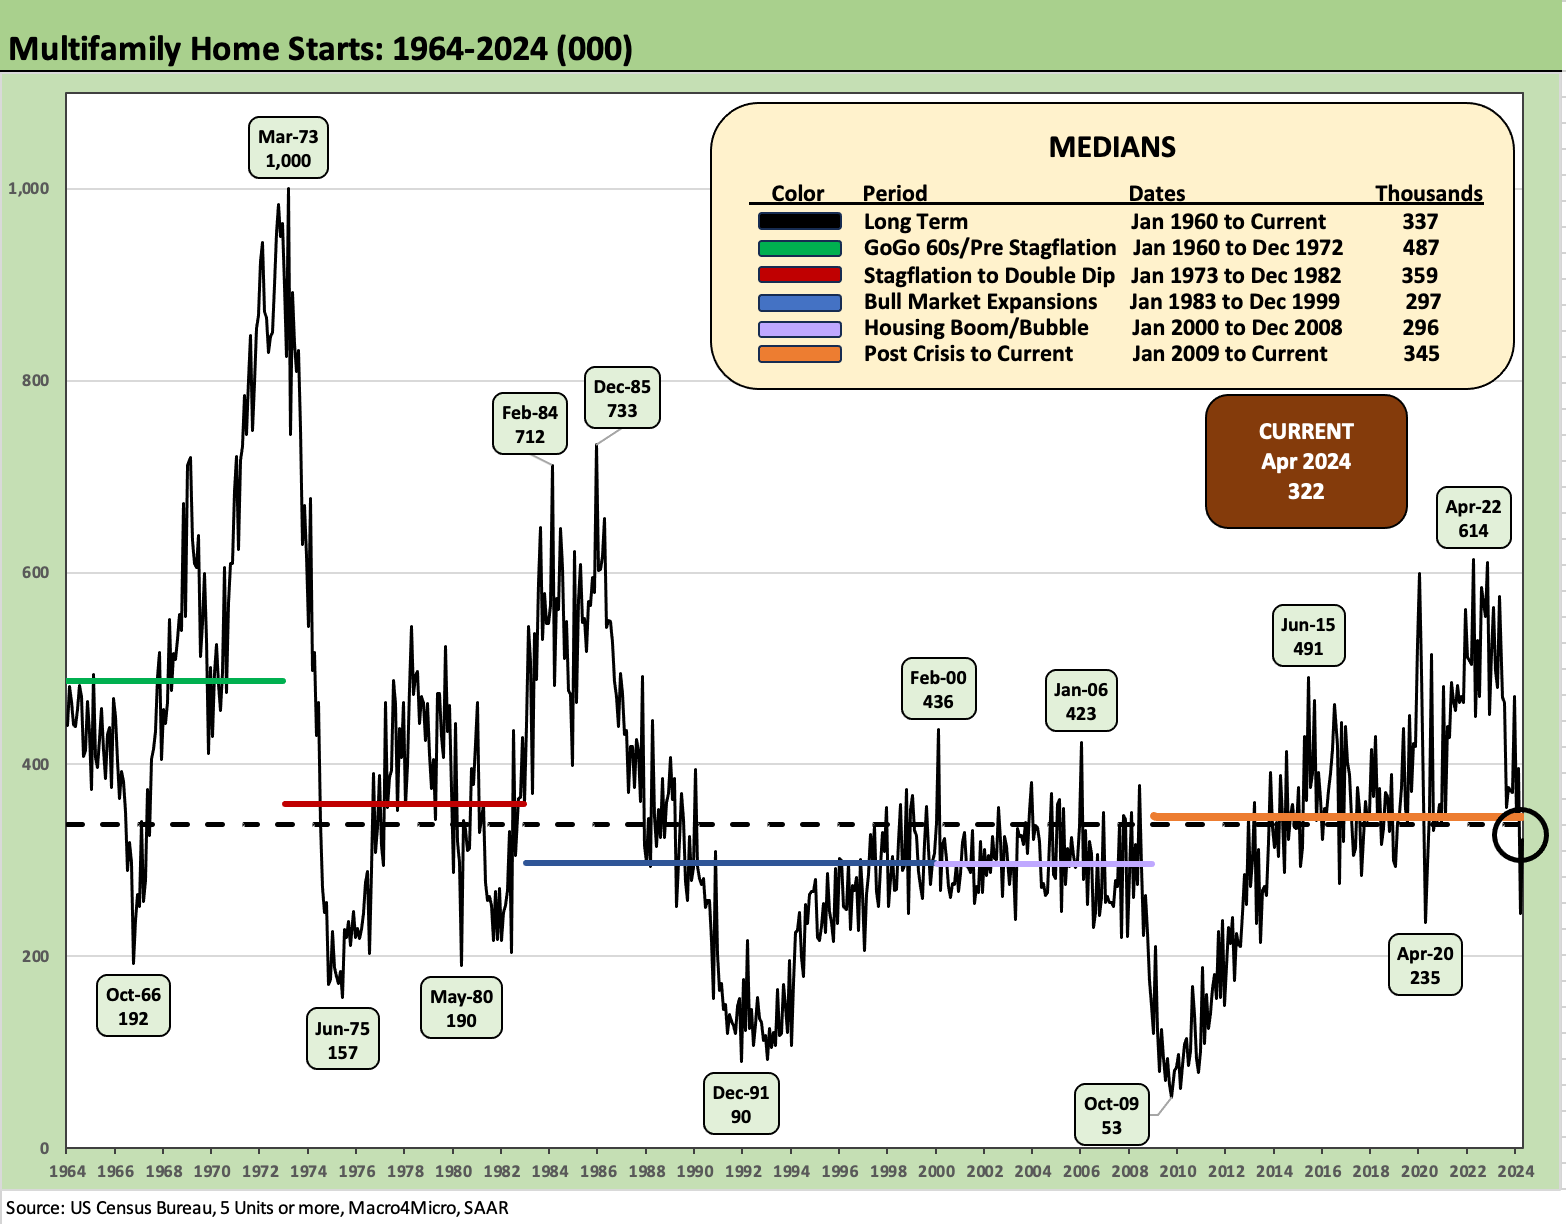
The above chart handles the Multifamily bucket for starts (SAAR basis) as the sector comes down off the peak. At 322K, the starts for Multifamily are now running below the long-term median of 337K and are now well down from this current cyclical peak of 614K in April 2022 just as the mid-March 2022 tightening was rolling into the markets.
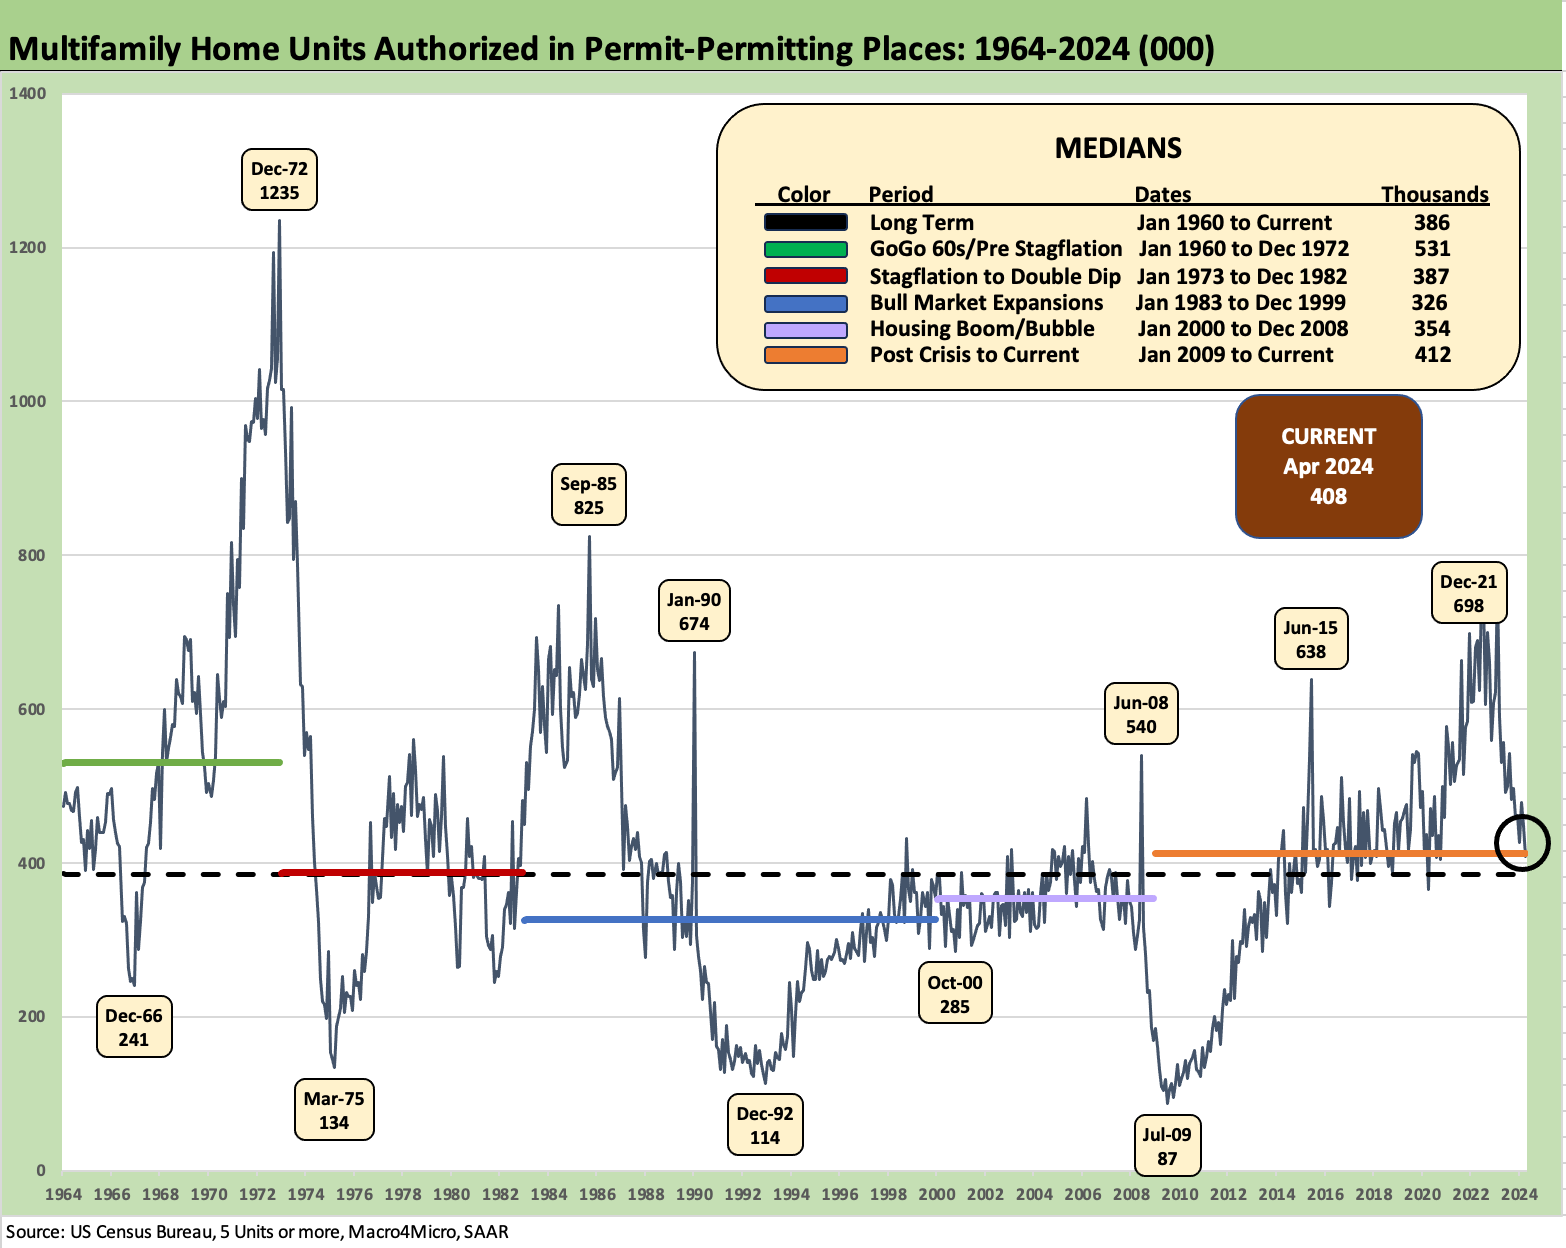
Multifamily permits at 408K are down meaningfully from the 698K peak in Dec 2021 and down by -9.1% from March 2024 and down by -23.0% from April 2023. The 408K is above the long term median of 386K that included big booms in the late 60s/early 70s and again in the mid-1980s as inflation was broken and building was soaring in various markets.
See also:
CPI April 2024: Salve Without Salvation 5-15-24
Footnotes & Flashbacks: State of Yields 5-12-24
Footnotes & Flashbacks: Asset Returns 5-12-24
Consumer Sentiment: Flesh Wound? 5-10-24
April Payroll: Occupational Breakdown 5-3-24
Payroll April 2024: Market Dons the Rally Hat 5-3-24
JOLTS March 2024: Slower Lane, Not a Breakdown 5-1-24
Employment Cost Index March 2024: Sticky is as Sticky Does 4-30-24
PCE, Income, and Outlays: The Challenge of Constructive 4-26-24
1Q24 GDP: Too Much Drama 4-25-24
1Q24 GDP: Looking into the Investment Layers 4-25-24
New Home Sales March 2024: Seasonal Tides Favorable 4-23-24
Systemic Corporate and Consumer Debt Metrics: Z.1 Update 4-22-24
D.R. Horton: Ramping Up in 2024 Despite Mortgages 4-19-24
Existing Home Sales March 2024: Not Something Old, Something New 4-18-24
Housing Starts March 2024: The Slow Roll and Ratchet 4-16-24