
Labor Day Weekend: Mini Market Lookback
With a Labor Day break for our weekend Footnotes publications, we highlight a small subset of our favorite charts.


Summer markets drifted away…
Spreads tightened in credit (more notably before rebalancing), equities were mixed, and the UST curve posted an adverse move on the week as tech remains at a crossroads that saw an underwhelming market response to NVIDIA earnings.
With the FOMC now juggling mandates instead of fixating on one, the payroll report is suddenly more important than the PCE numbers after years of solid payroll added up to record headcounts in the employment ranks but with a lot of questions on quality of employment.
The 2Q24 GDP posted an upward revision in the 2nd estimate with PCE solid but investment in fade mode (see 2Q24 GDP 2nd Estimate: The Power of 3 and Cutting 8-29-24).
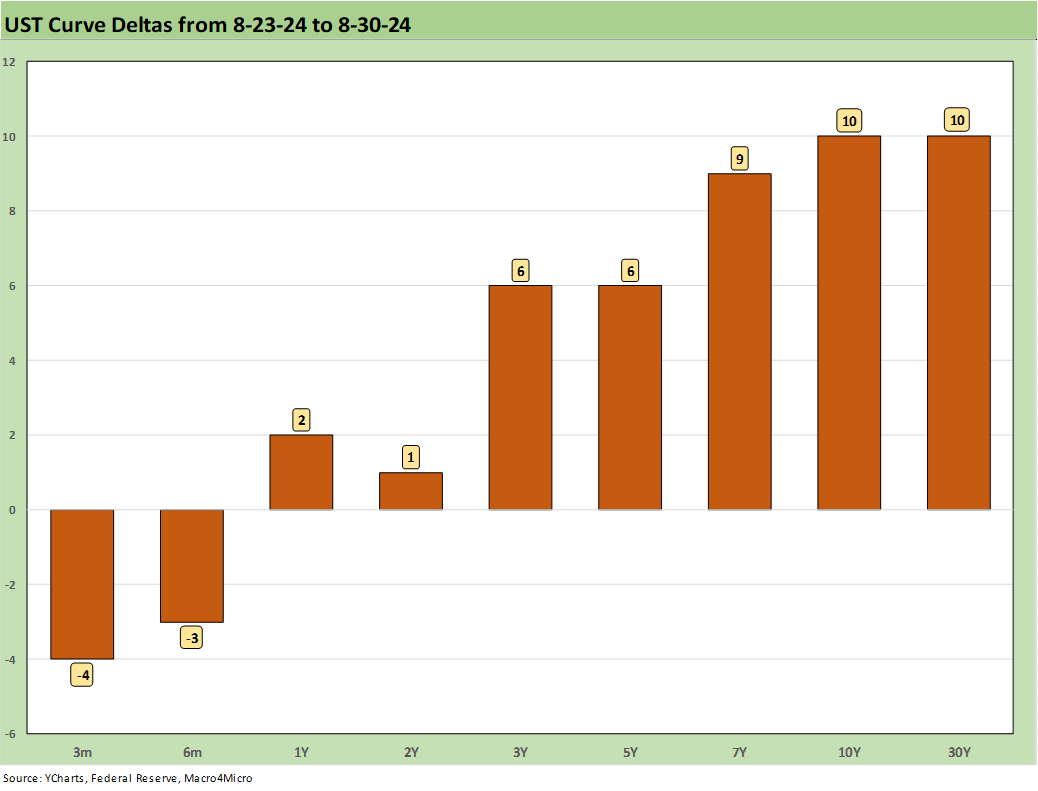
The UST curve delivered a mini bear steepener on the week out past 2Y to 30Y as the second estimate of 2Q24 GDP saw an upward revision at the headline level driven by the consumer along the PCE lines. We then saw even more timely signs of consumer resilience in the Personal Income and Outlays report to end the week (see PCE July 2024: Inflation, Income and Outlays 8-30-24).
The PCE line is still the main story of cyclical resilience. A subset of consumers may start chanting, “those about to default salute you” given the credit card usage, but that has been a warning for quite a while for households sitting on extremely low refinanced mortgages (60% below 4%, 30% below 3%), seeing healthy job openings, and receiving improving real wages. Credit card defaults will only do so much damage. Job losses would change that equation. Not just lower jobs added.
For now, the pockets of consumer weakness might be more about who defaults, but the other side is, “Who gets new credit lines?” as more people enter the work force and start spending. It is two-way traffic. Some lose credit. Some gain credit. The trick for lenders is making sure they reserve adequately for losses in the context of the exorbitant rates being charged.
The Friday PCE report also held steady on PCE price indexes, and there is little expectation a mid-2% PCE price index will stop the FOMC from easing unless jobs somehow turns in the mother of all upward revisions for last month and also rings up a very strong Aug payroll number.
A super bullish jobs report will have a hard time erasing the large downward revision we already saw this past month (see Payroll: A Little Context Music 8-22-24). First, we get the JOLTS report, and last month posted numbers that were still above the Nov 2018 highs of the Trump years even though openings are well down from the peaks in this cycle (see JOLTS June 2024: Countdown to FOMC, Ticking Clock to Mass Deportation 7-30-24).
Asset returns weighed in with healthy numbers for the week and the month…
Considering the chaos in the first week of trading in August, the winddown of the summer months saw a mix of new highs in equities but mixed bond returns across an uneven month with the UST bouncing around in a band.

Even with the very noisy start to the month, August returns across our universe of 32 benchmarks and ETFs weighed in at 24 positive and 8 negative. The S&P 500 just edged into the top quartile for the month with NASDAQ (IXIC) and the Equal weight S&P 500 (RSP) in the second quartile and the Equal Weight NASDAQ 100 ETF (QQEW) sitting on the bottom of the second quartile.
We see all 7 bond ETFs in positive zone for the month with the long duration UST 20+ Year ETF (TLT) leading the bond pack. Energy ETFs (XOP, XLE, AMLP) comprised 3 of the 8 in the red with Builders (XHB) getting whipsawed by interest rate debates and the same for Regional Banks (KRE). The small cap rotation has so far faded with the Russell 2000 in the negative range and the bottom quartile for the month.
The trailing 1-month August returns tell a story of higher volatility that could be a warmup for a wild fall that faces a toxic election with radically different policy plans for the economy. The brief VIX spike certainly caused many to second-guess the economic reality before their eyes (see Volatility and the VIX Vapors: A Lookback from 1997 8-6-24, Payroll July 2024: Ready, Set, Don’t Panic 8-2-24).

The 1-week time horizon ended on a reasonably quiet note given the ugly start to the month. The real action still lies ahead as a payroll report feeds the next round of FOMC handicapping and cyclical odds-making.
The week was slightly biased toward negative returns at a score of 14-18 with all 7 bond ETFs negative. The long duration UST ETF (TLT) was dead last on the week and the short duration UST 1Y-3Y ETF (SHY) led the bond pack from a slight negative return. The Tech ETF (XLK) was second to last with Builders (XHB) just ahead of Tech (XLK) along with Base Metals (DBB). NASDAQ, IG Corporate bonds (LQD), EM Equities (VWO), and the AGG bond ETF also resided in the bottom quartile for the week.
Financials (XLF) came in at #1 for the week with some cyclical ETFs behind XLF in the top tier with Industrials (XLI) and Materials (XLB) as part of a diverse mix of line items from there that included the BDC ETF (BIZD), Utilities (XLU), Health Care (XLV), Energy (XLE) and the Equal Weight S&P 500 (RSP) rounding out the top quartile.

We update our weekly return chart on the tech bellwethers above after a week when NVIDIA reported. We see 4 of the Mag 7 in negative range with NVIDIA sitting in dead last at -7.7% for the week along with Tesla, Alphabet, and Meta in the red. The market is still wrestling with the rotation themes and where the UST curve will fit into the story line for the lofty tech valuations.
Credit excess returns keep rolling…

The above chart details the running YTD excess returns for HY and IG credit. We see a new YTD excess return high for HY while IG is still below the highs of late May 2024. The IG excess return had briefly dipped into negative in the early Aug volatility.

The above chart plots HY OAS from June through Friday close. The visual offers a reminder of the major swing of August. The peak HY OAS in the month offers a reality check on how tight HY spreads are even after the spike when framed against the long-term median.

The above chart updates where the “HY minus IG” quality spread differential framed up to end the week. We address these histories in our weeklies for those who want to take a more detailed historical look (see Footnotes & Flashbacks: Credit Markets 8-26-24, ). The recent differentials are a very long way from the long-term median from 1997.

We wrap with a quick look at the “BB – BBB OAS differential” as it swung back closer to the multicycle low zone more akin to what we saw at the end of 2019. We had already dipped below the lows of 2019 in July 2024 with the +55 bps, which was the lowest since June 2007.
See also:
PCE July 2024: Inflation, Income and Outlays 8-30-24
2Q24 GDP 2nd Estimate: The Power of 3 and Cutting 8-29-24
Harris Housing Plan: The South’s Gonna Do It Again!? 8-28-24
Footnotes & Flashbacks: Credit Markets 8-26-24
Footnotes & Flashbacks: Asset Returns 8-25-24
Footnotes & Flashbacks: State of Yields 8-25-24
Payroll: A Little Context Music 8-22-24
All the President’s Stocks 8-21-24
Total Return Quilt: Annual Lookback to 2008 8-14-24
CPI July 2024: The Fall Campaign Begins 8-14-24
HY Industry Mix: Damage Report 8-7-24
Volatility and the VIX Vapors: A Lookback from 1997 8-6-24
HY Pain: A 2018 Lookback to Ponder 8-3-24
Payroll July 2024: Ready, Set, Don’t Panic 8-2-24
Presidential GDP Dance Off: Clinton vs. Trump 7-27-24
Presidential GDP Dance Off: Reagan vs. Trump 7-27-24
PCE June 2024: Inflation, Income, and Outlays 7-26-24
2Q24 GDP: Into the Investment Weeds 7-25-24
GDP 2Q24: Banking a Strong Quarter for Election Season 7-25-24