
Footnotes & Flashbacks: Asset Returns 9-7-24
We look at the running returns across a range of debt and equity benchmarks and ETFs in a period of potential cyclical transition and FOMC easing.


Fed’s dual mandate has a lot of moving parts.
The rolling returns have shown resilience in the face of heightened volatility and increasing concern about a more pronounced repricing in tech with commentators tiptoeing around the gaping divergence in economic policies in the election.
The past week saw equities hammered after a start to August that caused more than a few seasoned vets to get rattled on cable shows (“emergency easing needed now!”) despite the lack of contraction in PCE lines or signs of material weakness in corporate credit markets (so far).
The extreme bearish views are often exercises in extrapolation like we saw in early August and are more about forecasts than current run rates (see Another Volatile Week: Mini Market Lookback 9-7-24). Tariffs and geopolitical scenarios can alarm, but those are still highly uncertain and subject to events.
Employment weakness has become the new focal point for Fed action while the consumer sector is the linchpin for the next move in GDP with fixed asset investment already starting to show some signs of slowing.

The above chart updates our high-level debt and equity benchmarks, and we line up the asset classes in descending order of YTD total returns. The rolling 1-month comes up as all positive in both debt and equity even with the brutal week the market just experienced in stocks. For the rolling 3-months, the rebound in duration has been the main event driving returns with the 6-month debt returns in a tight range with YTD after the UST worked against bondholders earlier in the year.
On the equity side, the discussion of the rotation into small caps died down quickly just like it did after the banner month of Nov 2023 when the Russell 2000 posted a double-digit month (see Footnotes & Flashbacks: Asset Returns 12-3-23) and flipped into positive range after a rough period. The NASDAQ has been the worst victim lately and fell into negative range for 3 months.

The above chart updates the 1500 and 3000 series, and we see the relative ranking of Growth getting dialed back behind Financials. We see a tighter range for Growth YTD with Value, Real Estate, and Industrials. Energy has fallen into negative range for 1, 3, and 6 months. The comeback in the Real Estate subsector is in evidence as rates slide and expectation of more of the same rolls into the price action.
The rolling return visual
In the next section, we get into the details of the 32 ETFs and benchmarks for a mix of the trailing periods. Below we offer a condensed 4-chart view for an easy visual on how the mix of positive vs. negative returns shape up. This is a useful exercise we do each week looking for signals across industry groups and asset classes.
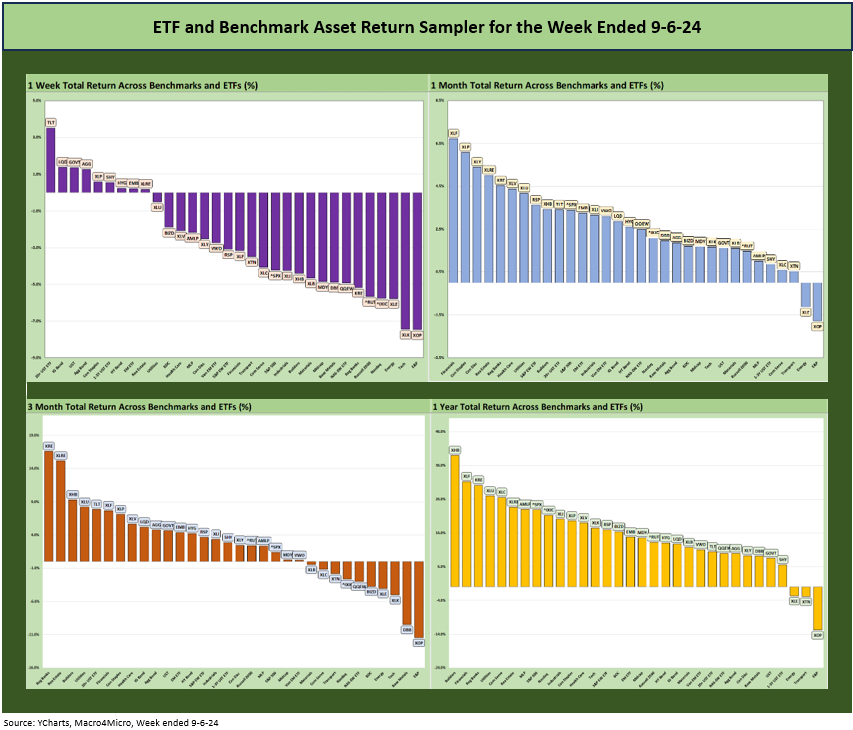
We see the balance of returns for 1-month, 3-months, and 1-year still on the side of positive, but the 3-month mix is showing the effects of summer and early fall volatility as we detail in the reconciliations further below. We added a YTD chart recently that is not shown in the mix above but is also heavily weighted toward the positive side of the ledger.
The Magnificent 7 heavy ETFs…
Some of the benchmarks and industry ETFs we include have issuer concentration elements that leave them wagged by a few names. When looking across some of the bellwether industry and subsector ETFs in the rankings, it is good to keep in mind which narrow ETFs (vs. broad market benchmarks) get wagged more by the “Magnificent 7” including Consumer Discretionary (XLY) with Amazon and Tesla, Tech (XLK) with Microsoft, Apple, and NVIDIA, and Communications Services (XLC) with Alphabet and Meta.

The above chart updates the rolling returns for 9 bellwether tech names (Mag 7 + Broadcom and Taiwan Semi) and 4 major benchmarks and ETFs (S&P 500, NASDAQ and Equal Weight ETFs for S&P 500 and NASDAQ 100).
We line them up in descending order of weekly returns and post a range of time horizon returns as well. We already commented on the week in an earlier post (see Another Volatile Week: Mini Market Lookback 9-7-24). The performance was self-evident this week and was grim with all lines negative and a NASDAQ index that posted -5.8%.

We also already looked at the 1-week numbers in our earlier post (see Another Volatile Week: Mini Market Lookback 9-7-24). There was minimal good news in the mix for equities. We see 9 lines positive and 23 negative. Bond ETFs comprised 7 of the 9 that were in positive range. They were joined by the curve sensitive Real Estate ETF (XLRE) and the Staples ETF (XLP) was also positive.
The bottom of the rankings shows E&P (XOP) and Energy (XLE) in a cluster with the Tech ETF (XLK), NASDAQ (IXIC), Small Caps (RUT), Regional Banks (KRE), and the Equal Weight NASDAQ 100 ETF (QQEW) and Base Metals (DBB) in the bottom quartile.
There are a lot of flashing yellow signals in that mix from commodities pricing to tech valuation to middle market and small business asset quality. Just above the low quartile, we see Midcaps (MDY), Builders (XHB), and Materials (XLB). That shows a broader case of the nerves.

The 1-month numbers get a little help from the measurement period start date coming off the ugly VIX Monday (8-5-24) pyrotechnics in early August (see Volatility and the VIX Vapors: A Lookback from 1997 8-6-24). For the month, we see only 2 in the red with E&P (XOP) and Energy (XLE) alone in the negative zone.
For the 7 bond ETFs, we see some dispersion of the rankings across the 2nd quartile (TLT, EMB, LQD, HYG), into the 3rd quartile (AGG, GOVT) and down to the 4th quartile (SHY) with long duration UST (20+ Year TLT) #1 in the bond ETF return rankings and short duration (SHY 1Y-3Y UST) last at #7.
Small caps sat in the bottom quartile, NASDAQ in the third quartile, and the S&P 500 in the second quartile with the Equal Weight S&P 500 ETF (RSP) in the top quartile. Midcaps were behind NASDAQ but ahead of small caps.

The rolling 3-month asset return mix has been trending in a negative direction since late July (see Footnotes & Flashbacks: Asset Returns 7-28-24) as tech has whipsawed around and the UST curve struggled for direction until Powell gave his magic speech (see Footnotes & Flashbacks: State of Yields 8-25-24). The UST moves have helped the bond ETF mix over this period with 6 of the 7 bond ETFs above in the second quartile and all positive with the long duration TLT in the top quartile at #5.
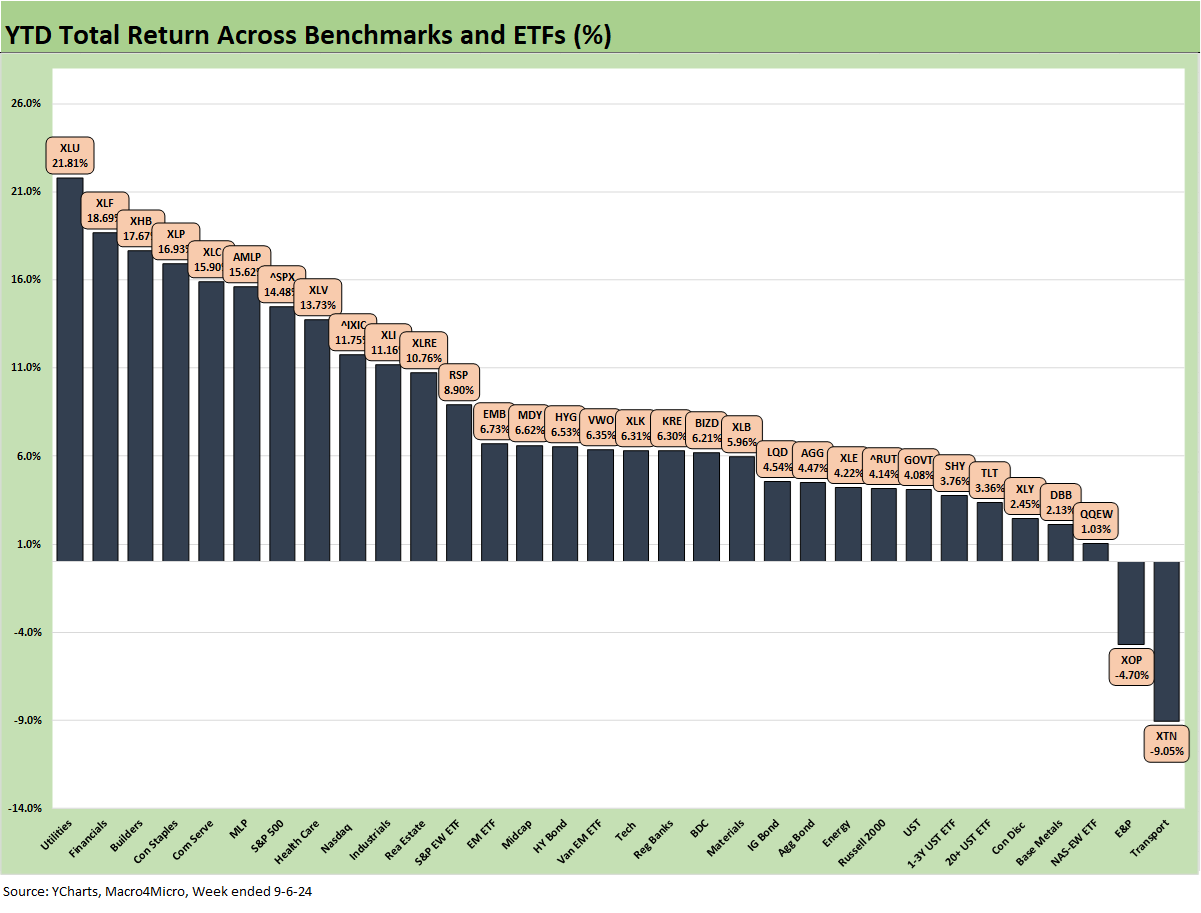
The YTD period has a nice return profile for those not in the “What have you done for me this week?” school. The score is 30-2 favoring positive with E&P (XOP) and Transports (XTN) as the laggards. We see 11 of the 32 posting double digit returns as some sectors get reeled in over recent weeks.
The 7 bond ETFs are spread out with credit risk winning and duration losing. EM Sovereigns (EMB) and HY (HYG) are in the second quartile YTD with IG Corporates (LQD) and the AGG index (AGG) in the third quartile. In the bottom quartile we see GOVT, and the short and long duration UST ETFs (SHY, TLT).
The top performers YTD include Utilities (XLU), Financials (XLF), Homebuilders (XHB), Consumer Staples (XLP), and Communications Services (XLC) in the top 5 with only XLC bringing a tech-centric and Mag 7 flavor. AMLP at #6 is a reminder that high cash dividends add up. The S&P 500 noses out NASDAQ for a spot in the top quartile with NASDAQ leading off the second quartile.
For all the MAG 7 excitement, we see Consumer Discretionary (with AMZN and TSLA) in the bottom quartile with the Tech ETF leading the third quartile. The median range YTD return is around 6% YTD with 8 of the line items rounding to 6% handle returns through 9-6-24.

The 1-year LTM returns have that familiar look at 29-3 with two energy ETFs (XLE, XOP) and Transports (XTN) in the red zone. Homebuilders (XHB) hold down the #1 LTM return spot with Financials (XLF) and Regional Banks (KRE) north of the +30% threshold for the 1-year timeline. When the Nov-Dec 2023 rally months drop into the returns, the running returns step up impressively. We see the top 23 line items in double digit returns with the top 10 over 20% in LTM returns.
The top bond ETF return is EMB at +14.8% at the bottom of the second quartile with HYG at +13.0%, and LQD at +12.7% in a tight range with HYG. The long duration UST 20+ Year ETF (TLT) is at +10.4% for the fourth bond ETF in double digit returns. The bottom quartile shows AGG at just below 10%, GOVT at +8.5%, and SHY at 6.6% which is four off the bottom. That is a very good year for a well-diversified portfolio.
See also:
Another Volatile Week: Mini Market Lookback 9-7-24
August 2024 Payrolls: Slow Burn, Negative Revisions 9-6-24
Trump's New Sovereign Wealth Fund: Tariff Dollars for a Funded Pool of Patronage? 9-5-24
Goods and Manufacturing: Fact Checking Job Rhetoric 9-5-24
JOLTS July 2024: Mixed Bag, Hires Up, Layoffs/Discharges Up, Quits Flat 9-4-24
Construction Spending: A Brief Pause? 9-3-24
PCE July 2024: Inflation, Income and Outlays 8-30-24
2Q24 GDP 2nd Estimate: The Power of 3 and Cutting 8-29-24
Harris Housing Plan: The South’s Gonna Do It Again!? 8-28-24
Payroll: A Little Context Music 8-22-24
All the President’s Stocks 8-21-24
CPI July 2024: The Fall Campaign Begins 8-14-24
Total Return Quilt: Annual Lookback to 2008 8-14-24
HY Industry Mix: Damage Report 8-7-24
Volatility and the VIX Vapors: A Lookback from 1997 8-6-24
HY Pain: A 2018 Lookback to Ponder 8-3-24
Payroll July 2024: Ready, Set, Don’t Panic 8-2-24
JOLTS June 2024: Countdown to FOMC, Ticking Clock to Mass Deportation? 7-30-24)
Presidential GDP Dance Off: Clinton vs. Trump 7-27-24
Presidential GDP Dance Off: Reagan vs. Trump 7-27-24
2Q24 GDP: Into the Investment Weeds 7-25-24
GDP 2Q24: Banking a Strong Quarter for Election Season 7-25-24