
Footnotes & Flashbacks: Credit Markets 9-9-24
We update the direction of credit markets ahead of what will be a very tumultuous fall season of Fed action and election-driven policy risk assessment.


Nothing quite like a united country to foster confidence in the economy…
The fall season kicks off with a home stretch debate on the “-25 bps or -50 bps” handicapping before the market moves on to whether the 4Q24 will see the FOMC get to -100 bps total by year end.
This week’s debate may (or may not) feed into a fresh round of handicapping on the election (who won the debate, etc.) and whether massive tariffs or higher taxes lie on the other side of inauguration day (and whether we will have the capitol sacked again with live bullets this time).
The home stretch from this point starts with IG spreads modestly tighter YTD but HY OAS slightly wider vs. the last week of Dec 2023 (+334 bps on 12-29-23), so the excess returns in HY has been more about coupons and carry than spread tightening after a YTD period that saw quite a few all-time highs in equities and solid risk appetites.
IG has reminded the market of its resilience as we are heading into a likely easing cycle that could be jeopardized by tariff-driven inflation in 2025 and trade battle retaliation risk.
The inflation and tariff topics – backward looking and forward looking – will be front and center as a Presidential debating topic this week if any of the ABC debate moderators have a brain in their heads (or a spine to fortify them) or bothered to even research the issues in a meaningful way (we will see if their corporate bosses have already been cowed by Trump intimidation).
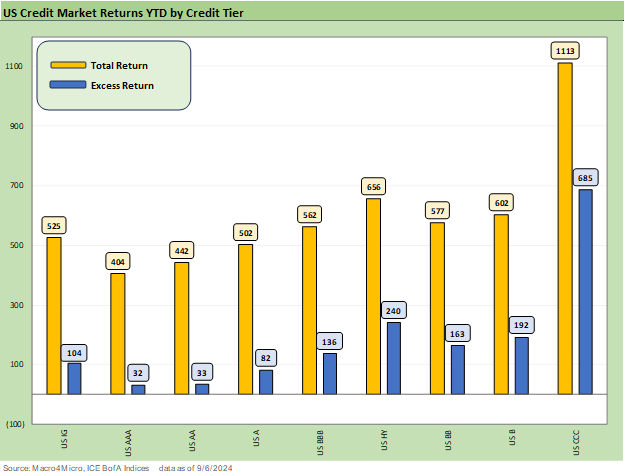
The above chart updates the running YTD total returns and excess returns for IG and HY as well as by credit tiers. After a very rough start for duration through much of 1H24, the UST benefits for IG total returns are making a comeback while spreads have narrowed slightly on the year.
The HY OAS comeback started in Nov-Dec 2023 with -108 bps of tightening to close out 2023 as the equity markets also rallied hard (see Credit Performance: Excess Return Differentials in 20231-1-24). There was not as much room in the OAS rally for 2024 after that massive wave of spread compression.
The home stretch in 2024 could be treacherous based on cyclical question marks and the basic realities of the compression of HY spreads to +339 bps as of Friday vs. the long-term median of +466 bps from Jan 1997 (see Another Volatile Week: Mini Market Lookback 9-7-24). The challenge for HY is both valuation in absolute spreads and in terms of the complexity of taking a forward-looking view on how the economic variables will play out with the mix of policy initiatives the election brings.

The above chart updates the running cumulative excess return performance for IG vs. HY. The good news is that the market is getting paid more for taking more credit risk. That is not always the case. The VIX spike briefly sent HY excess returns and IG returns sharply lower for two days ending 8-5-24, but the room for duration gains to kick in has helped IG subject to the tradeoff of how the macro picture and FOMC easing unfold.

The BB vs. BBB excess return relationship has had a mixed picture in 2024 and remains compressed. Sept is off to a bad start in the relative value relationship as the IG tiers and BBB have held in better than HY and the BB tier. The BB vs. BBB tier relationship will remain tricky from here if the cycle turns. This will be more of a name picking drill as the year winds down since there are clearly risks of more volatility.
BBB owners do not want to get caught with long-dated BBB paper getting swept up in downgrade threats and material repricing risks under recession scenarios. The autos and energy sector are major BBB tier industry groups. So is aerospace with Boeing extremely heavy in long dated BBB paper. There is room for more trouble at Boeing, who has had a very rough year since the quality chaos kicked into high gear and BA added a lot of bonds to the pile as the year continued (see Boeing: Different Scales, Different Magnitude 1-10-24).
A trade war with China in 2025 would not help Boeing. Neither would a major clash with the EU if the US drops out of NATO (the retaliation in trade clashes might be uglier) and pulls the plug on Ukraine. You cannot rule out scenarios like that (another question the intimidated debate moderators will probably not ask).

The B vs. CCC tier tells a constructive story with the CCC tier rolling along with excess returns well above a B tier that had already compressed dramatically as we discuss below. The CCC tier has been a very solid performer in 2024 as detailed above. That follows a strong 2023 for the HY tiers coming off the worst of the Fed tightening weakness that roiled HY OAS in the summer and fall of 2022 (see Return Quilts: Resilience from the Bottom Up 12-30-23).
The CCC tier has had a good run with problem names that are now more heavily about the fallen, mature HY names than over-the-top late cycle leveraged deal flow that typified past credit cycles such as 2006-2007, the TMT bubble, and the late 1980s.
The rise of private credit has seen more of the traditional late cycle excess and HY deals migrate to that growth market. That may reduce some of the worst of the risk symmetry we see in the traditional B vs. CCC bond relationships that plagued past spread waves. Or that may be wishful thinking (see The B vs. CCC Battle: Tough Neighborhood, Rough Players 7-7-24). The HY index today is a much higher quality overall issuer and index mix than every past cycle. That includes a much higher BB tier weighing at over half index face value.

The above chart updates IG spreads, which have shown resilience despite some volatility during the early August VIX spike and “carry trade” noise. At a +99 OAS to end last week, we see IG right in line with prior credit cycle peak periods even if modestly above some of the low ticks noted in the chart.
As we look back across periods of spread compression near credit cycle peaks, the +70 bps for the IG index at the end of 1997 was lower than today after the market saw the record low in Oct 1997 at +53 bps. The 1997-1998 average for IG OAS was +95 bps. Those spreads and the yields cited in the charts above offer some historical context for today’s post-rally levels. Current IG spreads as we wind down 2024 are closer to the lows of the late 1990s period than the long-term median of +132 bps noted in the median box.
Looking at the credit bubble peak of 2007 as a frame of reference, IG OAS was at +100 bps at 6-30-07. We are basically at that level as we head toward 4Q24. IG spreads had widened by mid-2007 after the period from 1H04 through 1H07 saw IG OAS averages in double digits at around +93 bps. The lows in 1H07 of +86 bps were like the lows in 2H06 at +90 bps and 1H06 at +87 bps.

HY OAS from the end of 2023 through this past Friday close of +339 bps HY OAS is slightly higher. That comes after the recent volatility as detailed in other commentaries (see HY Industry Mix: Damage Report 8-7-24, Labor Day Weekend: Mini Market Lookback 9-2-24).
For some historical perspective, HY OAS ended 1997 at +296 bps after HY OAS was inside +250 bps in Oct 1997 (+244 bps at 10-17-97). The 1997 period saw average spreads of +282 bps in 1H97, +270 bps in 2H97, and +298 bps in 1H98 before the summer chaos of Russia and LTCM (and brief Lehman funding and counterparty exposure scare) rolled in from August into the fall.
The 2007 and 1997 periods faced very distinctive backdrops in the economy and capital markets. Refinancing/repricing, and maturity/extension deals in 1H07 saw a leveraged loan volume binge that at the time was mind-boggling given the pace of transactions hitting the screen each day. HY OAS moved out to +298 bps on 6-30-07 after being as tight as +241 on 6-1-07.

The above chart updates the “HY OAS minus IG OAS” differential as a proxy for the additional compensation received for moving from the investment grade basket of bonds to speculative grade across the cycles from the 1990s TMT period (1997) through this past Friday. At +240 bps, the differential has moved wider from the recent low points but remains well below the long-term median of +328 bps and inside the +282 bps from the post-COVID median.

The “BB OAS – BBB OAS” differential has also moved wider from the multicycle lows seen in late July 2024 of +55 bps. The long-term median is +136 bps and the post-COVID median is +119 bps.
The blurring of the BB tier as a target for many BBB buyers has been a recurring theme in the post-crisis cycles as investors look for value and credits with upside. There are bonds to find in the BB tier with better risk-reward symmetry wrapped around the cycle and industry/issuer fundamentals.

The BB tier OAS is back in where it was just before the tightening cycle in early 2022 at +206 bps but is wide to the pre-COVID tights of +186 bps in Jan 2020.

The above chart plots the B tier OAS in what is traditionally the sweet spot in the HY market. The current B OAS of +325 bps is down below the cyclical lows of the post-crisis cycles (June 2014, Oct 2018, Jan 2020, Dec 2021) but still notably wide to the June 2007 lows of +236 bps.
The recent low this summer drove home the HY rally since the tightening cycle with a low of +278 bps in late July 2024 (7-23-24). The long-term median is +470 bps and the post-COVID median was +418 bps, so the B tier remains decidedly tight.

The above chart updates the path of the B tier alongside the CCC tier and offers a look at the occasional disconnect between the two. Such decompression in the bottom tiers often radiates up the credit spectrum as credit cycles turn. As we cover in detail separately, the B vs. CCC differentials are better measured in dollar price points than OAS bps during credit cycle downturns and the worst market sell-offs (see The B vs. CCC Battle: Tough Neighborhood, Rough Players 7-7-24).
A look at some yields…
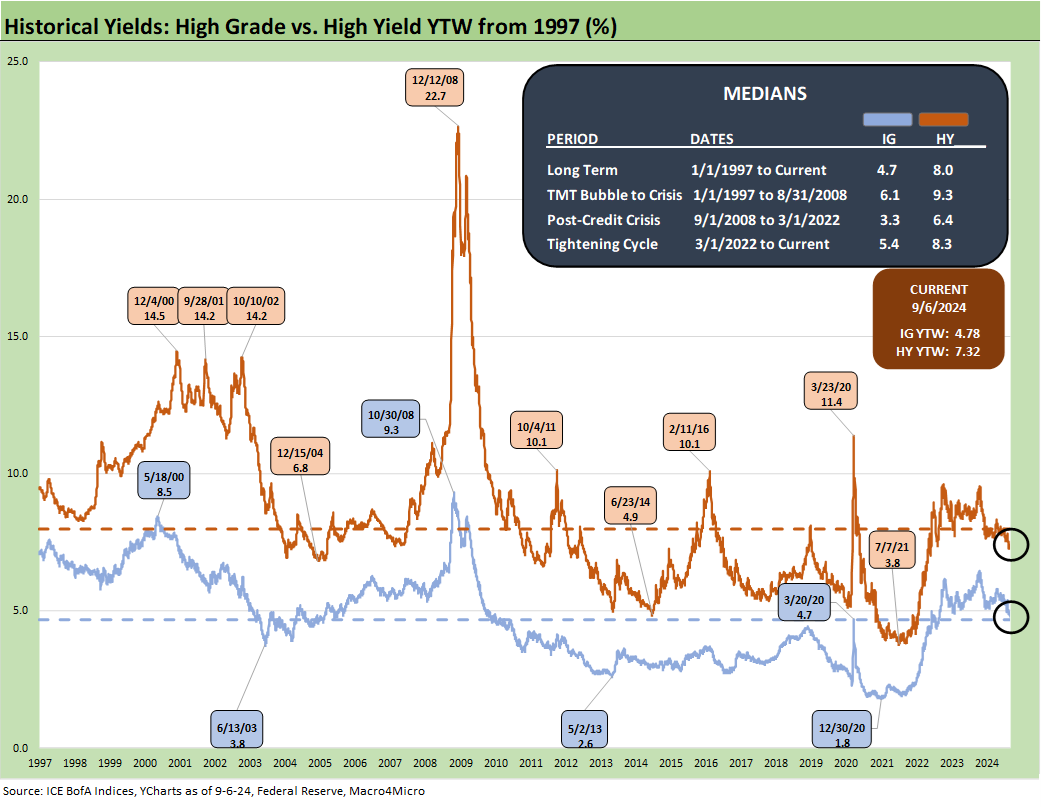
The above chart plots the timeline of IG and HY index yields with some medians from select time horizons. Now that the UST market is operating outside the distorted periods of ZIRP, QE, and normalization, we see the pre-crisis medians as the most logical comps for yields with the median before Sept 2008 at 9.3% for HY and 6.1% for IG.
We are now in a low UST world with compressed spreads, so the rates are 7.32% for HY YTW vs. 4.78% for the IG YTW as of Friday close. The median levels come with the asterisk of a much higher quality HY index mix today with the BB tier as the largest tier in size and with a very well diversified mix of industries and issuers.

The above chart plots the IG YTW on the horizontal line for Friday close, and we set that against IG index yields from late 1997 and mid 2007 credit cycle peaks in the pre-crisis periods. We also plot the UST curves for the same dates as frames of reference.
We have been highlighting the need to recognize the current UST curve as among the lowest outside the ZIRP and normalization years (see Footnotes & Flashbacks: State of Yields 9-8-24 ). Life in corporate bonds begins with the UST curve, and the new all-in credit yield framework is low by any standard outside the ZIRP years. That should temper the idea that we will get back to 4% handle 30Y mortgages any time soon. That would take some grim cyclical scenarios to get there.

The above chart does the same drill but for HY. We see the same effect where the UST rates are dominating the all-in yields given spreads that remain very tight vs. long-term medians. We are in that credit cycle waiting game at this point with the macro backdrop being the key swing vote influencing overall risky asset pricing.
The compensation for a forward default cycle on the horizon does not appear in any meaningful fashion at this point in the HY bond universe pricing framework. There are plenty of small business and private defaults showing up in industry statistics, but not in HY bonds vs. history.
See also:
Footnotes & Flashbacks: State of Yields 9-8-24
Footnotes & Flashbacks: Asset Returns 9-7-24
Another Volatile Week: Mini Market Lookback 9-7-24
August 2024 Payrolls: Slow Burn, Negative Revisions 9-6-24
Trump's New Sovereign Wealth Fund: Tariff Dollars for a Funded Pool of Patronage? 9-5-24
Goods and Manufacturing: Fact Checking Job Rhetoric 9-5-24
JOLTS July 2024: Mixed Bag, Hires Up, Layoffs/Discharges Up, Quits Flat 9-4-24
Construction Spending: A Brief Pause? 9-3-24
Labor Day Weekend: Mini Market Lookback 9-2-24
PCE July 2024: Inflation, Income and Outlays 8-30-24
2Q24 GDP 2nd Estimate: The Power of 3 and Cutting 8-29-24
Harris Housing Plan: The South’s Gonna Do It Again!? 8-28-24
Payroll: A Little Context Music 8-22-24
All the President’s Stocks 8-21-24
CPI July 2024: The Fall Campaign Begins 8-14-24
Total Return Quilt: Annual Lookback to 2008 8-14-24
HY Industry Mix: Damage Report 8-7-24
Volatility and the VIX Vapors: A Lookback from 1997 8-6-24
HY Pain: A 2018 Lookback to Ponder 8-3-24
Payroll July 2024: Ready, Set, Don’t Panic 8-2-24
JOLTS June 2024: Countdown to FOMC, Ticking Clock to Mass Deportation? 7-30-24)
Presidential GDP Dance Off: Clinton vs. Trump 7-27-24
Presidential GDP Dance Off: Reagan vs. Trump 7-27-24
2Q24 GDP: Into the Investment Weeds 7-25-24
GDP 2Q24: Banking a Strong Quarter for Election Season 7-25-24