
Goods and Manufacturing: Fact Checking Job Rhetoric
As the market wrestles with payroll numbers on Friday, we look more closely at the history of the Goods and Manufacturing payrolls across time.


In theory, facts should win and lies should be exposed in a fair fight…if only…
Facts play a very small role in political dialogue or even in the thought process of more partisan heads. Maybe this next debate will be better.
We look at one of the items on the short list of hot topics, which is employment in the manufacturing sector. We look at the history of various Goods-producing payrolls across Manufacturing, Construction, and Mining/Logging (includes the oil patch).
We detail the payroll deltas for the Trump years vs. Biden years with “manufacturing sector recovery” as a recurring political theme that needs a few facts in all the to and fro.
We break out the 2020 payroll deltas in the year of COVID, so the qualitative excuses in the Trump vs. Biden employment performance at least have a factual framework.

The above chart details the payroll additions in the Goods-producing sector and the subsets of Manufacturing, Construction, and Mining/Logging that are housed within that broader “Goods-producing” set of occupation lines in the monthly BLS report coming Friday.
We break out the data for the Trump and Biden Presidential terms (Biden through the end of July 2024). We use Dec 31 of the election years as useful start/stop dates (not election or inauguration dates) given the reporting periods from the BLS. For a frame of reference, the Good-producing payroll share is dwarfed by Services with the Goods-producing payroll subtotal less than 14% of total payroll. In the bigger picture, Services drives the jobs growth story, but the fade of industrial America and the pejorative term “rust belt” shows up in every election.
The numbers show 1.74 million Goods jobs added under Biden for +8.7% total and 285K under Trump for +1.4% total. The Trump total was dominated by Construction at +536K while the Manufacturing and Mining/Logging (include oil and gas extraction and related industries) were all negative. Biden’s line items were all positive with Construction and Mining/Logging up by double digits. Manufacturing jobs under Trump stood at -161K in contrast to Biden’s +759K. Those are the numbers according to the BLS.
The COVID crutch…
We hear “but COVID…” in a lot of the discussions, and that is clearly valid, so we break out the 2020 payroll deltas in the next chart that show a -948K decline in Goods for 2020 and -591K for Manufacturing.

The math is easy enough to play with if you assume all the jobs Trump lost were the same ones that Biden added (that is, add 2020 back to Trump and deduct them all from Biden). Then the trick is looking back just at 2021, which is another exercise. Unless you believe that it took more than a year to rehire them to all the same jobs, the banter gets ridiculous.
As we frame in the chart below, the 2022 adds to Goods exceed the 2021 adds. The stall came later after the tightening cycle. The ZIRP year of 2021 extended into 2022 and goods demand was hot.

After a while, it is a silly exercise in speculation and extrapolation. One reality is that the Trump economy was already struggling in 2019, and the FOMC had to come to the rescue with three cuts later in 2019.
As the Trump tariff plan played out, the goal of crushing global supplier chains that took years to build did not prove to be an aphrodisiac for capital budgeting growth for manufacturers. Capex struggled and the FOMC ended up easing to support the economy in 2019 on the basis of weaker investment and exports (“growth of business fixed investment has been soft” “business fixed investment and exports have weakened” per the FOMC statements).
There is no hiding from the numbers, but opinions and counterfactual scenario spinning is old school politics. The year 2018 was no picnic for the markets either (see HY Pain: A 2018 Lookback to Ponder 8-3-24). That will not likely come up when the “economic miracle” and “greatest economy in the history of the world” gets repeated as a theme in next week’s debate.
Further below we break out some of the manufacturing rebuild themes. These got a little better the past few years, but using the year 2000 as a frame of reference still tells a bleak story as low-cost supplier chains were built out across the world as GDP kept growing and manufacturing payroll downsized to lower run rates.
Reversing that process is not like losing weight. Many would argue it is more like a scar that will always show and that trying to fix it with extreme measures (blanket tariffs) might just make it worse with the side effects of trade wars and retaliation, inflation, margin pressures, and damaged industry performance.
Manufacturing renaissance?
The manufacturing renaissance had started to become a punchline like “Infrastructure Week” based on the payroll data. Under Biden, Manufacturing is finally ringing up some wins, and the US legislated a bipartisan infrastructure bill that has been driving a lot more construction jobs. It is in the numbers. Construction got a lift from low rates under Trump and the project support legislated under Biden (and some low rates in 2021 and part of 2022).
Restoring the US manufacturing base has been a dominant theme for quite a while going back to the George Bush years and the term “manufacturing renaissance” was getting tossed around quite a bit in the Obama years.
Then Trump decided tariffs would be the passport to reshoring and new investment when taken in tandem with a major tax cut that encouraged investment in equipment. This did not materialize.
Biden continued most of those tariffs even if some were rebadged from Section 232 tariffs (national security) to “voluntary” quota systems and various face-saving diplomatic labels (see Trade Flows 2023: Trade Partners, Imports/Exports, and Deficits in a Troubled World 2-10-24).
Spooking manufacturers by raising their supplier costs and reducing their margins or driving them to increase prices is a tough sell when policy uncertainty would be a constant risk (they did not know if Biden would continue the Trump tariff programs).
With respect to the weak exports that the FOMC cited back in 2019, the easy conclusion is that trade retaliation is not an export tailwind by definition!
From NAFTA and Clinton and into the post-crisis lag…

The longer-term timeline above frames the direction of Manufacturing, Durables, and Nondurables payrolls from the start of the NAFTA year of 1993 after George HW Bush signed the deal and Clinton went about getting it legislated by Dec 1993 and went effective at the start of 1994.
As a reminder, NAFTA started as a GOP initiative and ended up embraced by Clinton and gained bipartisan approval (with a lot of Democratic nays). Border state GOP leaders were on board (ex-CA in some cases). Many state GOP leaders tended to get amnesia on this history when Trump would go off on NAFTA ahead of the 2016 election.
The mild recession and protracted default cycle after 2000 did not get any help from the dagger of the credit crisis of 2008 as the systemic swoon wrapped up a disastrous decade with the recession trough in June 2009. That path of pain during the first decade of the new millennium is clear in the time series. That was also a “lost decade” for equities.
The NAFTA effect only rolled in at a lag, but most point at the ramp-up of China after 2000 as the main driver of supplier chain overhauls in the US and EU. The path of the Manufacturing payrolls saw pressure from China as the trade deficit soared after 2000 and then China became one of the two major low-cost supplier chain dependencies for the US, joining Mexico with its NAFTA head start (see The Debate: The China Deficits and Who Pays the Tariff? 6-29-24).
The China trade deficit peaked under Trump and hit a low under Biden. Trump misrepresented that in the first debate and said it peaked under Biden. Biden failed to respond.
As seen in the chart above, the struggle to get back anywhere near Clinton era employment levels continues. Obama’s first term was a very slow employment recovery that accelerated in the second term.
During Trump’s first 3 years, his annual run rates in total payroll additions were lower than the annual average from Obama’s second term. So, Obama handed Trump the baton and it might have been sustained if not for the tariff battles and eventually COVID blowing up the jobs market.

Rolling the tape forward a bit from the NAFTA launch to the year 2000 as a start date with the arrival of China in force, the above chart looks at payroll in Goods-producing sector including Manufacturing and Construction from 2000. The year 2000 was a year that marked the NASDAQ peak (March 2000) and the start of a major default cycle. That 2001 recession led to the beginning of an FOMC easing cycle in Jan 2001 (-50 bps to start) as the double dip default cycle extended into 2002 (see Greenspan’s Last Hurrah: His Wild Finish Before the Crisis 10-30-22).
Some very high-profile industry crises (e.g., autos 2008-2009) accelerated the process of downsizing, but the use of China as a low-cost supplier had been underway for years and even a major talking point by the auto OEMS and suppliers as a positive factor (“low-cost countries”) in the early 2000s. That is not just for the Auto OEMS, but also for the major Tier 1 suppliers who worked religiously to build out lean supplier chains down in the Tier 2 and Tier 3 ranks.
Over in capital goods, Caterpillar was another notable major OEM who had been working on “leaning” its supplier chain with a vengeance since the early 1990s, when it essentially broke UAW strikes and imposed a contract. As a major exporter, CAT was also looking to global supplier chains as somewhat of a currency hedge in addition to CAT finding a means of getting closer to emerging markets and infrastructure growth opportunities. The story is always more complicated than just the term “race to the bottom” even if that implies in many cases finding low-cost labor operations like Mexico and China.
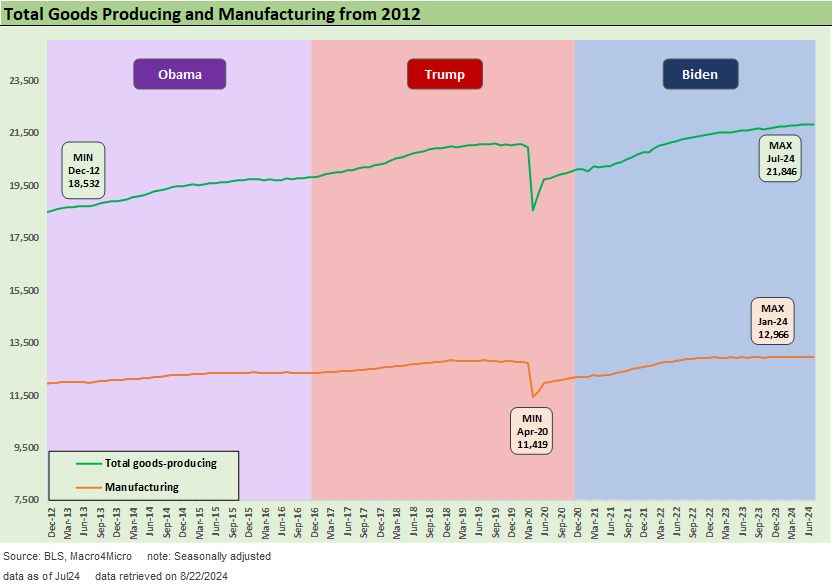
The shorter timeline above looks at Good-producing and Manufacturing from the start of Obama’s second term in 2012. At that point, most of the credit crisis effects had been mitigated by a few years of ZIRP and QE and a healing consumer sector.
A slow upward slope in Good-producing payrolls has been the best-case scenario. Anyone who thinks they can magically steepen that with tariffs is selling a bill of goods that are proven to be damaged policy options and already shown to be counterproductive. Tactical and limited tariffs have a role, but blanket tariffs are just a case of “it beats thinking too hard” and “sounds better at rallies.”
The steel example…
Autos is one mature sector that went through radical downsizing at the former Detroit 3, but the fate of the steel sector is more relevant. After all, the auto transplants from Asia and Europe have seen explosive growth in the US.
I started my research career on the buyside covering autos, cap goods, steel/metals, and chemicals/energy (I know, too many!). At the time, the integrated steelmakers I covered (e.g., US Steel, Inland, Bethlehem, Armco were initially all investment grade (ex-J&L Republic Steel). They were all headed for a freefall within years except US Steel (who was quickly turning into an integrated oil company in asset value with the Marathon deal that closed in early 1982).
Over the next decade, steel technology would change dramatically and “minimills” (“electric arc furnace” steelmakers using scrap) were spreading like bacteria and issuing HY bonds while eating into the lower value added, more commodity like product groups. The legacy companies spiraled downward.
I remember reading a book (“American Steel”) on this small steelmaker named Nucor as the recession unfolded in the early 1990s and thinking “uh-oh.” Nucor soared and the legacy players kept crashing. I had worked on a HY bond deal for Weirton Steel in 1989, and I had a friend working there that also encouraged my focus. The steel industry and its role in US history (think Carnegie and Frick) always made it interesting.
At the risk of already burying the lede on this topic, tariffs can only do so much. Steel showed that.
The other demonstrated fact of economic life in steel is that tariffs on steel mean downstream customers pay more since (no matter what Trump thinks) the buyer pays the tariff. The domestic players at worst could see price support (that is, set a price floor they would not have had otherwise). As we saw with steel, however, the effect is those tariffs raise US prices. For steel, the clash was not with China. It was primarily with the EU.
As of today, US Steel is the only one left among those early 1980 integrated steelmakers and has its own set of election year headlines around the Nippon Steel merger. Among the most iconic names, Bethlehem Steel was crushed, liquidated, assets sold off, healthcare cancelled, and the pension handed off to the PBGC (by Trump’s former Secretary of Commerce Wilbur Ross). No amount of steel tariffs (e.g. Bush in 2002) was going to save the integrateds in those days.
A common fate for many of the surviving, viable US integrated steel assets was a sale to Mittal, a global leader and consolidator in the steel sector. Eventually many assets found their way into the hands of ArcelorMittal as the merged post-Mittal entity and some later owned by Cleveland-Cliffs as the new steel sector consolidator in the US.
The manufacturing jobs topic will hopefully show up in the debate and someone will dare to cite some facts. That duty will fall on Harris if she prepares better than Biden and can think on her feet. Trump will not admit any flaws in his tariff plan or relative employment history in his single term. In the meantime, the Manufacturing job outlook remains weak.
Contributors:
Glenn Reynolds, CFA glenn@macro4micro.com
Kevin Chun, CFA kevin@macro4micro.com
See also:
JOLTS July 2024: Mixed Bag, Hires Up, Layoffs/Discharges Up, Quits Flat 9-4-24
PCE July 2024: Inflation, Income and Outlays 8-30-24
2Q24 GDP 2nd Estimate: The Power of 3 and Cutting 8-29-24
Harris Housing Plan: The South’s Gonna Do It Again!? 8-28-24
Payroll: A Little Context Music 8-22-24
All the President’s Stocks 8-21-24
Total Return Quilt: Annual Lookback to 2008 8-14-24
HY Industry Mix: Damage Report 8-7-24
Volatility and the VIX Vapors: A Lookback from 1997 8-6-24
HY Pain: A 2018 Lookback to Ponder 8-3-24
Payroll July 2024: Ready, Set, Don’t Panic 8-2-24
JOLTS June 2024: Countdown to FOMC, Ticking Clock to Mass Deportation? 7-30-24)
Presidential GDP Dance Off: Clinton vs. Trump 7-27-24
Presidential GDP Dance Off: Reagan vs. Trump 7-27-24
2Q24 GDP: Into the Investment Weeds 7-25-24
GDP 2Q24: Banking a Strong Quarter for Election Season 7-25-24