
Footnotes & Flashbacks: State of Yields 9-7-24
We update the direction of UST yields as this week flipped the script on the prior week with a more pronounced bull steepener move.


This was supposed to be easier with the Fed.
The UST curve rallied as cyclical sentiment took a hit again on the back of soft August payroll numbers and negative revisions for July and June (see August 2024 Payrolls: Slow Burn, Negative Revisions 9-6-24).
A fresh equity beatdown for the week did not help risk appetites and sent more investors into a fresh round of worries over risk repricing and questions around the durability of the consumer in the face of such headlines.
This week brings CPI and PPI for one last stop on the road to the FOMC meeting with retail sales the following week just before the next dot plot and expected Fed action.

The UST curve was moving lower again this week after a modest bear steepener the prior week (see Labor Day Weekend: Mini Market Lookback 9-2-24). As we cover in our separate Footnotes publication on Asset Returns (see Footnotes & Flashbacks: Asset Returns 9-7-24), bond ETFs posted up good numbers this past week with the long duration 20+ UST ETF (TLT) grabbing the #1 spot for the week in the group of 32 benchmarks and ETFs we track. We saw the 7 bond ETFs in the mix grab 7 of the 9 asset lines that were positive this week with 23 equity line items in negative range.
When we look across the raw numbers for the yield curve detailed in the box, it is clear enough that we don’t see such low rates across past cycles. The historical cycles we plot include periods without the ZIRP, QE, and normalization distortions we have seen since the 2008 crisis. Such FOMC distortions will not be in place any longer barring a massive setback or exogenous shock. In other words, the cycles above are the more logical comparisons, not the UST curve of periods such as 2009 to 2014 (ZIRP) or Dec 2015 to 2018 (normalization attempts).
The front end is in the hands of the FOMC, but a 3.7% 10Y will be challenged to push lower despite Trump assurances that he will do just that. Harris has not promised she can control oil or the yield curve since that would be false. However, both can take actions to indirectly influence such variables. All they need to do is explain how and over what time frame. That has not happened yet with either candidate.
The reality is that the market controls the long end, and the funding demands and rising UST supply will keep hitting records. The inflation X factor is much better now, but the fiscal actions and trade risks are looming, and the gap in proposed policies in the election could not be wider or deeper than they are now. Tariffs are at the top of the list from the cost and price side of the inflation chain effects in the real economy while the UST supply will be set by fiscal demands and the legislative output from Washington.
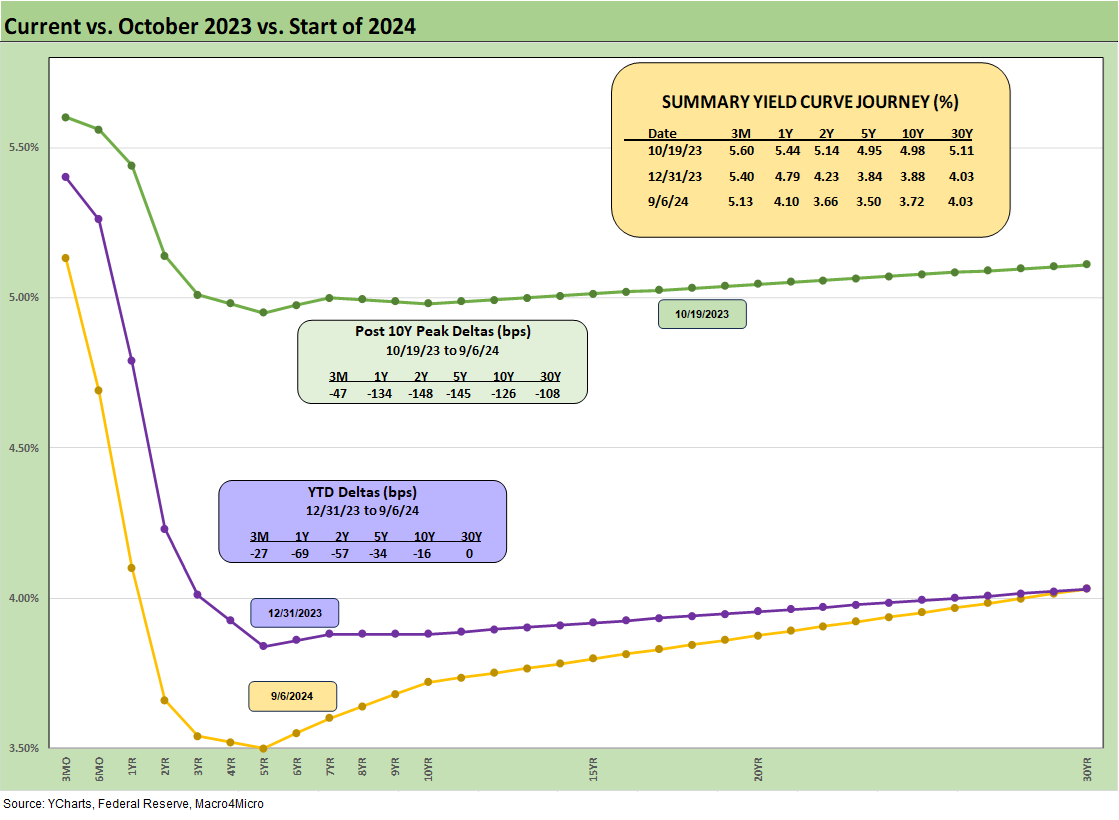
The above chart details the downward shift of the UST curve from the 10-19-23 peak and also since the start of the year. The bull steepener from 10-19-23 has been pushing duration returns higher over the summer and into Sept after a rough stretch through much of the YTD period. That upward UST migration in 1H24 hurt bonds but has since turned the performance around for duration returns (see Footnotes & Flashbacks: State of Yields 7-1-24).
Last year saw a massive rally in bonds in Nov-Dec 2023 after the Oct 2023 peak. There should be some adventures in the fall 2024 season as well with FOMC actions ahead, more econ indicators, and the election test on how the market will react to the winner (and whether both candidates even recognize a winner).
The cyclical backdrop is very different than what was seen in the period many cite when comparing the current situation to the FMOC easing cycles of Jan 2001 (TMT bubble imploding) and Sept 2007 (credit crisis and systemic meltdown risk). We covered that already in other publications. This next move will be the first “normal” easing cycle since the credit crisis and ensuing ZIRP, QE, and normalization years.

The above chart highlights the UST migration across the tightening cycle with the memory box included in the chart on the timing and magnitude of the Fed hikes. We await the Sept 17-18 FOMC meeting and next dot plot, but the expectation generally is for a series of -25 bps moves lower and not an upfront -50 bps shot unless something material happens in the next 10 days or so. CPI numbers come this week, but then it is “a wait and see.”
Whether the 10Y can shift at the same rate as fed funds is highly doubtful with a bull steepening likely but a question on how big the 10Y bull can possibly be from the current 3.7%.
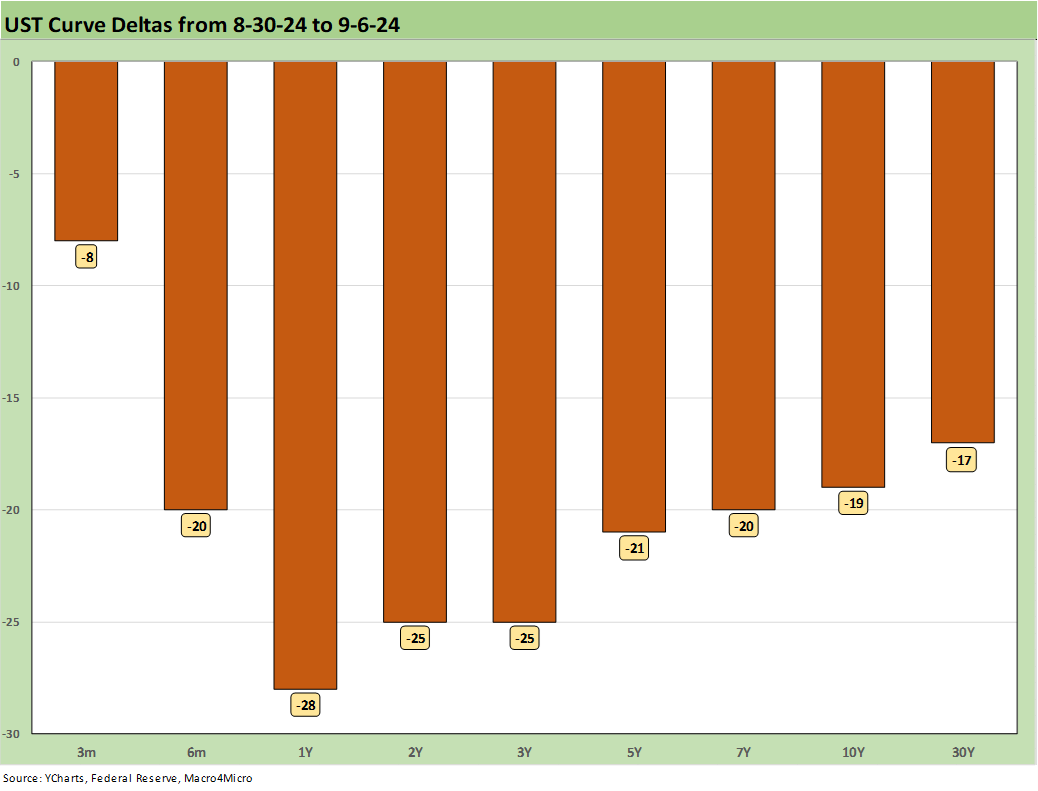
The above chart breaks out the UST yield curve deltas over the past week. It was a much bigger move lower than the prior week’s move higher.
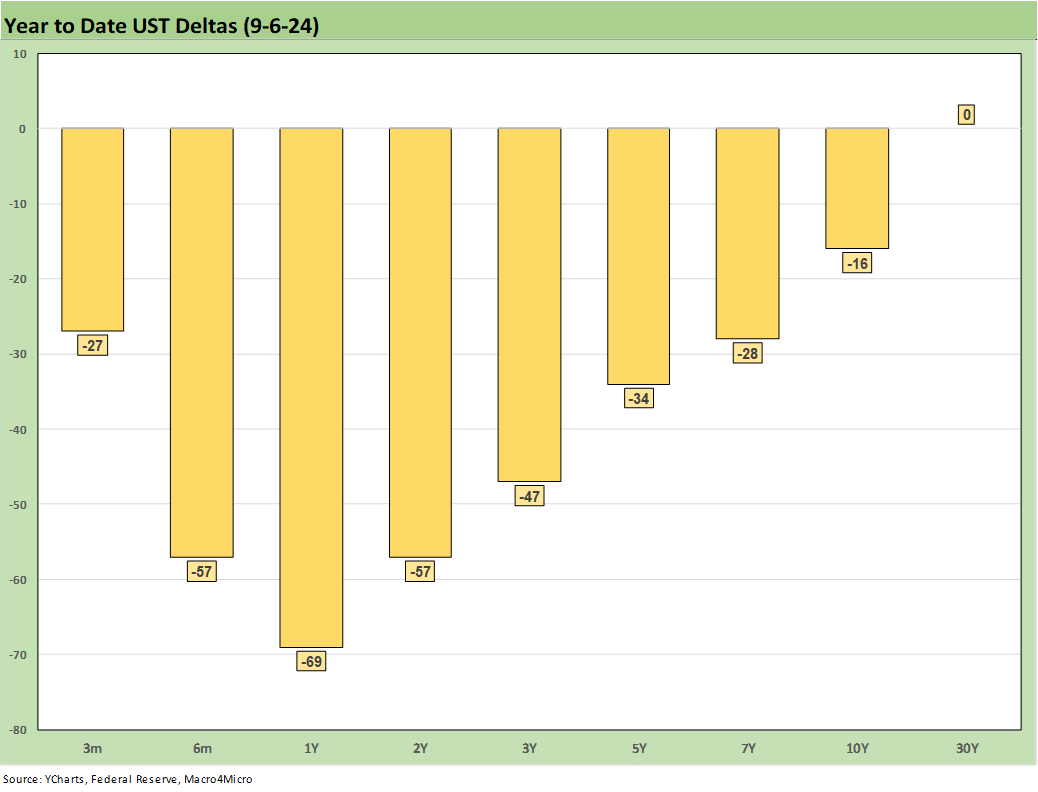
The above chart updates the YTD UST deltas in what is a bull steepener formation that has now left a few more segments of the UST curve upward sloping as we cover further below.

The above chart captures the full run rate of UST deltas from the date when the 10Y UST rates peaked a fraction below 5.0% on 10-19-23. That has been a great move as the crow flies from that date but was very uneven with a UST shift higher through much of 2024 until the latest rally and Fed comments. The supportive economic data to arm the FOMC with easing impulses cuts across both inflation and employment and some additional support from soft manufacturing data along the way.
The consumer has held in relatively well in consumption as seen most recently in the personal income and outlays release (see PCE July 2024: Inflation, Income and Outlays 8-30-24) as well as in the second estimate revisions for 2Q24 GDP (see 2Q24 GDP 2nd Estimate: The Power of 3 and Cutting 8-29-24).
Inflation has cooperated but will not be able to hit 2.0% in Core PCE barring major setbacks in the economy. On the CPI side of the ledger, CPI ex-Shelter has been very supportive (see CPI July 2024: The Fall Campaign Begins 8-14-24). The housing sector and shelter issues will be featured heavily in the election battles (see Harris Housing Plan: The South’s Gonna Do It Again!? 8-28-24).
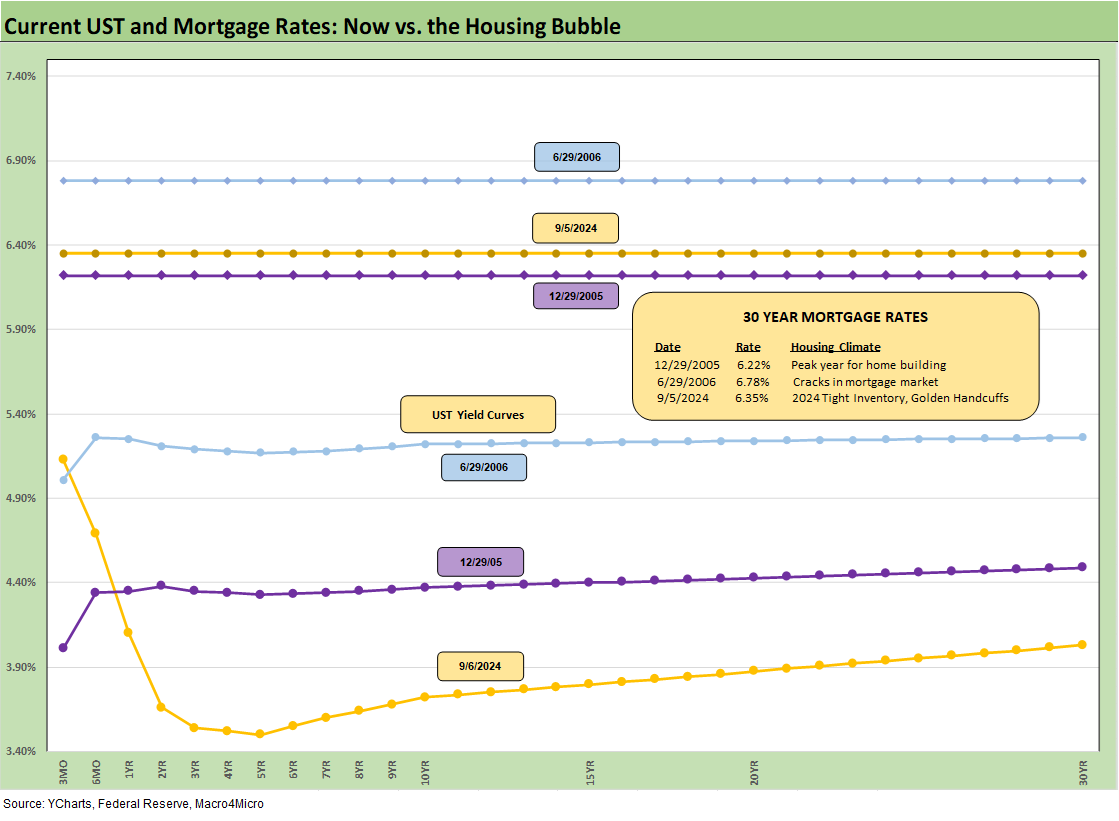
The above chart includes the update for the most recent Freddie Mac 30Y benchmark which has dropped to 6.35% as of Thursday ahead of the payroll data. Looking around some of the mortgage trade rags, the week 30Y mortgage rates appeared to end under 6.3% on Friday, so the moves are favorable even if a very long walk for the 60% of mortgage holders below 4% and the 30% below 3%.
The chart above includes the Freddie Mac 30Y on the horizontal lines for some historical comparisons including the end of 2005, which was the peak homebuilder year, and also for mid-2006, when signs of the RMBS market cracking were appearing. We include UST curves for each date. The current front end UST inversion stands out (and then some!) and the 10Y UST is materially lower today.
The current market needs tighter mortgage spreads or even lower 10Y UST to continue to ease affordability strains. The “locked-in” low mortgages for existing homeowners will continue to limit existing home inventory or more home sellers will need to move the needle on prices.

The above chart updates the long-term time series for the 2Y to 10Y slope, which got a lot of attention this week for being positive again. As the chart shows for the various slope segments we watch and the long-term medians, this brings 3 of the 6 UST segments back to a positive slope with 2Y to 30Y, 2Y to 10Y, and 5Y to 30Y upward sloping. The 3M to 5Y and 3M to 10Y remains highly inverted. For 2Y to 10Y, the long-term median is +94 bps vs. the current +6 bps.

The above chart shortens up the slope timelines for a more granular view of the ride from early 2021 and ZIRP, across the tightening cycle, and then to the point where the 2Y to 10Y has “un-inverted” (barely).

We wrap with our usual chart that shows the UST migration and running UST deltas from March 1, 2022. We include the 12-31-20 UST for a frame of reference along with the UST peak 10Y UST curve on 10-19-23.
The focus now is on how quickly the FOMC is willing to move the protracted steep inversion lower while the economy is still expanding (see 2Q24 GDP 2nd Estimate: The Power of 3 and Cutting 8-29-24, GDP 2Q24: Banking a Strong Quarter for Election Season 7-25-24).
See also:
Footnotes & Flashbacks: Asset Returns 9-7-24
Another Volatile Week: Mini Market Lookback 9-7-24
August 2024 Payrolls: Slow Burn, Negative Revisions 9-6-24
Trump's New Sovereign Wealth Fund: Tariff Dollars for a Funded Pool of Patronage? 9-5-24
Goods and Manufacturing: Fact Checking Job Rhetoric 9-5-24
JOLTS July 2024: Mixed Bag, Hires Up, Layoffs/Discharges Up, Quits Flat 9-4-24
Construction Spending: A Brief Pause? 9-3-24
Labor Day Weekend: Mini Market Lookback 9-2-24
PCE July 2024: Inflation, Income and Outlays 8-30-24
2Q24 GDP 2nd Estimate: The Power of 3 and Cutting 8-29-24
Harris Housing Plan: The South’s Gonna Do It Again!? 8-28-24
Payroll: A Little Context Music 8-22-24
All the President’s Stocks 8-21-24
CPI July 2024: The Fall Campaign Begins 8-14-24
Total Return Quilt: Annual Lookback to 2008 8-14-24
HY Industry Mix: Damage Report 8-7-24
Volatility and the VIX Vapors: A Lookback from 1997 8-6-24
HY Pain: A 2018 Lookback to Ponder 8-3-24
Payroll July 2024: Ready, Set, Don’t Panic 8-2-24
JOLTS June 2024: Countdown to FOMC, Ticking Clock to Mass Deportation? 7-30-24)
Presidential GDP Dance Off: Clinton vs. Trump 7-27-24
Presidential GDP Dance Off: Reagan vs. Trump 7-27-24
2Q24 GDP: Into the Investment Weeds 7-25-24
GDP 2Q24: Banking a Strong Quarter for Election Season 7-25-24