
Footnotes & Flashbacks: State of Yields 7-28-24
The week’s UST deltas after PCE and GDP reports saw modestly favorable moves and bonds holding recent positive returns.


The inflation waves are easier to ride from here…
A delicate balance across the favorable GDP report, PCE prices, and consumption vs. earnings trends did not derail the Fed easing optimism, but the market faces a busy week ahead with the FOMC meeting, JOLTS/payroll, and more key earnings reports that will keep the data-driven handicapping going.
We are still waiting for more coherent political discussions of how different party policies deal with trade and inflation risks (notably via tariffs for the GOP) and how this all dovetails with the ever-increasing pressure of UST supply.
We look again at the 5Y to 30Y slope for another angle on a UST segment that at least is upward sloping and is joined this week in the positive slope club by the 2Y to 30Y segment.
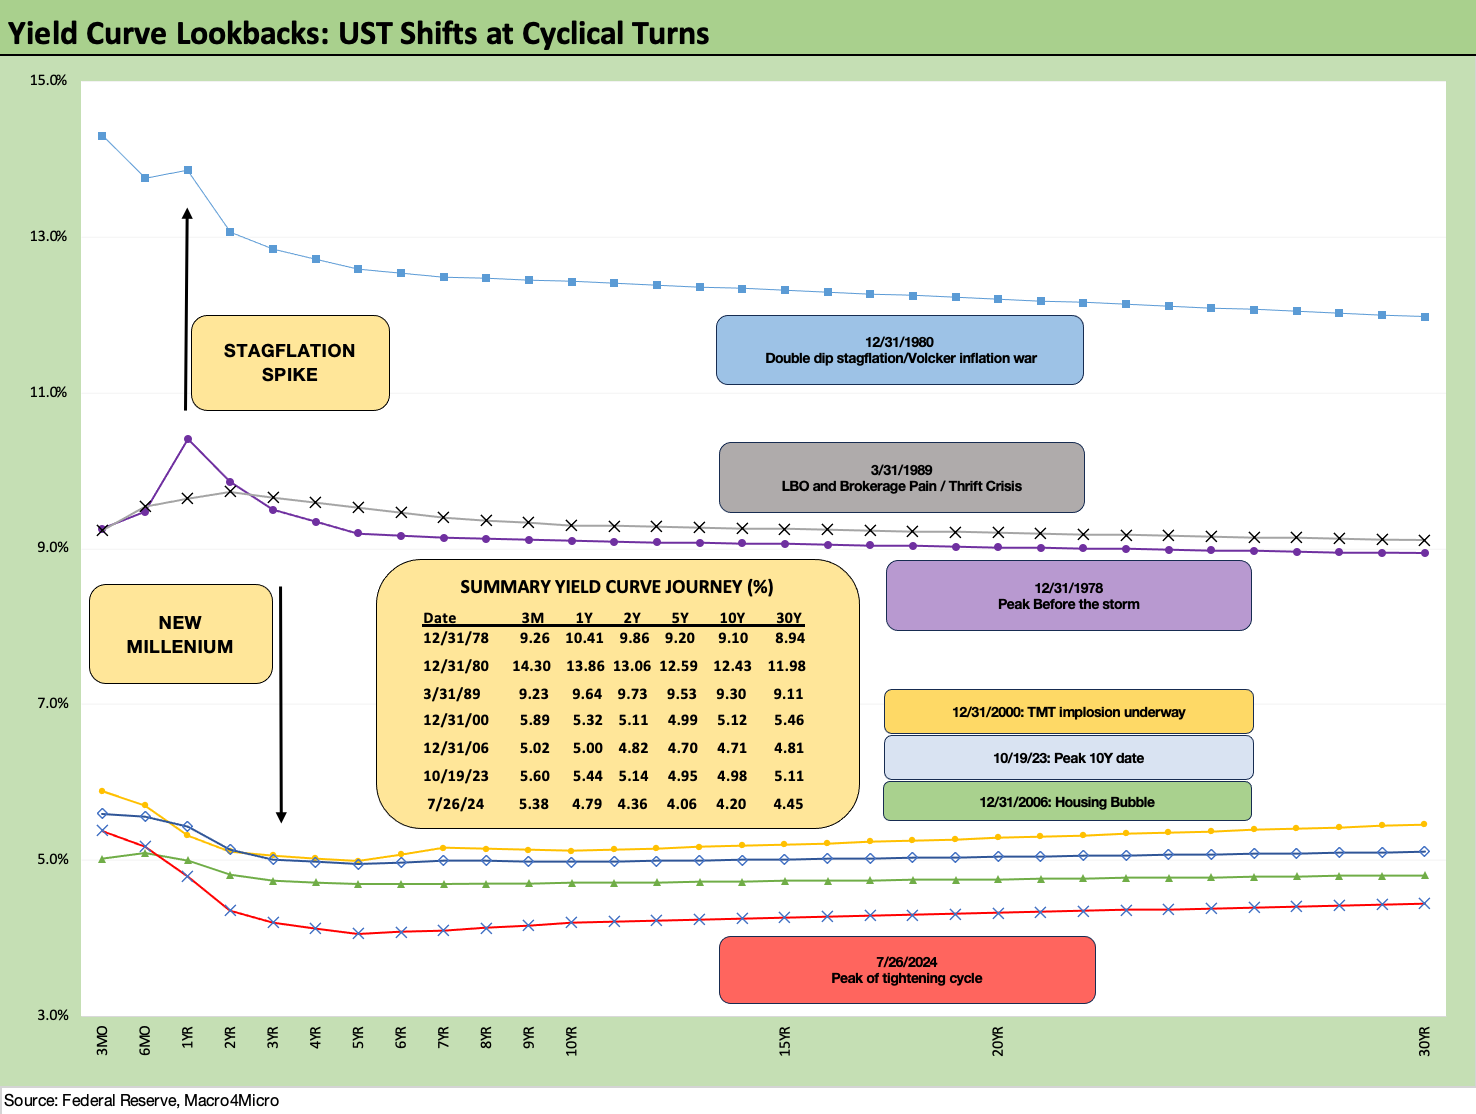
The above chart updates the historical timeline of UST curves with a focus on those periods outside the world of ZIRP and normalization that dominated from late 2008 to March 2022. When we hear about Fed easing and lower run rates of inflation, we keep waiting for the powers that be to detail how they see the path to lower rates from 5Y to 30Y when those rates are already quite low vs. periods when UST financing demands were much lower.
We are starting to see more forecasts of -50 bps by year end in fed funds, but the 10Y focus for mortgages remains a much tougher “rhetorical sell job” for a major rally. We have seen a few forecasts with minimal deltas for 10Y UST by year end and more room into 2025. That is a major factor in the housing sector and homebuilding story.

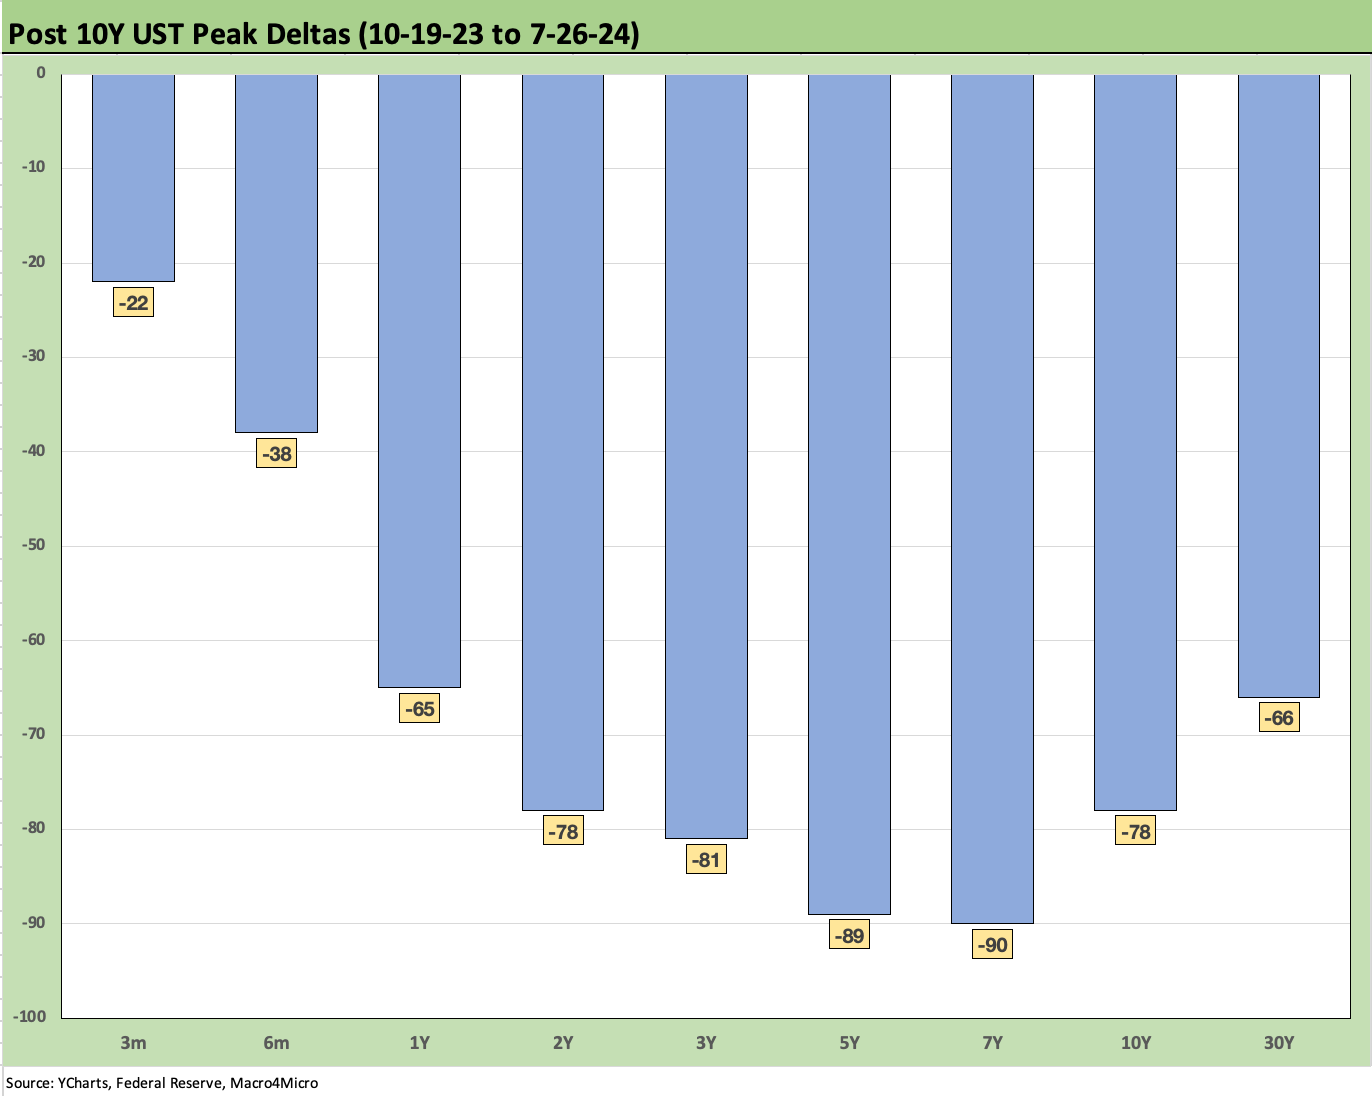
The above chart updates the UST deltas across the UST curve from the 10-19-23 peak for the 10Y UST and for the YTD UST deltas to late Friday levels (7-26-24). As we cover in our Footnotes publication on Asset Returns, the recent trends have kept bond ETF and benchmark returns in positive territory for 1-week, 1-month, and 3-months.
The strongest numbers of the group are seen in the 3-month horizon returns for the long duration 20+Year UST ETF (TLT). The TLT is negative YTD, however, as the UST curve slowly retraces some of the major UST rally gains seen in Nov-Dec 2023 after a rough start to 2024 for duration.
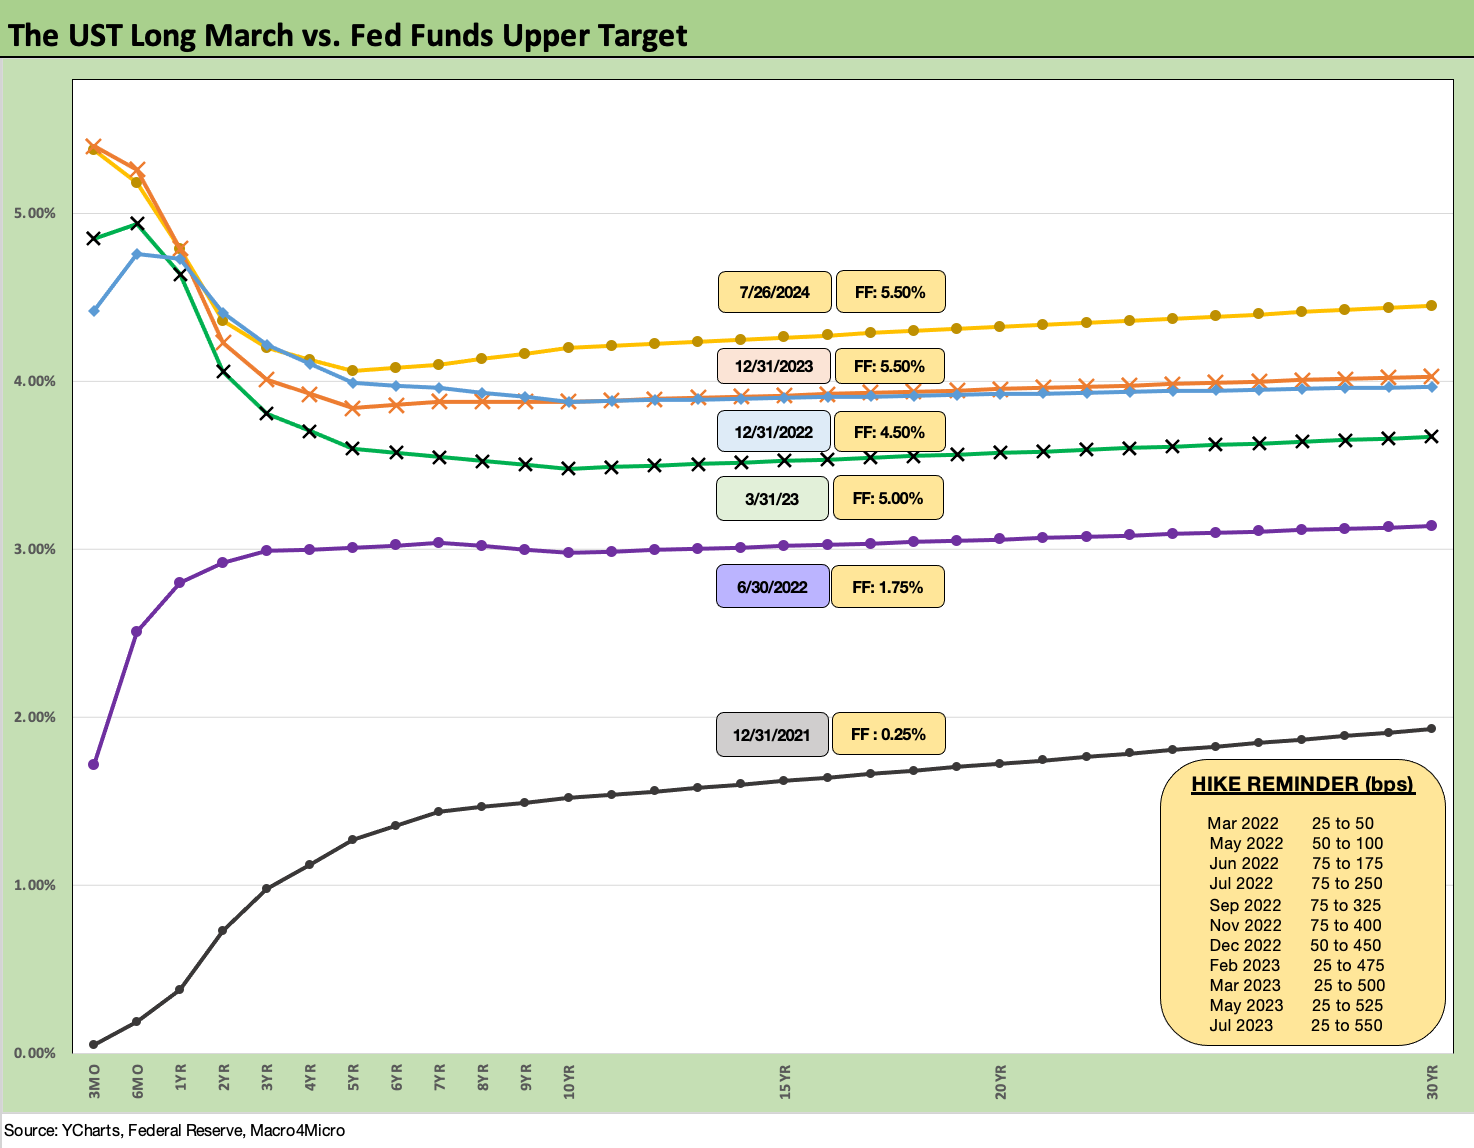
The above chart is our placeholder for the inevitable test of whether the 10Y UST will follow fed funds lower in the (likely) event of an FOMC easing in the fall. As noted in the chart, the UST curves for 12-31-23 and 12-31-22 converged further out the curve around 10Y despite a 100 bps differential in fed funds.
The FOMC statement this week will be interesting given the growing expectation for easing. The politics of a cut will have the GOP screaming bloody murder, and we can assume toxicity will be in the air. The chart above includes a memory box on the timing and actions of the FOMC, and the 1-year anniversary of the last fed action (25 bps hike) was July 2023. It has been a long wait since the last move with CPI and price inflation much lower (see PCE June 2024: Inflation, Income, and Outlays 7-26-24, CPI June 2024: Good News is Good News 7-11-24).

The above chart plots the UST deltas for the past week with more of the action on the front end with -5 bps in 10Y and flat in 30Y. For the week, the UST 1Y-3Y UST ETF (SHY) slightly outperformed the long duration 20+ Year UST ETF (TLT). As detailed further below, we now see 2Y to 30Y upward sloping (even if barely).
The above chart updates another visual on the running UST deltas from 10-19-23 through Friday. That is a big bullish move for duration since late Oct through today with the really strong moves in Nov-Dec 2023 (see Footnotes & Flashbacks: State of Yields 1-1-24) ahead of some mixed (and now declining) bearish givebacks along the way YTD 2024.

The above chart updates the UST deltas YTD that have been slowly whittled down in recent weeks on better inflation news and more muted – but still healthy – consumer activity.

The above chart updates the 30Y Freddie Mac benchmark mortgage with a minimal move up to 6.78% this week from 6.77% last week. We saw a 5-week high of 6.95% early in July, so the 30Y mortgage has been stubborn in a pattern that will get tested after an FOMC ease in the fall.
We include a lookback across history to the peak homebuilding year of 2005 and then a mid-2006 date to capture when the market was starting to show worries over RMBS during the subprime excess. We plot the Freddie Mac 30Y for each period on the horizontal lines and plot the UST curves for each date.
The Friday UST close is the lowest UST of the three dates beyond 2Y UST but current mortgage rates have converged with those of mid-2006 when the UST curve was much higher than today. The irony of those earlier mortgage rates is that 2006 was a ticking bomb in terms of mortgage quality. We know how that all ended.
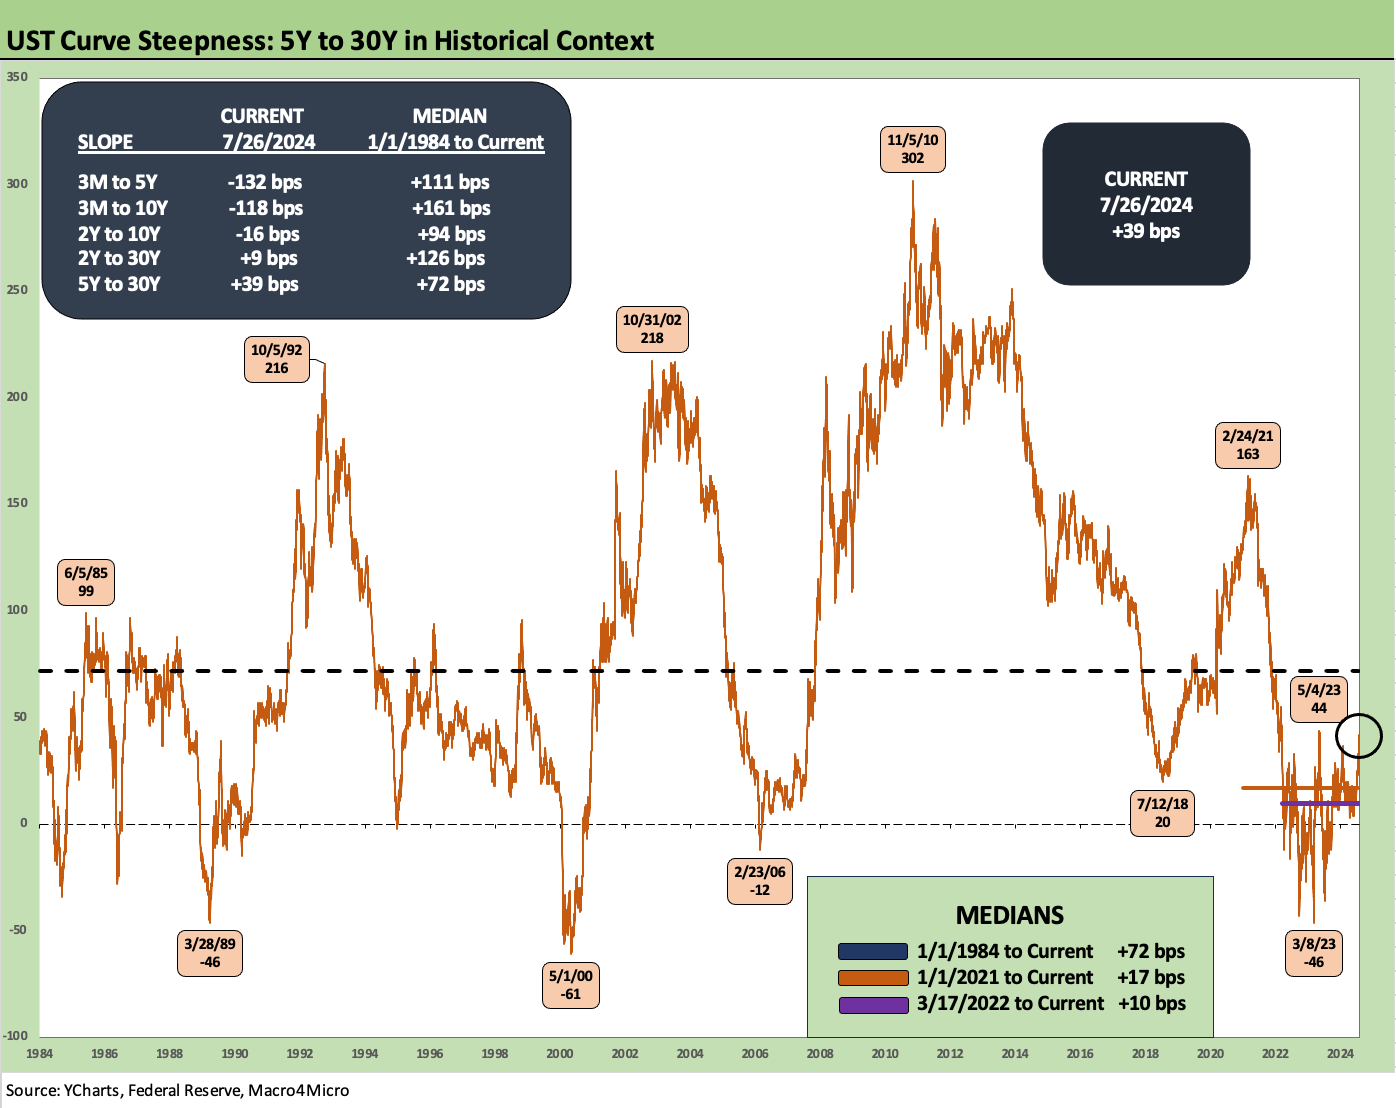
The above chart updates the 5Y to 30Y UST slope since 1984. We detail the medians for the 5Y to 30Y UST segment in the lower right box. We update the current slopes for all the UST segment slopes we watch and those long-term medians in the box in the upper left.
The current +39 bps for 5Y to 30Y is closer to the median of +72 bps than other segments given the distance from the Fed-anchored front end. The 2Y to 30Y is also upward sloping to close the week but has a very long way to go with a median of +126 bps.

The above chart looks at the same 5Y to 30Y slope but shortens up the timeline to the start of 2021 in the ZIRP period ahead of the start of tightening in March 2022. We see the slope peak at +163 bps in Feb 2021 before the post-tightening ride to an inversion of -43 bps in Sept 2022 and -46 bps in March 2023.
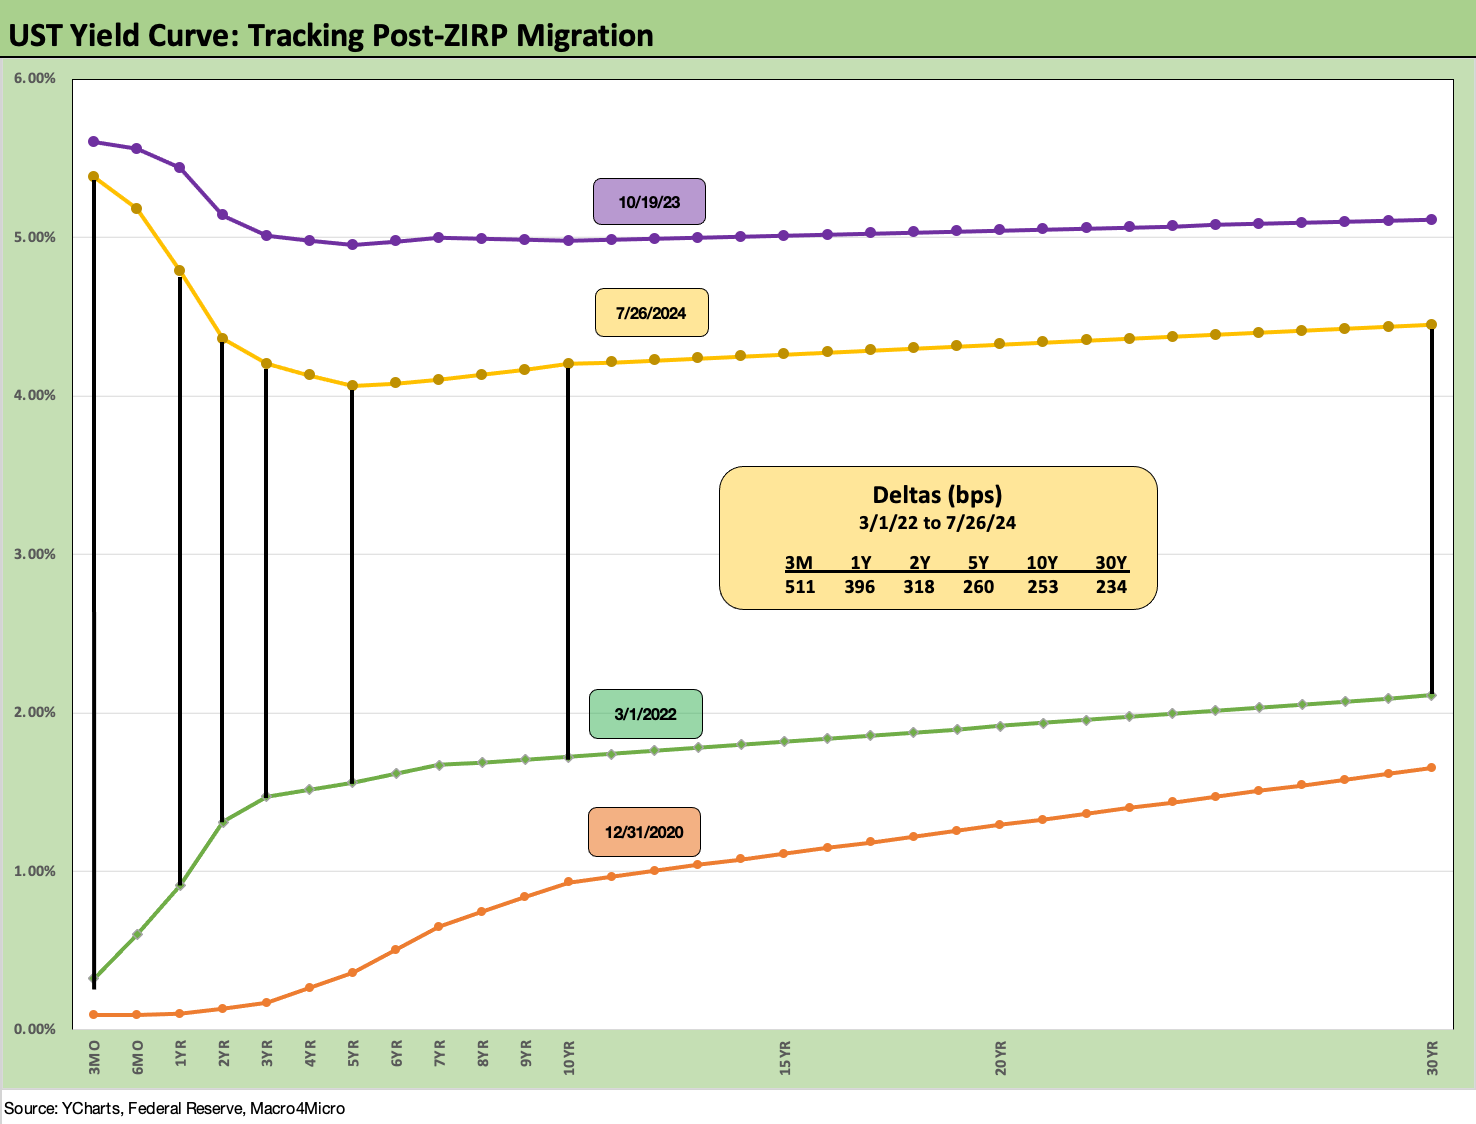
We wrap with the running UST deltas from March 1, 2022 to mark the month when ZIRP ended (effective 3-17-22). We also include the UST curve from the peak date of the 10Y UST (10-19-23) and the 12-31-20 UST curve for frames of reference.
We have seen bear flatteners and upward shifts before with 1994 a notorious one (Bear Flattener: Today vs. 1994 and Aftermath 10-18-22), but this latest monetary cycle was the first true inflation war since the Volcker years. The post-March 2022 UST migration ran from a bear flattener into a bear inversion that saw sustained expansion, no recession, very strong employment trends, and a rapid decline of inflation without anything close to a contraction in PCE.
Recessions are very hard to have with positive PCE, record job growth, and sustained strength in fixed investment of the sort seen in this cycle (see 2Q24 GDP: Into the Investment Weeds 7-25-24). The resetting of the “household menu” from inflation has been brutal, but the experience of the early 1970s and late 1970s/early 1980s was much worse. That is from ringside experience as well as by the recorded numbers (see Inflation: Events ‘R’ Us Timeline 10-6-22, Misery Index: The Tracks of My Fears 10-6-22).
See also:
Footnotes & Flashbacks: Asset Returns 7-28-24
Presidential GDP Dance Off: Clinton vs. Trump 7-27-24
Presidential GDP Dance Off: Reagan vs. Trump 7-27-24
PCE June 2024: Inflation, Income, and Outlays 7-26-24
2Q24 GDP: Into the Investment Weeds 7-25-24
GDP 2Q24: Banking a Strong Quarter for Election Season 7-25-24
Footnotes & Flashbacks: Credit Markets 7-22-24
Footnotes & Flashbacks: State of Yields 7-21-24
Footnotes & Flashbacks: Asset Returns 7-20-24
Industrial Production June 2024: Is the Sector Rotation Alive? 7-17-24
Housing Starts June 2024: Still All About the Deliveries 7-17-24
Retail Sales: Second Wind 7-16-24
Footnotes & Flashbacks: Credit Markets 7-15-24
Consumer Sentiment: Still Feeling the Heat 7-12-24
Homebuilder Equities: “Morning After” on Rate Optimism 7-12-24
Homebuilders: Equity Performance and Size Rankings 7-11-24
CPI June 2024: Good News is Good News 7-11-24
Footnotes & Flashbacks: Credit Markets 7-8-24
The B vs. CCC Battle: Tough Neighborhood, Rough Players 7-7-24