
PCE June 2024: Inflation, Income, and Outlays
Steady GDP growth with lower PCE price trends over the year may finally allow FOMC action in Sept even if the timing of easing remains subjective on the politics.


DPI, PCE, PCE Price Index, and Core PCE Prices in a Game of Inches.
The moves MoM and YoY in the key metrics are a close call and not making life easier for the FOMC to ease on a MoM uptick in price indexes even if downticks in DPI and consumption help.
These days there is little question that politics colors the interpretation of all policy actions, all court decisions, or even “2% vs. whole milk,” so maybe the FOMC will just do what makes economic sense before the election rather than considering what will generate less whining and conspiracy noise.
The “fed funds minus Core PCE” differential together with the steady progress seen in the Fed’s favored inflation gauge gives the FOMC ample room to maneuver for a September cut, and next week’s FOMC meeting will hopefully offer some language that helps offer some direction into the fall.
The critical consumer sector has been mixed across the various recent releases, but the general drift has been towards slower growth but with enough gas in the tank to keep stock jockeys ebullient without rattling the UST curve.

The PCE numbers today keep the FOMC in its data gathering process seeking enough reasons to take some action before the election, but it is not a layup as the muted moves in the UST highlight (lower by just over -5 bps in 2Y and 10Y as we go to print). The PCE price index YoY weighed in at +2.5% or down 0.1% from May while Core PCE YoY posted +2.6% for June, or flat to May. The PCE price index MoM in June ticked higher to +0.1% in June from 0.0% in May. The Core PCE MoM also ticked higher to +0.2% from +0.1% in May.
The UST curve has for its part been straddling an uncomfortable fence of late (see Footnotes & Flashbacks: State of Yields 7-21-24), and it is hard to see what changes that in this week’s headlines. As noted above, the fed funds vs. Core PCE differential of +2.7% remains in tightening mode across history at 2x the long-term median but below past inflation war medians (3.5% median). The FOMC may need more support or at least some MoM declines to get there.
In the 2Q24 release yesterday (see GDP 2Q24: Banking a Strong Quarter for Election Season 7-25-24), the full 2Q24 PCE price index weighed in at +2.6% vs. +3.4% in 1Q24 yesterday with +2.3% in 2Q24 from 3.1% on the price index for gross domestic purchases. The market had ample reason to get anxious around today’s release after a very respectable set of 2Q24 GDP numbers in the report yesterday from personal consumption to fixed investment.
The revisions from May complicate the story a bit on the Disposable Personal Income (DPI) vs. Personal Consumption Expenditures (PCE) relationship. The May DPI was revised lower and May PCE revised higher. In June, DPI declined MoM to +0.2% from +0.4% while PCE MoM posted +0.3%, down from the revised +0.4% in May. DPI in June fell short of PCE, and that sends mixed signals even with PCE lower from May.

The above chart offers a long-term history on PCE prices and Core PCE. The medians of +2.6% PCE and +2.4% Core PCE are right around where we are now, and that can be an excuse for the FOMC if they decide that they do not need to wait for +2.0%. As highlighted in the event box, the economy, the US, and the world saw some very busy and tumultuous years that rolled into those medians.
FOMC and the politics of cutting rates…
The balance of growth vs. confidence in more declines in inflation is no picnic for the FOMC. The mix of inputs in GDP tells a good economic story alongside favorable inflation trends LTM (see GDP 2Q24: Banking a Strong Quarter for Election Season 7-25-24, 2Q24 GDP: Into the Investment Weeds 7-25-24), but the confidence factor at the FOMC needs to be high given the political stakes.
Politics should not be the main swing factor in an FOMC decision, so this month will be interesting wording and will be again in Sept. We have not had a major inflation fighting war in over 4 decades, and this one is at a critical juncture just as the most toxic election since 1860 is underway. I watched the 1968 election and Chicago street battles and skull-cracking on TV. The stakes in this election are higher. For the FOMC, they know the Trumpian Project 2025 activists are looking to take scalps regardless of what the Fed does, so maybe they will say “to hell with appearances. Let’s just do what makes sense in the inflation fight and protecting the economy.”
Away from the Fed, we think back to the NBER holding off on declaring the end of the recession until after the Nov 1992 election. We then saw NBER come out in Dec 1992 and declare that the recession ended in March 1991 (see Business Cycles: The Recession Dating Game10-10-22). George HW Bush justifiably might have felt ill-used by the delay of the Cambridge-based economic clique until after the election, but he did not order anyone to sack the Capitol. Those were the days of, “It’s the economy stupid.” Clinton won a 3-way race with only 43% of the vote with Ross Perot playing third party spoiler at just under 19% of the vote. That is the difference between a WWII hero and a Trump.
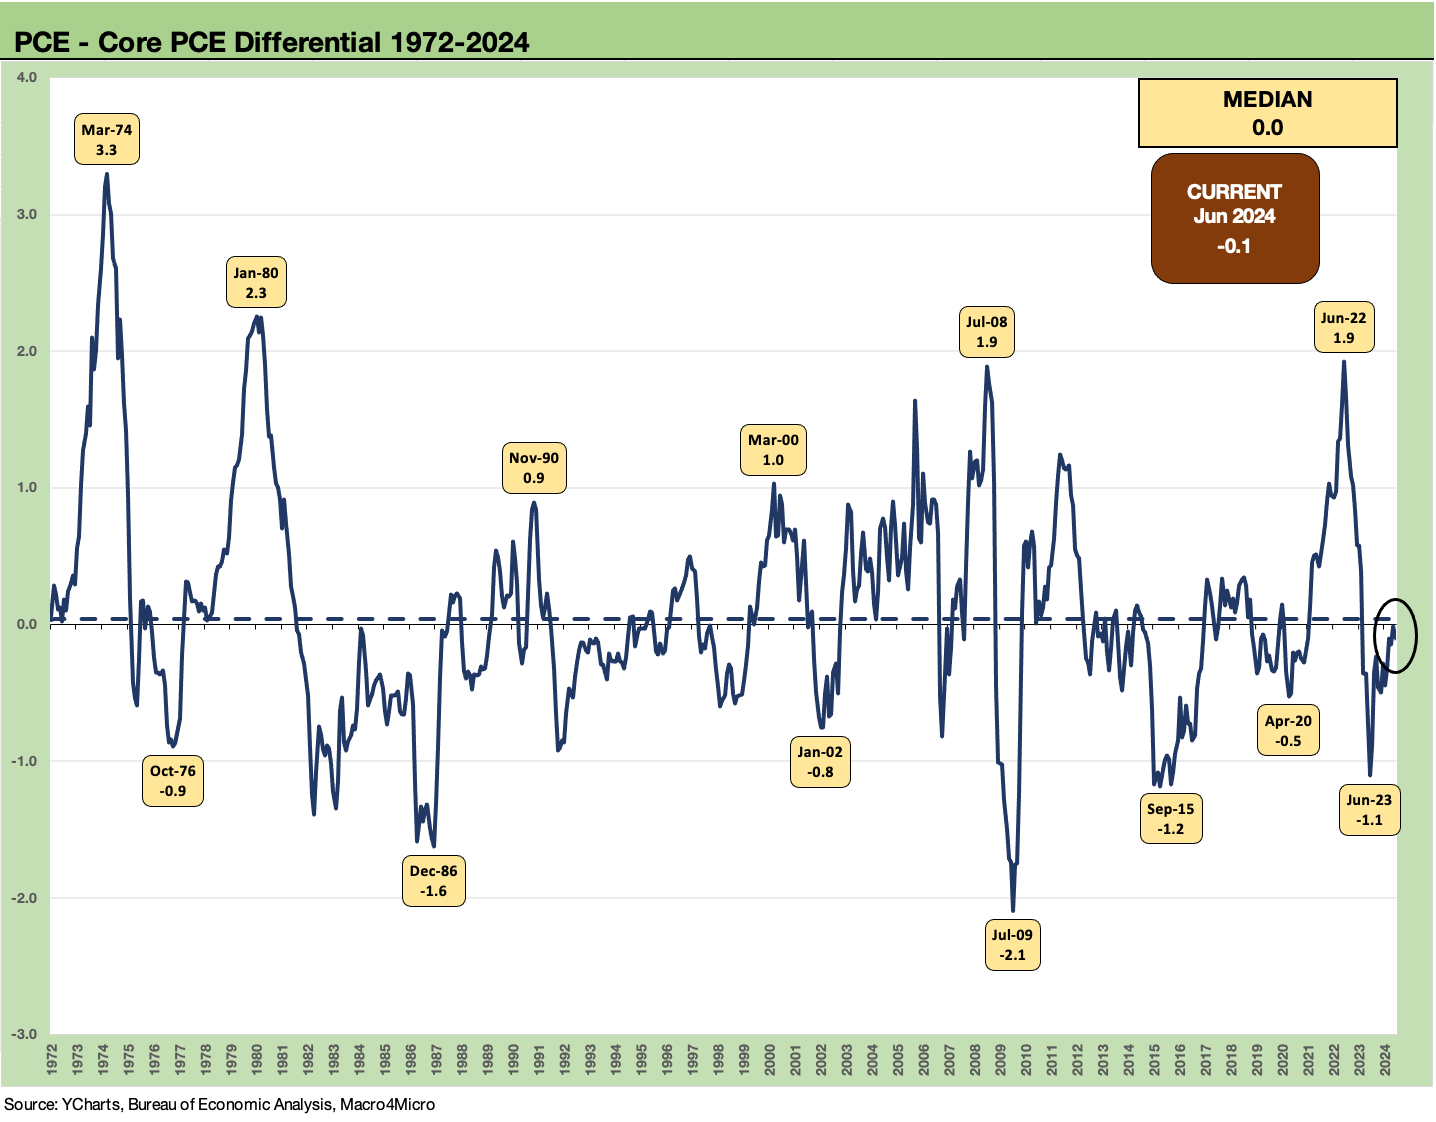
The above chart updates the long-term running differential of headline YoY PCE price inflation and Core PCE, and the two have essentially converged in line with the long-term median. For those that focus more on one or the other, that differential is not the main event at this point.

The above chart updates the running PCE and Core PCE numbers from 1997. This median supports the idea of the 2.0% target. As we usually say, this period is also one that included a lot of crises, ZIRP, and QE, so it is not a normal mix of cycles by any stretch.
The Greenspan hyper-easing with the bank asset quality problems of the early 1990s and then the TMT crisis in his last stretch were extraordinary periods (see Greenspan’s First Cyclical Ride: 1987-1992 10-24-22, Greenspan’s Last Hurrah: His Wild Finish Before the Crisis 10-31-22). Then came the crisis and ZIRP years, light “normalization” and then COVID’s return to ZIRP make that 2.0% target no easy feat to replicate.
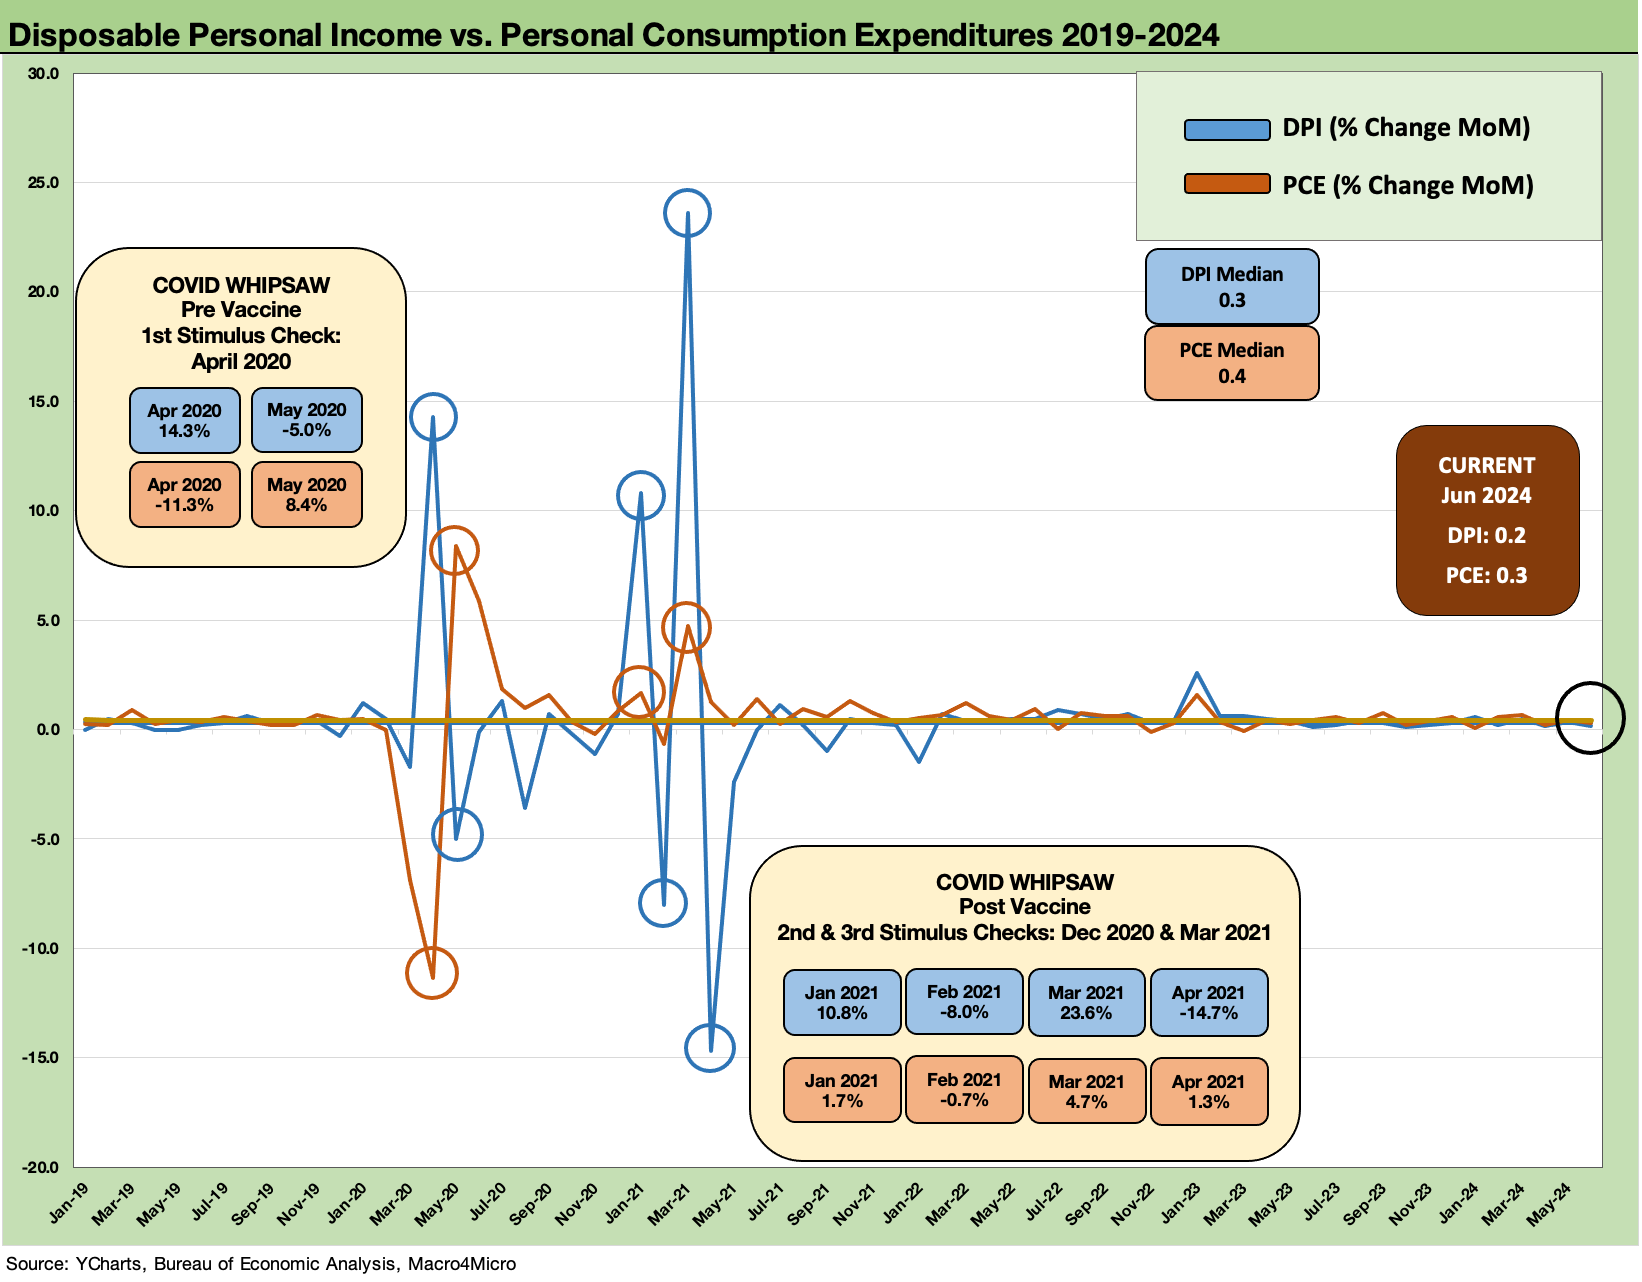
The above chart shows how outlandishly out of the norm COVID was with the stimulus and adjustments to DPI that came with the fiscal actions. While the GOP likes to point fingers at the Democrats for going second, the old saying of “it takes two” applies here.
Tracing what impact those stimulus DPI moves had on inflation and how the demand spike would influence markets relative to constrained supply chains was hardly a science or any way predictable in a mass health crisis with such widespread death. The narrow targeting of a single stimulus action is just the usual politics. We like including the chart as a reminder of what an extraordinary period it was.
Massive tax cuts and deficit spending, protracted ZIRP and QE and a pandemic not seen in a century were inevitably going to “break something.” One could argue that rejecting the election outcome, sacking the capital and denying Presidents the right to nominate Supreme Court justices did a lot of damage to sound economic policymaking by fostering such polarization and preventing compromise (aka creative problem solving). Legislators cannot agree on the weather. The result is extremists of very limited skill sets get elected since they are graded on extreme behavior and not knowledge or experience. In some cases, brain wave activity is a leap of faith.

The above chart recaps the MoM DPI vs. PCE monthly moves. In theory, the DPI rate should outpace the PCE growth, and we should see some savings rates that are rational. We are clearly not there yet.
See also:
2Q24 GDP: Into the Investment Weeds 7-25-24
GDP 2Q24: Banking a Strong Quarter for Election Season 7-25-24
Footnotes & Flashbacks: Credit Markets 7-22-24
Footnotes & Flashbacks: State of Yields 7-21-24
Footnotes & Flashbacks: Asset Returns 7-20-24
Industrial Production June 2024: Is the Sector Rotation Alive? 7-17-24
Housing Starts June 2024: Still All About the Deliveries 7-17-24
Retail Sales: Second Wind 7-16-24
Footnotes & Flashbacks: Credit Markets 7-15-24
Consumer Sentiment: Still Feeling the Heat 7-12-24
Homebuilder Equities: “Morning After” on Rate Optimism 7-12-24
Homebuilders: Equity Performance and Size Rankings 7-11-24
CPI June 2024: Good News is Good News 7-11-24
Footnotes & Flashbacks: Credit Markets 7-8-24
The B vs. CCC Battle: Tough Neighborhood, Rough Players 7-7-24
Payroll June 2024: The Race Gets Confusing 7-5-24
JOLTS May 2024: The Jobs Oasis Still Has Water 7-2-24
Footnotes & Flashbacks: Credit Markets 7-1-24
State Unemployment: A Sum-of-the-Parts BS Detector 6-30-24
The Debate: The China Deficit and Who Pays the Tariff? 6-29-24