Bear Flattener: Today vs. 1994 and Aftermath
We look back at the Fed surprise hikes of 1994 as the Mother of All Bear Flatteners may lose its crown in 2022.
Summary
The desire to look at past cycles for reassurance makes sense, and the 1994 hike-fest by the Fed is mentioned by some. The huge rally that followed in 1995 gets people hopeful that such a path can be found in 2023. We see 1994 as a less useful frame of reference since that was a solid growth year with low inflation and was a clear overreaction by the Fed on theories of future inflation that were not well founded (Nostradamus was on leave from the FOMC that year). The 1990s was in a class by itself as a record-long expansion at the time during a rapidly evolving credit market. In today’s backdrop, the stagflation elements in the face of 50-year lows in unemployment and steady industrial production makes this a different animal.
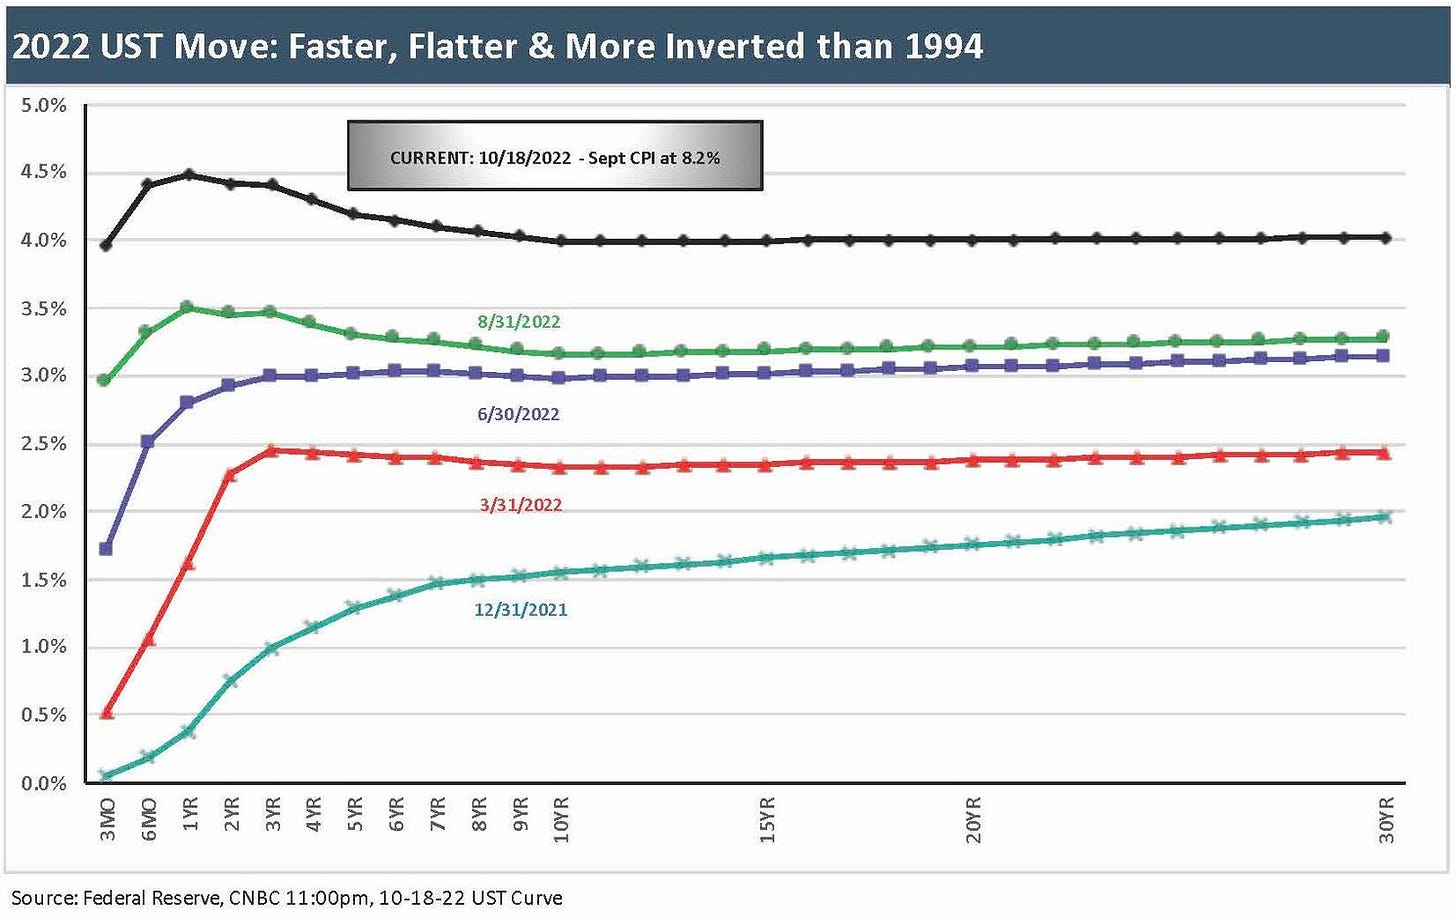
The above chart shows an upward move in fed funds with a sharp move higher in the UST curve that has inflicted negative returns across the board in equities and bonds. I’m not going to replay the key risk drivers already posted in last week’s commentary (see House of Pain: Markets Jump Around). I also framed my core view that current inflation levels and fed funds rates are out of alignment and signal that CPI must come down quickly or fed funds will need to move materially higher (see Fed Funds-CPI Differentials: Reversion Time?). Simply put, a 5-point differential between the two is not sustainable. That is based on the history of the “Fed Funds – CPI” differentials, as well as what did not work in the 1973-1975 stretch and what did work in the 1980-1982 timeline.
Lookback: The 1994 Fed Ambush
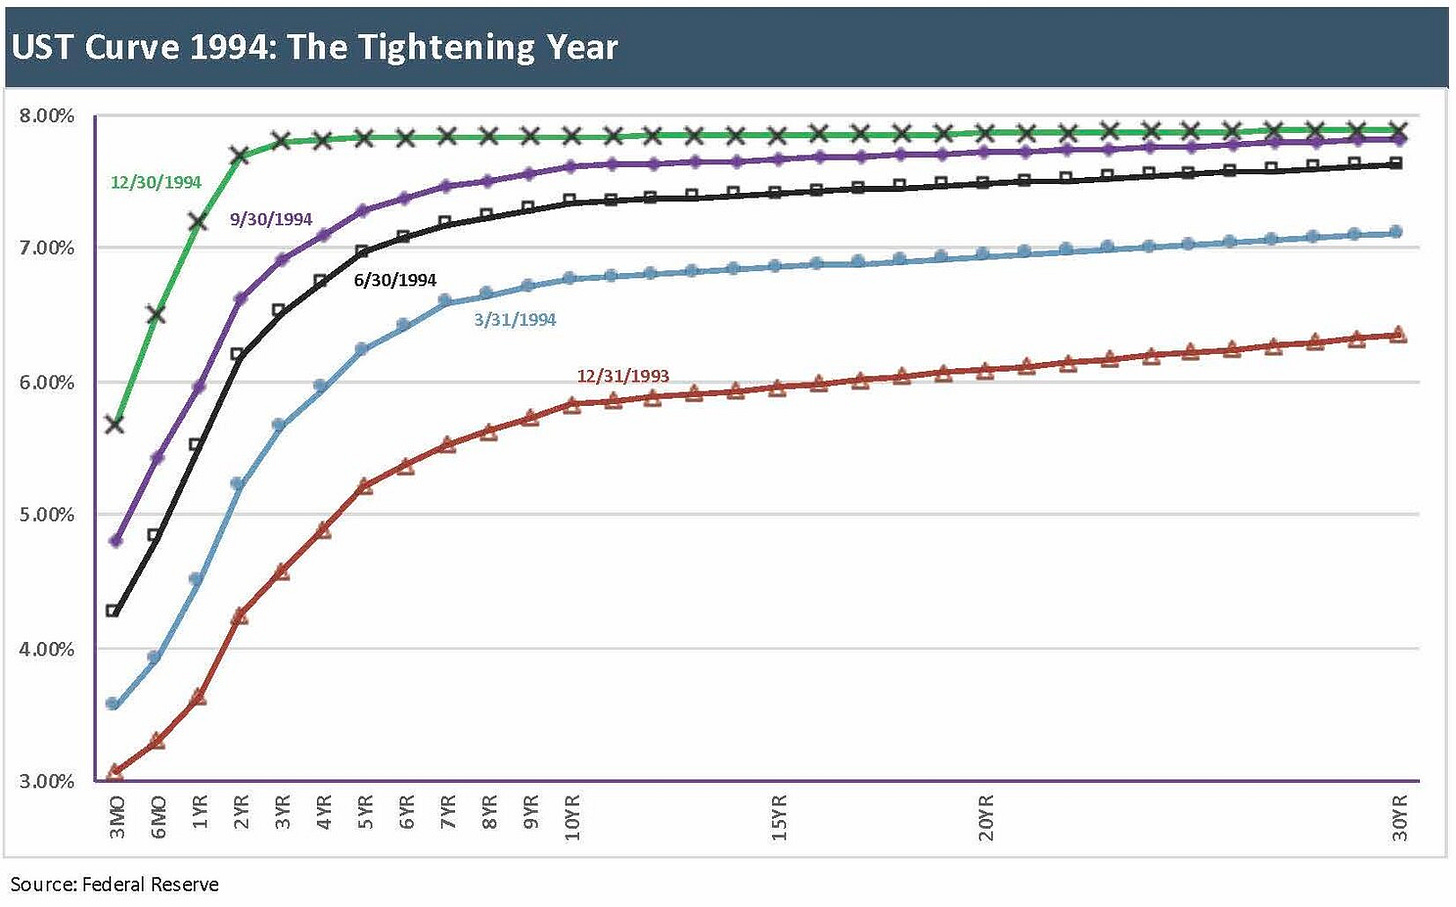
The chart below details the 1994 UST curve move that I used to call “The Mother of All Bear Flatteners.” This flattener also came with a pronounced upward shift that inflicted a lot of pain on duration. I may have been too quick with the superlative in 1994, but it was close to the hyperbolic use of the phrase “Mother of all Battles” by Saddam Hussein back around when the bombs started dropping in January 1991 in the first Iraq Gulf War. That “war” ended rather quickly and was less of a Mother and more of a Crazy Aunt in the attic.
The moniker “Mother of all Flatteners” (with a partial inversion) probably applies more to today since it’s taking place in the face of inflation highs not seen in four decades. In contrast, 1994 was a low inflation, high growth year. The FOMC action in 1994 was one of several struggles that the Fed seemed to be having in the face of hot economic numbers still being generated as the cycle continued with low inflation, tight labor, and high-capacity utilization. The Fed has been wrestling with its “NAIRU” numbers for decades and the 1990s was no different than in other decades since the 1980s. Today, with unemployment at a 50-year low, inflation has already arrived in force.
1994 is worth more focus than most years for today’s investor since it was the last time before 2022 that the Fed raised its target rate by 75 bps in one move. 1994 was also a year when monetary policy was brutal on duration, credit and stock markets despite solid economic growth and a default rate that was cut in half from 1993 to 2% by midyear 1994. The good news (so we don’t bury the mid-90s lede) is that a nasty 1994 with its setbacks then saw the best S&P 500 return of the 1990s in 1995. The 1995 markets also featured a major UST curve long end rally on the way to cyclical credit spread lows in US HY 1996-1997.
Whether Greenspan simply found Clinton and Gingrich annoying or whether the Fed completely misread the inflationary trends, the year 1994 is a reminder that the Fed can surprise the markets as it raised rates 6 times in a recovery and growth year with low inflation. Perhaps after running the steep curve and low fed funds into overtime well into the expansion, Greenspan was getting “easers remorse.” We saw hyper-easing from Greenspan starting with 9% handles on fed funds in 1989 all the way down to a 3.0% rate in 1992 that flatlined there until early 1994. Perhaps he wanted to quit while ahead, but it was a move the markets clearly did not need in retrospect. Then he eased too long again in 2001-2004, but that is a story for another day.
Key takeaways in 1994:
The Fed moved fast and hard and picked up speed: We plot each quarterly UST curve in the lead-in chart although there were six separate Fed hikes during 1994 starting from a 3.0% rate and ending at 5.5%. Inflation (CPI) was low at 2% handles with one brief tick at 3.0% in September. The 1993 inflation rate was mostly in the mid-2% handle range across the year, so one cannot argue that 1994 numbers were signaling trouble on the inflation front. In fact, core inflation was down from 1993. In other words, inflation was in check even if expectations around where inflation might go in a solid expansion could be debated (or surveyed).
The 1994 tightening included two 50 bps hikes and a 75 bps move in fed hikes #4, #5, and #6, after three smaller 25 bps hikes. It is notable that 1994 GDP growth was strong and inflation low. Both of these trends contrast sharply with 2022’s high inflation and two quarters of contraction early in the year. In 1994, when the smoke cleared on the last November 75 bps hike, the 1Y UST was up by 360 bps to 7.2%, the 5Y was out by 264 bps to 7.85%, the 10Y out by 204 bps to 7.85%, and the 30Y out by 155 bps to 7.9%. All in, the curve was flatter but not inverted and still somewhat steep on the front end from 3M to 5Y UST.
Risk assets took some pain: The 1994 tightening and yield curve shift hurt risk assets across the board and sent a few mortgage-heavy hedge funds to the margin call emergency room. The year also hammered Orange County and created the first big round of question marks around how market surprises and extreme volatility can create counterparty exposure problems that become legal problems and PR disasters. Asset returns were awful and made 1994 the last year before 2018 where cash was the #1 performing asset classes across the main debt and equity benchmarks we watch. The consistent pounding by the Fed left bond benchmarks negative across US HY, Mortgages, US IG corporates, and the UST index as duration felt the pain more than credit returns.
The mortgage market was a notorious mess and later in the decade there was more of the same with subprime mortgages and stress points for servicers. None of those experiences and major P&L hits and counterparty (or litigation) stress headed off what was to come in the 2004-2008 subprime RMBS craze and related derivative excess. While the fish were running, risk management still took a back seat. P&Ls trumped risk management in a capital market that was rapidly evolving. The easy way around risk controls, besides citing profit goals, was to say: “the market has changed.”
Fundamental economic trends were better than risky asset trends in 1994: In 1994, overall fundamentals were sound in the broader economy despite the weak performance in capital markets assets. We saw four solid quarters of growth with a 5.5% 2Q94 and a 4.7% 4Q94 even in the face of tightening. The annual rate for 1994 weighed in at 4.0%, the best since 1988 and to that point only trumped by the three-year run from 1983 to 1985 under Reagan.
4% handle levels on annual GDP growth were seen in all four years of Clinton’s second term. Levels this high were not seen again until 2021, with Biden in office. As a reminder, neither Obama nor Trump ever cracked 3% on an annual rate. That by itself draws a big contrast from a year like 2022 with two negative quarterly prints and a battle ahead to get a 1% handle for 2022. In the end, a 4.0% annual GDP and a year with 11 of 12 months at 2% handle CPI lacks much overlap with today’s numbers.
Credit was a key driver in 1994, but 2023 will get stingy: The protracted Fed support through 1991 (reminder: recession tough was March 1991), that extended well into the recovery, left the economy ready for steady growth, while the bank mergers left a much healthier bank system in place. With the banks and brokers starting to converge under deregulation, the trick would be monitoring whether the banks turbocharged growth via credit as they scrambled to enter new markets, pick up share, and provide more products. As we know in retrospect, they did all of that and more. The appetites for risk were mirrored on buy side asset gathering trends and in the rebound of M&A. As the FOMC looks back to 1994, that is not a helpful guide for optimism in the remainder of 2022 and into 2023.
The drift in asset allocation today in 2022 would have to shift dramatically to get that influx of credit flows seen back in 1994-1997, and many of those banks/brokers diving into the space in 1994 took a beating across a few cycles. Some of the banks disappeared in the credit crisis, while major brokers either merged, merged while collapsing, or simply collapsed. The market has less active market makers in OTC products today than 1994. Those remaining are larger but fewer. The two remaining independent major brokers from the old “bulge bracket” are now essentially part of regulated bank holding companies (Goldman and Morgan Stanley). Many banks participate in the underwriting and “a place on the right” of the tombstone, but they don’t participate in making markets.
Political change was a big theme in 1994: Clinton had a rough first two years as his administration got mired in a failed health care initiative that was not addressed for years given how politically fraught the process was (Obama worked to get the ACA enacted after three more Presidential terms passed by). The swing in the Congressional lineup in 1994 was tagged as the “Republican Revolution” with a +54 swing in the House and +8 in Senate. That was a period when some Democratic Senators changed uniforms to the GOP side. Political tension was high on old school topics like “tax and spend” but it seems quaint compared to the Armageddon themes of today.
1995-1996: Happy dreams may come true, but might not happen to you…
Below I look at the 1995 rebound in bonds and how that flowed into two very strong years for duration and credit returns. US HY bonds were also setting the stage for the 1997 lows in spread and a virtually unlimited ability to print TMT bond deals. The market also saw a flood of EM corporate and EM sovereign debt during this multiyear span. I certainly don’t see that in the cards for 2022-2023. The recent spike in the dollar vs. EM currencies also flashed back to some serious problems in the 1990s from Mexico at the end of 1994 to Asia in 1997-1998 then back around the bend on global EM contagion fears in 1998.
Key takeaways from 1995-1996
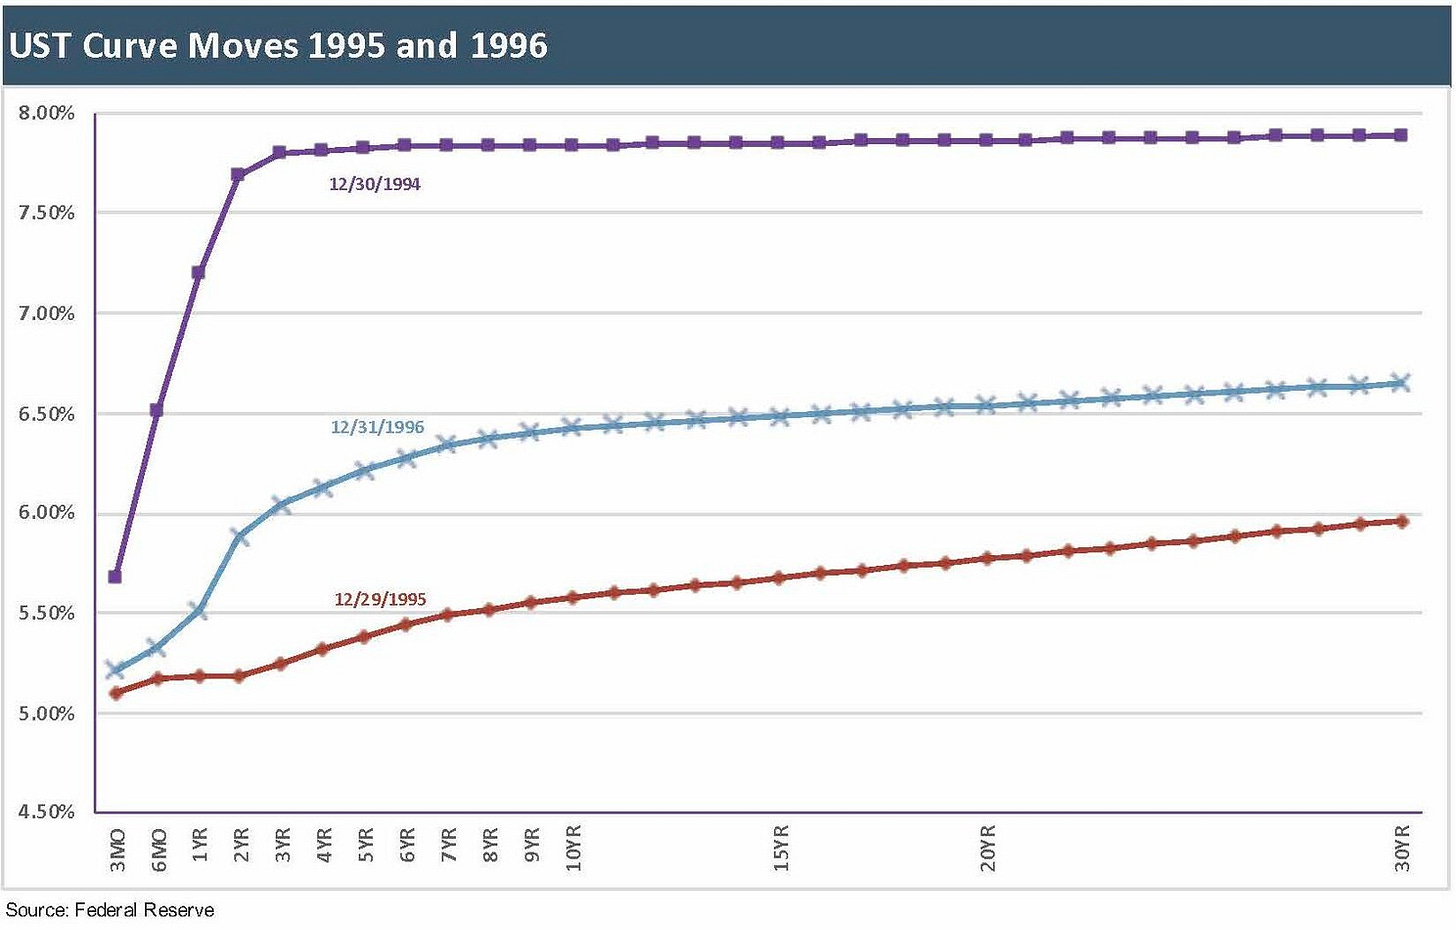
Risk asset rebound even with lower GDP growth rate: After the relative turmoil of 1994, the S&P 500 turned in its best year of the bull market 1990s the very next year in 1995, so the yield curve pain of 1994 did short-term damage only. To add to the reversal of fortune in a positive direction, the yield curve flattened and shifted materially lower. A repeat of this history is the fervent wish of investors in both the equity market and long duration classes in 2022.
After 1994 blindsided the market only a few years into the cycle, the criticism was loud. We use the term “ambush” when describing the reaction. However, the facts show that fundamentals were strong after the Fed had worked to keep rates low well into overtime and beyond a recession trough date that was tagged as March 1991 by NBER (see Business Cycles: The Recession Dating Game on that score).
The Fed changes back to “cutter’s remorse”: The above chart plots the UST shift that unfolded after the onerous round of tightening in 1994 which precipitated poor performance in risky assets, then gave rise to a major rally in equities, a pronounced bull flattener of the UST curve, and fresh optimism coloring cyclical expectations even though the GDP growth run rate ticked down from 1994 into 1995.
The annual GDP growth rate of 4.0% in 1994 dropped to 2.7% in 1995—more in line with the 1993 numbers. Then in 1996, annual GDP ticked back up to 3.8%, marking the halfway point for the longest expansion in history at that time. Fed funds was bumped by 50 bps to start Feb 1995 but saw two 25 bps cuts (July, Dec) to end the year with flat fed funds vs. the start of the year. 1996 was very uneventful for the Fed with one 25 bps cut to 5.25% to start the year.
Asset return rebound the major theme in 1995: The performance of equity benchmarks in 1995 was the most notable trend after the 1994 disappointment with the S&P 500 turning in a 37.5% total return for its best year of the 1990s. The emergence of more TMT equity bullishness drove an even strong set of number for the NASDAQ at +40.7%. That very impressive 1995 total return on the NASDAQ was almost matched in 1998 at +40.2% and dwarfed by the 1999 NASDAQ results at +86.1%. Inflation expectations were reported as improving across a wide range of surveys cited by various Fed regional banks, and CPI ended the year in the mid 2% range for 1995. For 1996, CPI was in a low, stable range but CPI ticked higher to a low 3% handle later in 2H96. The UST curve shifted higher in 1996 on economic strength and a slight uptick in inflation.
Duration and credit also won the day in 1995: US HY posted a 20.5% total return, and the IG index total return weighed in just under +22%. The 5Y UST moved around 245 bps lower and the 10Y around 226 bps lower. Cash as an asset class moved from #1 in 1994 to last place across major equity and fixed income benchmarks but still posted up a 6% area return in 3M UST. That 6% return on cash looks great today given the UST curve in recent years. As we think back to the 1995-1996 period in street credit businesses, the boom was on, the volume of new business was growing, M&A was broad-based across industries in a range of consolidation themes, and Wall Street pay was rising. That was not a bad backdrop for risk taking in the pre-Volcker Rule years.
Evolving structure of US credit markets: The US and European banks were expanding rapidly in capital markets business lines in the US although the financial sector M&A would grab much bigger headlines a few years later. Glass Steagall in substance was dead but would not be officially repealed until later. There was a lot more capital on the sell-side to make markets and underwrite bond deals. The traditional bulge securities firms were swinging away, and the major US commercial banks were building out their operations.
Meanwhile, the major European banks (notably Deutsche and the soon-to-be merged Swiss banks—UBS and SBC) and Japanese banks were making moves with varying degrees of success. The wave of activity and consolidation would pick up materially later as the 1990s proceeded with some classic old school brands rolling up into larger entities. We will look at those consolidation moves in other commentaries.


